From Real Exams Quiz
A Level H2 Economics Policy Evaluation Quiz
Free A Level H2 Econs Policy Evaluation quiz, HY3 Exam version, with questions, answers, and A Level-style practice for Singapore students.
These static practice materials are generated from the site's syllabus and paper-generation workflow, with source and model context shown so students and parents can evaluate the material before use.
Questions
Free quiz and exam paper access
Enter your details to view this paper
Your access is remembered on this device.
Answers
A-Level Economics H2 Quiz - Policy Evaluation (Answer Key)
Total Marks: 40
Topic: Policy Evaluation
Section A: Short Structured Questions (1–5)
1. [2 marks]
One criterion: Allocative efficiency (does the policy move output closer to social optimum), OR equity (distributional impact), OR cost-effectiveness (benefits vs. administrative cost), OR unintended consequences.
Teaching note: Policy evaluation checks if a policy achieves its aim with minimal side effects. Any one valid criterion scores 2 marks.
2. [1 mark]
Right.
Teaching note: A subsidy lowers producer cost, increasing supply at each price → rightward shift of S curve.
3. [2 marks]
Example: A minimum price above equilibrium creates a surplus (e.g., agricultural stockpile); OR discourages consumption of essentials; OR black market development.
Teaching note: Unintended effects are consequences not targeted by policy.
4. [2 marks]
Deadweight loss is the net loss of total welfare (consumer + producer surplus) when market outcome is not socially optimal, e.g., due to tax or intervention.
Teaching note: It is the triangle between MC and MB curves beyond social optimum quantity.
5. [1 mark]
Market-based.
Teaching note: Carbon tax uses price signal; command-and-control uses quotas/standards.
Section B: Data and Diagram Interpretation (6–10)
6. [2 marks]
2022 bill = 2.00 × 50 = 150 m.
Change = 150 − 100 = $50 million increase.
Marking: 1 mark for each year's calculation, 0 if final wrong but working shown partially.
7. [3 marks]
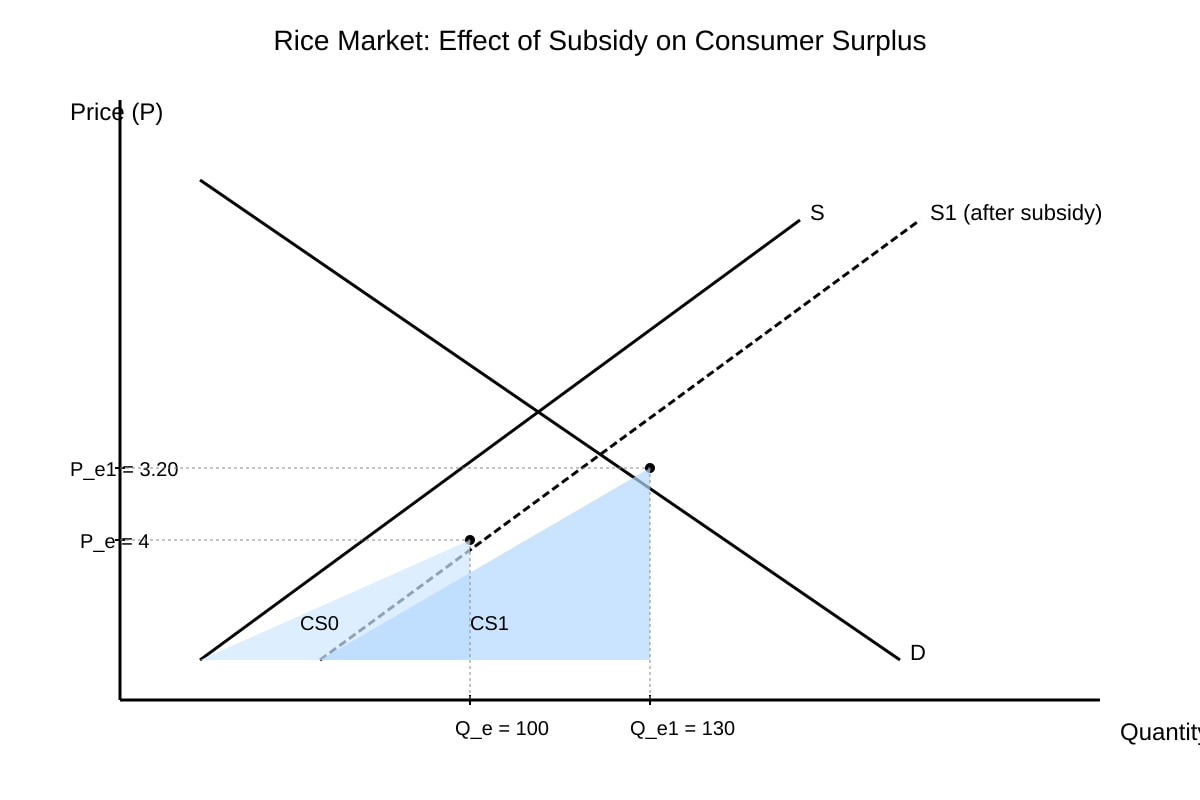
- Draw D and S; initial P_e=4, Q_e=100. [1]
- Subsidy shifts S right to S1; new P_e1=3.20, Q_e1=130. [1]
- Lower price and higher quantity enlarge CS (area between D and price line up to Q). [1]
Teaching note: Consumer surplus = area under D above price.
8. [1 mark]
Recycling rate rose from 22% to 41% (or landfill fell 30%) indicating positive externality reduction.
Teaching note: Welfare improved via reduced pollution.
9. [1 mark]
5.4 − 4.1 = 1.3 percentage points.
Teaching note: Not percent change; subtract rates directly.
10. [3 marks]
GDP growth ignores: (i) income distribution [1]; (ii) environmental degradation [1]; (iii) non-market gains like health [1].
Teaching note: Supply-side policy may raise GDP but worsen equity or sustainability.
Section C: Source-Based Evaluation (11–15)
11. [2 marks]
Domestic steel output rose 8% → protected jobs / industry survival.
Marking: 1 for evidence, 1 for link to benefit.
12. [2 marks]
Construction costs +11% → lower real income / less affordable housing; machinery exports fell → lost competitiveness.
Marking: 1 evidence, 1 explanation.
13. [3 marks]
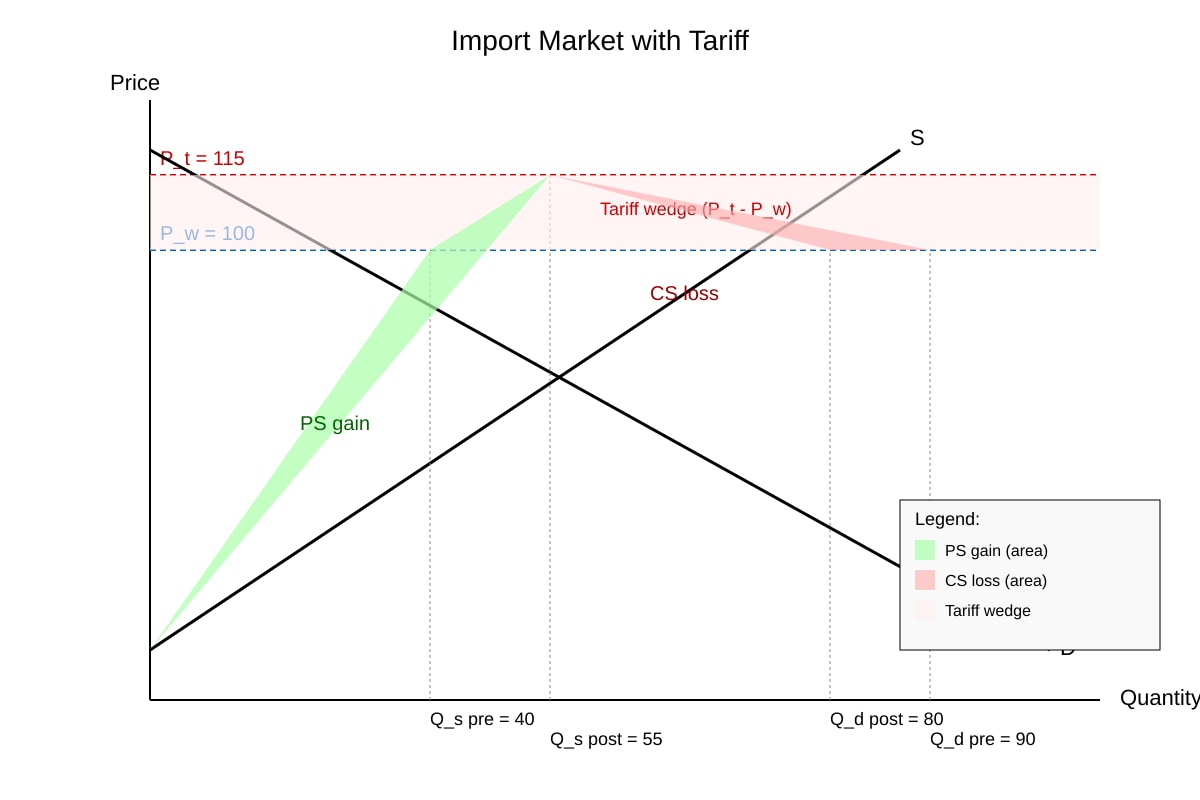
- Diagram with P_w=100, P_t=115, Q_s 40→55, Q_d 90→80. [1]
- PS gain = area of rectangle/triangle for domestic producers. [1]
- CS loss > PS gain + tariff revenue → net welfare loss. [1]
14. [2 marks]
Likely no: tariff raised domestic output but reduced consumer and exporter welfare; net national welfare probably fell (DWL).
Marking: judgment 1, reason 1.
15. [1 mark]
Targeted wage subsidy to steel workers; OR retraining policy; OR temporary adjustment assistance.
Section D: Extended Policy Evaluation (16–20)
16. [2 marks]
May help if enforced and black market absent; but could reduce supply, worsen scarcity. Balanced view needed.
Marking: 1 for benefit, 1 for caveat.
17. [2 marks]
False: subsidies can encourage over-production if positive externality absent; taxes correct negative externalities directly. Evaluation needed.
Marking: 1 correct stance, 1 reason.
18. [2 marks]
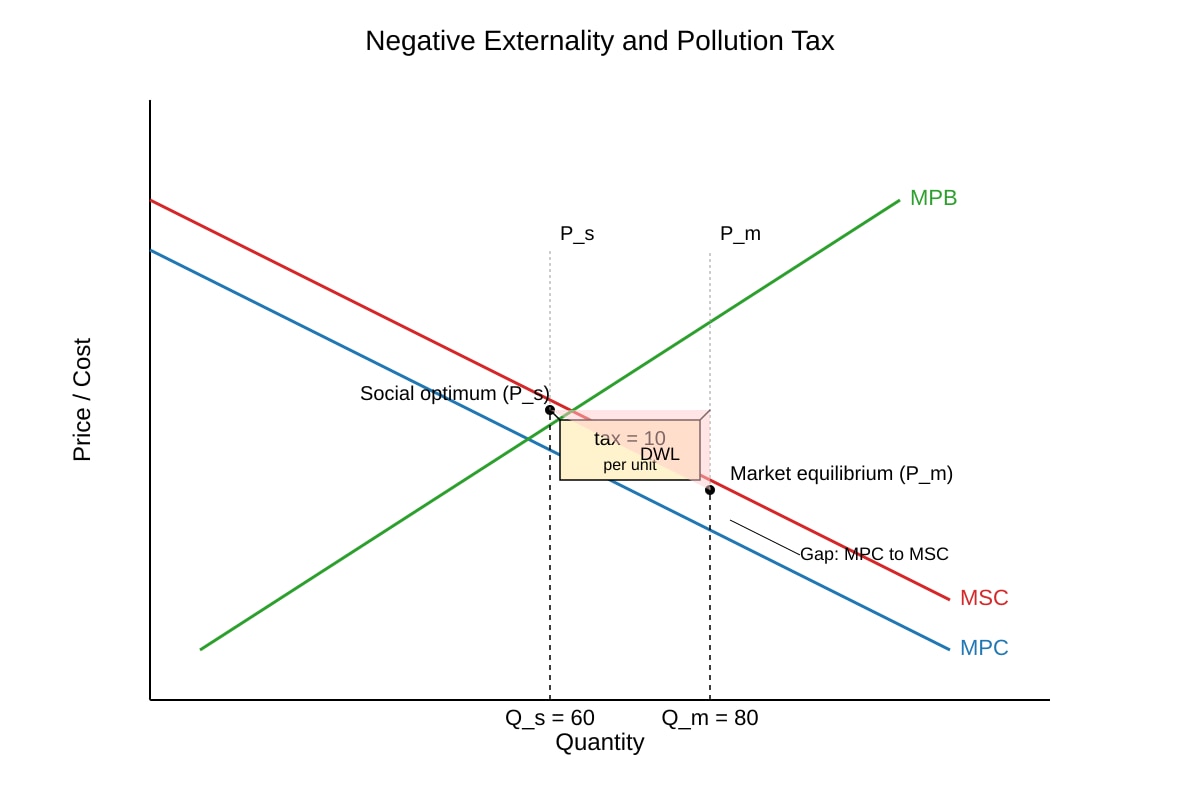
- MSC > MPC gap; tax = 10 shifts MPC to MSC. [1]
- New Q_s=60 = social optimum, DWL removed. [1]
19. [2 marks]
(1) Take-up rate by target group; (2) Effect on female labour force participation; (3) Fiscal cost. Any two with explanation. [1 each]
20. [2 marks]
Disagree: qualitative data (e.g., satisfaction, equity) essential; quant alone misses distribution.
Marking: 1 stance, 1 reason.