From Real Exams Quiz
A Level H2 Economics Microeconomics Quiz
Free A Level H2 Econs Microeconomics quiz, HY3 Exam version, with questions, answers, and A Level-style practice for Singapore students.
These static practice materials are generated from the site's syllabus and paper-generation workflow, with source and model context shown so students and parents can evaluate the material before use.
Questions
Free quiz and exam paper access
Enter your details to view this paper
Your access is remembered on this device.
Answers
A-Level Economics H2 Quiz - Microeconomics (Answer Key)
Total Marks: 40
Topic: Microeconomics
Section A Answers (1–8) [16 marks]
1. [2 marks] The signalling function of the price mechanism is that prices act as signals to economic agents (consumers and producers) about the relative scarcity of a good; a rise in price signals shortage and encourages more supply / less demand.
Teaching note: Price communicates info without central planning. Award 1 mark for "prices convey info on scarcity", 1 for example.
2. [2 marks] Any two of: income of consumers, tastes/preferences, price of related goods (substitutes/complements), expectations, number of buyers.
Mark: 1 each.
3. [2 marks] A movement along the demand curve is caused by a change in the good's own price (change in quantity demanded). A shift of the demand curve is caused by a change in a non-price determinant (change in demand at every price).
Common mistake: confusing own-price vs other factors.
4. [1 mark] Consumer surplus is the difference between what consumers are willing to pay and what they actually pay.
5. [2 marks] PED = −0.4 → price inelastic (|0.4|<1). When price rises, total revenue increases because % fall in quantity < % rise in price.
Mark: 1 for inelastic, 1 for revenue effect.
6. [1 mark] Example: bad weather reducing harvest / increase in cost of inputs / tax on rice.
7. [2 marks] Profit is maximised where MR = MC and MC is rising. (Or: at output where TR−TC is greatest.)
8. [1 mark] E.g., revenue maximisation, profit satisficing, market share dominance.
Section B Answers (9–14) [12 marks]
9. [2 marks]
(a) Equilibrium price = 2, Qd=100, Qs=40 → shortage of 60 units. [1]
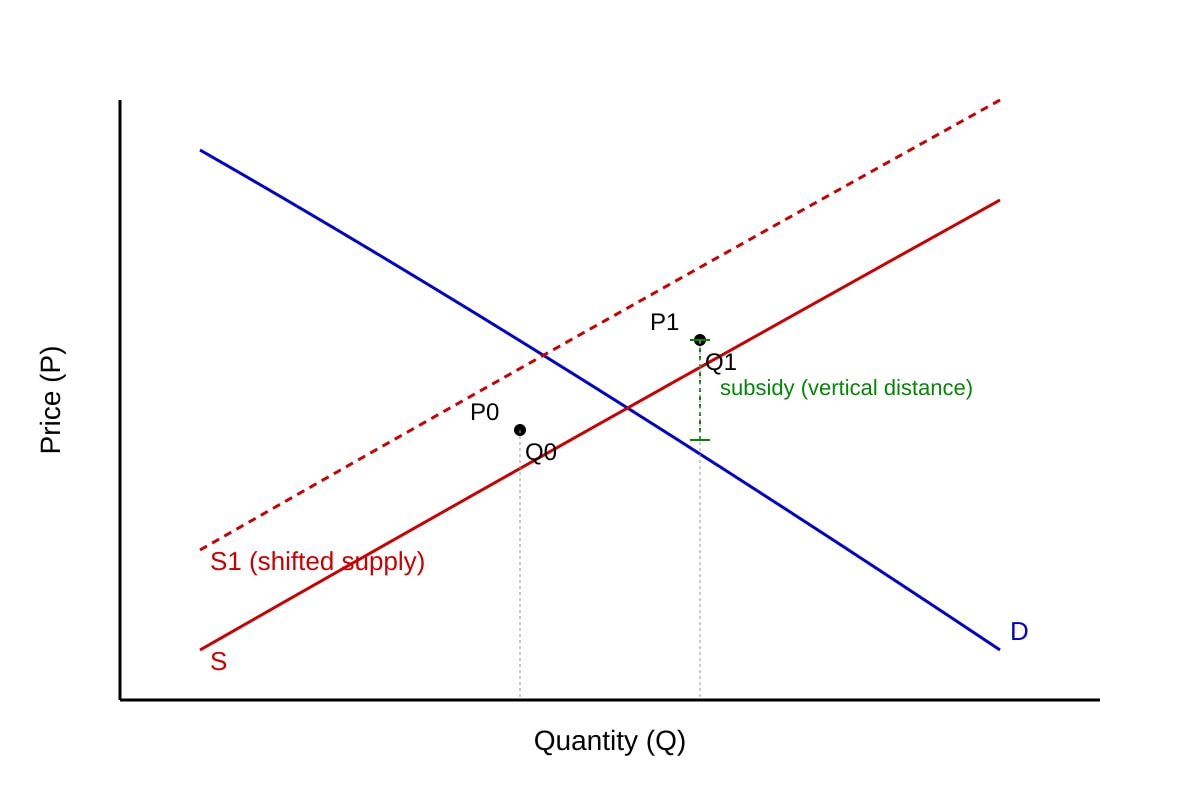
10. [3 marks] Diagram must show: original S and D; new S1 shifted right; P0,Q0 and P1,Q1; subsidy as vertical gap. [3 total: 1 diagram correct shift, 1 labels, 1 explanation]
Teaching: Subsidy lowers cost → supply increases → price falls, quantity rises.
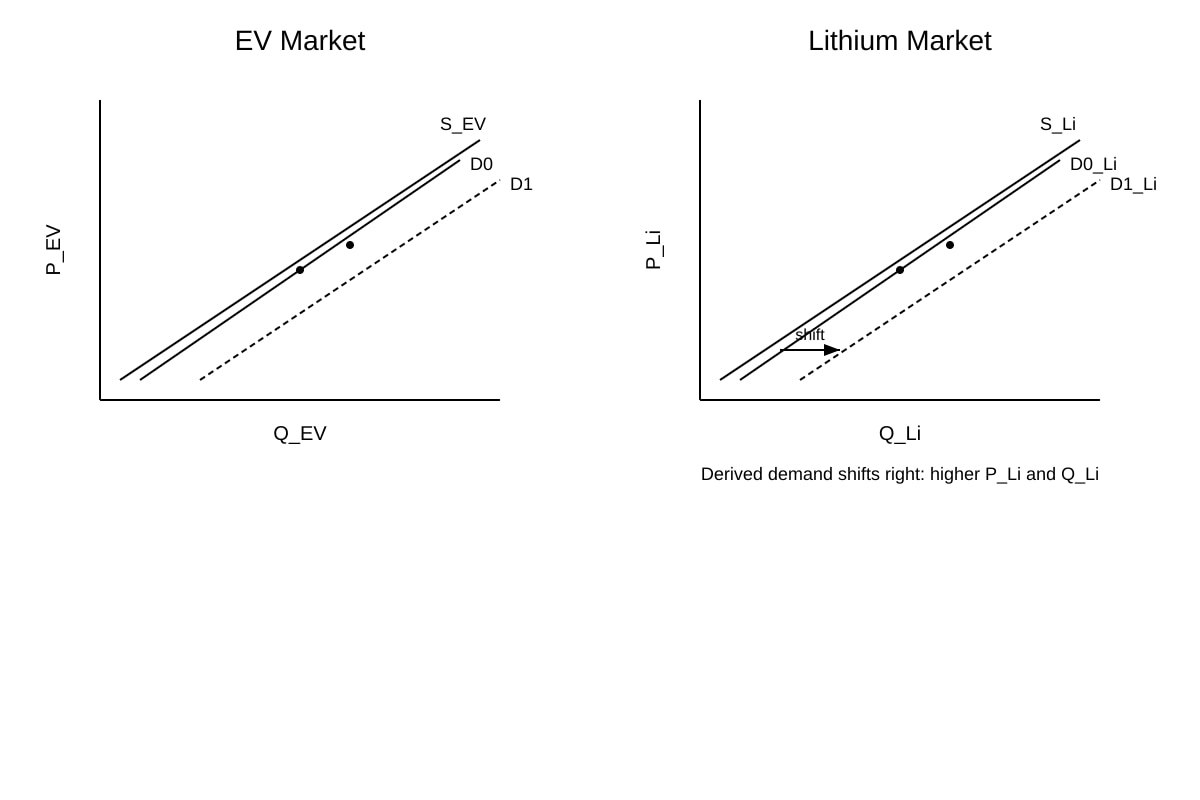
11. [3 marks] EV demand ↑ → derived demand for lithium ↑ → lithium price and quantity ↑. Diagram: two markets, rightward D in both. [1 diagram, 2 explanation]
12. [2 marks] Midpoint Q = (120+100)/2=110; midpoint P=(4+5)/2=4.5. %ΔQ=(20/110)=−18.2%; %ΔP=(1/4.5)=22.2%. PED = (−18.2)/(22.2)= −0.82. [2 for correct calc]
13. [2 marks] Incentive function (prices motivate behaviour); Rationing function (price allocates scarce goods). [1 each]
14. [2 marks] Max price below Pe → shortage (Qd>Qs). Diagram shows price ceiling below eq → excess demand. [1 diagram desc, 1 outcome]
Section C Answers (15–20) [12 marks]
15. [3 marks] Possible benefits: lower prices from scale, better tech. Possible harms: reduced competition, higher prices long run. Balanced discussion with diagram reference = 3.
Descriptor: 1 define merger, 1 benefit, 1 harm/judge.
16. [2 marks] Advertising, branding, product differentiation, service quality. [2 points]
17. [3 marks] Consumer choice affects demand; but info asymmetry, externalities mean govt intervention needed. [1 each: role of consumer, market failure, govt role]
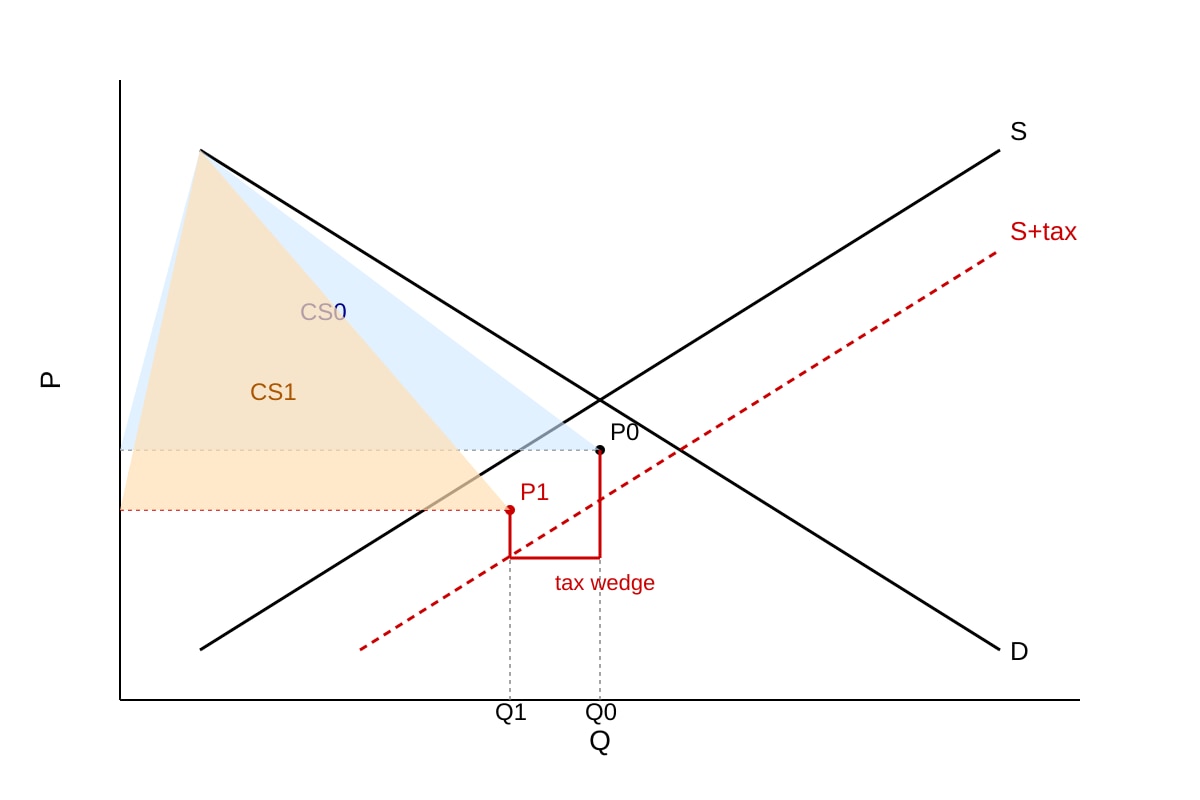
18. [2 marks] Tax shifts S left → P↑ Q↓ → CS falls. Diagram with CS areas. [1 diagram, 1 explain]
19. [1 mark] MC=5, MR=20 → MR>MC always → max at Q where TR max? Actually profit π=20Q−(100+5Q)=15Q−100, max as Q→∞ in linear; but if stop at Q where MR=MC never (MC constant 5<MR20) so firm expands. For quiz simplicity: Q where? Given constant MC<MR, no finite max; state "profits rise with Q, no finite max". Accept Q unbounded, profit grows. [1]
20. [2 marks] Not always: needs market power, separation, no resale. Other strategies may be better. [2 points]