From Real Exams Quiz
A Level H2 Economics Market Failure Quiz
Free A Level H2 Econs Market Failure quiz, LongCat Exam version, with questions, answers, and A Level-style practice for Singapore students.
These static practice materials are generated from the site's syllabus and paper-generation workflow, with source and model context shown so students and parents can evaluate the material before use.
Questions
A-Level Economics H2 Quiz - Market Failure
Name: ___________________________
Class: ___________________________
Date: ___________________________
Score: ________ / 40
Duration: 50 minutes
Total Marks: 40
Instructions:
- Answer ALL questions.
- Read each question carefully and use economic terminology where appropriate.
- For questions requiring diagrams, you may sketch in the space provided.
- Quality of written communication will be assessed in extended response questions.
- The number of marks for each question is shown in brackets [ ].
Section A: Short Answer Questions (10 marks)
Questions 1–5
1. Define the term market failure. Give one example of a cause of market failure. [2]
2. Distinguish between a positive externality and a negative externality, providing one example of each. [3]
3. Explain why public goods are typically underprovided by the free market. [2]
4. State two characteristics of public goods and explain how each leads to the free-rider problem. [3]
5. Explain the difference between a merit good and a demerit good, providing one example of each. [3]
Section B: Data Response and Application (18 marks)
Questions 6–15
Read the following extract and answer Questions 6–11.
Extract: Electric Vehicle Adoption in Singapore
The Singapore government has set a target to phase out all internal combustion engine (ICE) vehicles by 2040. To accelerate the adoption of electric vehicles (EVs), the government introduced the Vehicular Emissions Scheme (VES) in 2021, which provides rebates of up to S25,000forbuyersoflow−emissionvehiclesandsurchargesofuptoS25,000 for high-emission vehicles. Additionally, the government committed to deploying 60,000 EV charging points across the island by 2030.
Despite these measures, EV adoption remained below 10% of new car registrations in 2023. Industry analysts cite high upfront costs, limited charging infrastructure in older housing estates, and consumer range anxiety as key barriers. A study by the Land Transport Authority (LTA) found that each EV on the road generates an estimated S$8,200 in external benefits per year through reduced air pollution and lower healthcare costs for the population.
However, critics argue that the VES rebates disproportionately benefit higher-income households, who are more likely to purchase new EVs. They also note that the electricity used to charge EVs in Singapore is predominantly generated from natural gas, which still produces carbon emissions, albeit lower than petrol or diesel.
6. Using the extract, identify one example of a positive externality associated with EV adoption. Explain why this leads to underconsumption in a free market. [3]
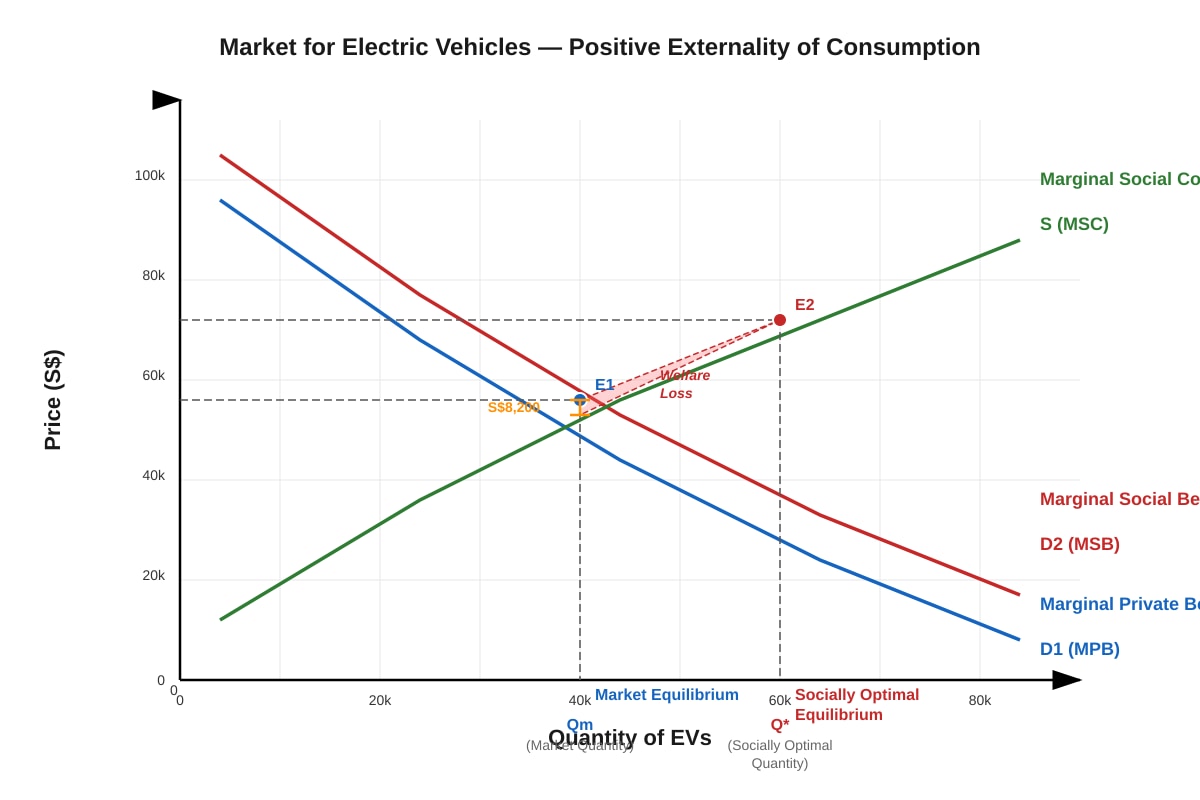
7. The LTA study estimates external benefits of S$8,200 per EV per year. Using a diagram, explain how this externality causes the market equilibrium quantity to be below the socially optimal quantity. [4]
Generated graph for Q7.
8. Explain how the Vehicular Emissions Scheme (VES) acts as a form of government intervention to correct the market failure identified in the extract. [3]
9. The extract states that EV charging infrastructure is a challenge. Discuss whether EV charging points are a public good or a private good. Justify your answer. [3]
10. Analyse one limitation of the VES rebate policy mentioned in the extract. [2]
11. Suggest and explain one additional policy measure the Singapore government could use to increase EV adoption, other than the VES. [3]
Read the following additional extract and answer Questions 12–15.
Extract: Congestion and Public Transport in Singapore
Singapore has long grappled with traffic congestion on its roads. The government implemented the Electronic Road Pricing (ERP) system, which charges motorists for using certain roads during peak hours. The ERP system was upgraded in 2024 to a satellite-based system (ERP 2.0), allowing more granular and dynamic pricing based on real-time congestion levels.
The government also invests heavily in public transport, with plans to expand the MRT network to 360 km by 2030. Public buses and trains receive government subsidies to keep fares affordable. Despite these measures, car ownership remains high relative to population size, partly due to the cultural status associated with car ownership and the convenience of private transport in a small, densely populated city-state.
A 2023 study estimated that traffic congestion in Singapore costs the economy approximately S3.5billionperyearinlostproductivity,wastedfuel,andenvironmentaldamage.Thestudyalsofoundthata10420 million annually.
12. Using the extract, explain why traffic congestion represents a form of market failure. [3]
13. Explain how the Electronic Road Pricing (ERP) system attempts to correct the market failure of traffic congestion. [3]
14. Using a diagram, analyse how a subsidy on public transport can help reduce traffic congestion. [4]
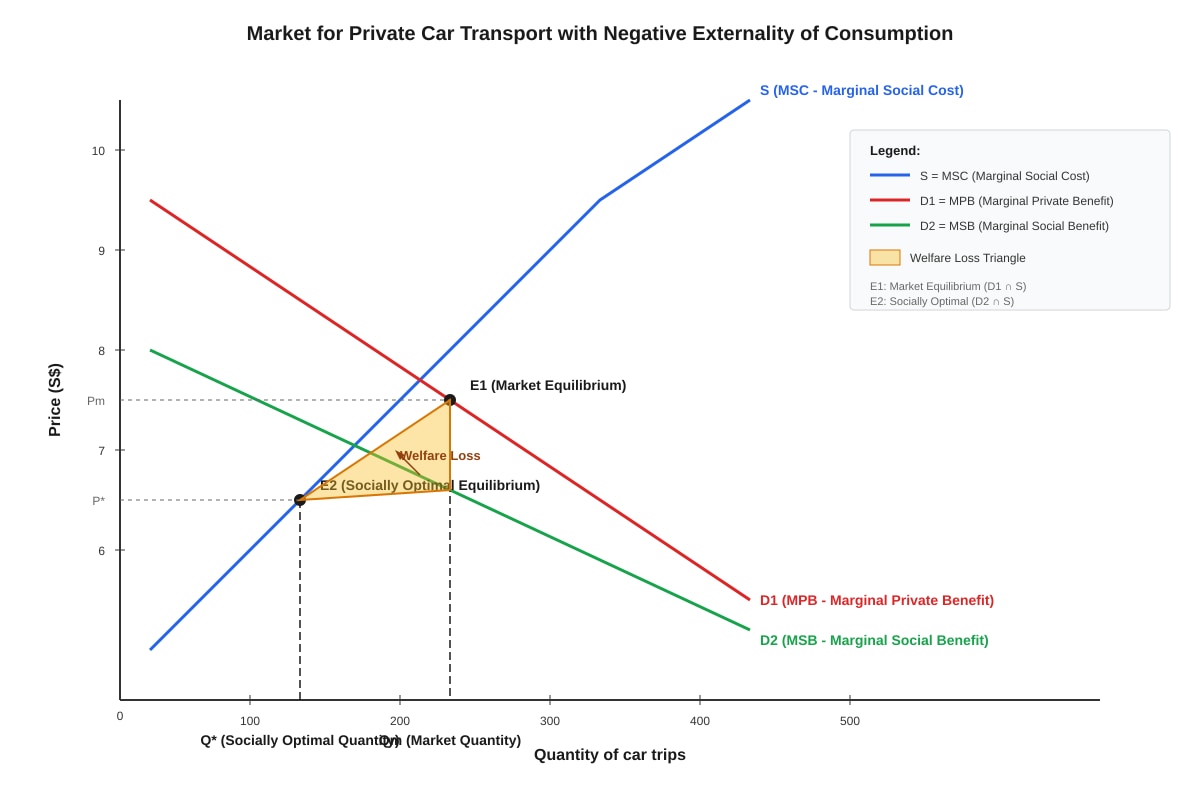
Generated graph for Q14.
15. Discuss one limitation of using subsidies on public transport as a policy to reduce traffic congestion in Singapore. [2]
Section C: Essay Question (12 marks)
Questions 16–20
Answer ALL parts of Question 16.
16. In 2023, the Singapore government introduced a carbon tax of S25pertonneofgreenhousegasemissions,withplanstoraiseittoS50–S$80 per tonne by 2030. The tax applies to power stations and large industrial emitters producing more than 25,000 tonnes of CO₂ equivalent annually.
(a) Explain why carbon emissions represent a market failure. [3]
(b) Using a diagram, analyse how a carbon tax can correct the market failure associated with carbon emissions. [5]
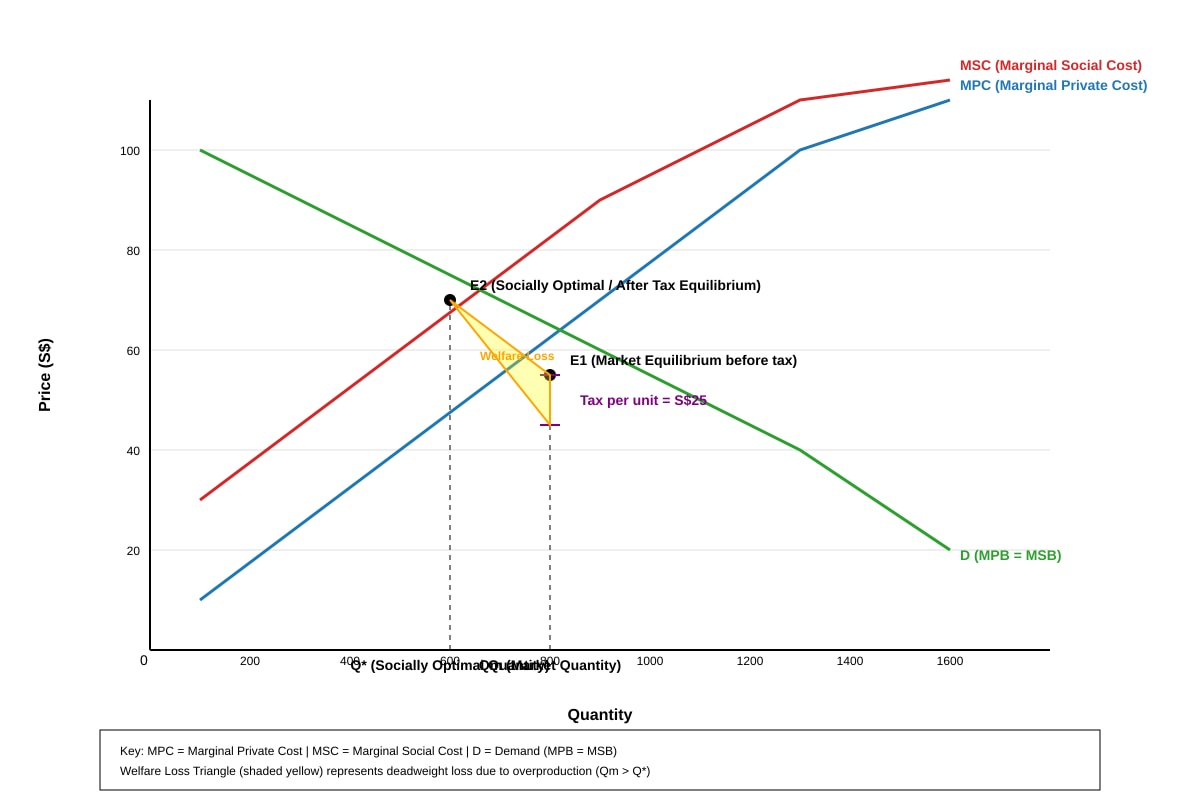
Generated graph for Q16b.
(c) Discuss whether a carbon tax is the most effective policy for Singapore to reduce carbon emissions, compared to alternative policies such as tradable permits or regulation. [4]
Answer ALL parts of Question 17.
17. The Singapore government provides subsidies to the healthcare sector and has implemented the Community Health Assist Scheme (CHAS) to make healthcare more affordable for lower- and middle-income households.
(a) Explain why healthcare may be considered a merit good. [3]
(b) Analyse how government subsidies can correct the market failure associated with merit goods. [4]
(c) Discuss one limitation of using subsidies to increase healthcare consumption in Singapore. [3]
Answer ALL parts of Question 18.
18. Singapore's hawker culture was inscribed on the UNESCO Representative List of the Intangible Cultural Heritage of Humanity in 2020. The government provides subsidised rent for hawker stalls and has introduced the Hawkers' Development Programme to support new entrants.
(a) Explain why the government might consider hawker culture to have characteristics of a public good or merit good. [3]
(b) Analyse the effects of government subsidies on the hawker market. [4]
(c) Discuss whether government intervention in the hawker market is justified from an economic perspective. [3]
Answer ALL parts of Question 19.
19. The Singapore government has implemented various policies to address income inequality, including the Workfare Income Supplement (WIS) scheme and the Progressive Wage Model (PWM).
(a) Explain how income inequality can be viewed as a form of market failure. [3]
(b) Analyse how the Workfare Income Supplement (WIS) scheme addresses income inequality. [4]
(c) Discuss one limitation of using government transfers to reduce income inequality in Singapore. [3]
Answer ALL parts of Question 20.
20. The Singapore government has introduced measures to address the market failure associated with information asymmetry in the financial services sector, including mandatory disclosure requirements and the Monetary Authority of Singapore's (MAS) regulatory framework.
(a) Explain what is meant by information asymmetry and how it leads to market failure. [3]
(b) Analyse how government regulation can correct the market failure caused by information asymmetry in financial services. [4]
(c) Discuss one limitation of using regulation to address information asymmetry in Singapore's financial sector. [3]
END OF PAPER
Answers
A-Level Economics H2 Quiz - Market Failure: Answer Key
Section A: Short Answer Questions
1. Define the term market failure. Give one example of a cause of market failure. [2]
Answer:
- Market failure occurs when the free market mechanism fails to allocate resources efficiently, resulting in a loss of allocative efficiency where marginal social benefit does not equal marginal social cost (MSB ≠ MSC). [1]
- Example: Externalities (e.g., pollution from factories), public goods, merit/demerit goods, market dominance, or asymmetric information. [1]
Teaching note: Students must define market failure in terms of allocative inefficiency — not simply "the market doesn't work." The example must be a cause, not a type of good. Accept any valid cause from the syllabus.
2. Distinguish between a positive externality and a negative externality, providing one example of each. [3]
Answer:
- A positive externality is a benefit enjoyed by third parties who are not directly involved in the production or consumption of a good, meaning marginal social benefit (MSB) exceeds marginal private benefit (MPB). [1] Example: Vaccination — when an individual gets vaccinated, others in the community also benefit from reduced disease transmission (herd immunity).
- A negative externality is a cost imposed on third parties who are not directly involved in the production or consumption of a good, meaning marginal social cost (MSC) exceeds marginal private cost (MPC). [1] Example: Air pollution from factory production — nearby residents suffer health costs from polluted air without being compensated.
- The key distinction is that positive externalities create external benefits (MSB > MPB) while negative externalities create external costs (MSC > MPC). [1]
Teaching note: Students must show the distinction clearly — not just give examples. Award the third mark for explicitly comparing the two concepts. Common mistake: confusing externalities with public goods.
3. Explain why public goods are typically underprovided by the free market. [2]
Answer:
- Public goods are characterised by non-rivalry (one person's consumption does not reduce availability to others) and non-excludability (it is impossible or impractical to prevent non-payers from consuming the good). [1]
- Because of non-excludability, individuals can consume the good without paying — the free-rider problem. Since firms cannot charge consumers, they have no profit incentive to supply the public good, leading to underprovision or zero provision by the free market. [1]
Teaching note: Students must link both characteristics to the free-rider problem and then to underprovision. Simply stating "the government provides public goods" without explaining why the market fails will not earn full marks.
4. State two characteristics of public goods and explain how each leads to the free-rider problem. [3]
Answer:
- Characteristic 1: Non-excludability — It is not possible to prevent people who have not paid for the good from consuming it. [1] This leads to the free-rider problem because individuals know they can benefit from the good without contributing to its cost, so they have no incentive to pay voluntarily.
- Characteristic 2: Non-rivalry — One person's consumption of the good does not diminish the amount available for others. [1] This reinforces the free-rider problem because even if some individuals pay, others can consume the same unit of the good at no additional cost, making it unprofitable for private firms to supply.
- Together, these characteristics mean private firms cannot generate revenue, so the market fails to provide the good at the socially optimal level. [1]
Teaching note: Award 1 mark for each correctly stated characteristic and 1 mark for the combined explanation. Students often confuse non-rivalry with non-excludability — ensure they can distinguish the two.
5. Explain the difference between a merit good and a demerit good, providing one example of each. [3]
Answer:
- A merit good is a good that is underconsumed in a free market because individuals underestimate or are unaware of its long-term private benefits, often due to information failure. [1] Example: Education — individuals may not fully appreciate the long-term benefits of education on earning potential and social mobility.
- A demerit good is a good that is overconsumed in a free market because individuals underestimate or are unaware of its long-term private costs, often due to information failure. [1] Example: Cigarettes — smokers may not fully account for the long-term health costs and addiction risks.
- The key distinction is that merit goods are underconsumed (MSB > MPB at the market equilibrium) while demerit goods are overconsumed (MSC > MPC at the market equilibrium) relative to the socially optimal level. [1]
Teaching note: Students must explain the distinction in terms of underconsumption vs. overconsumption and link both to information failure. Simply giving examples without explaining the difference will not earn full marks.
Section B: Data Response and Application
6. Using the extract, identify one example of a positive externality associated with EV adoption. Explain why this leads to underconsumption in a free market. [3]
Answer:
- Identification: Reduced air pollution from EVs generates external benefits — the extract states "each EV on the road generates an estimated S$8,200 in external benefits per year through reduced air pollution and lower healthcare costs." [1]
- Explanation: When a consumer decides whether to buy an EV, they consider only their private benefits (e.g., lower fuel costs, rebates) and private costs (e.g., purchase price). They do not take into account the external benefits to society (cleaner air, lower healthcare costs). [1]
- This means MPB < MSB. The market equilibrium occurs where MPC = MPB, which is at a lower quantity than the socially optimal level where MSC = MSB. Hence, EVs are underconsumed relative to the social optimum. [1]
Teaching note: Students must use evidence from the extract (S$8,200 figure) and explicitly explain the divergence between private and social benefits. Generic answers without reference to the extract will not earn full marks.
7. The LTA study estimates external benefits of S$8,200 per EV per year. Using a diagram, explain how this externality causes the market equilibrium quantity to be below the socially optimal quantity. [4]
Answer:
Diagram requirements:
- The diagram should show:
- D1 (MPB) — the private demand curve, lower than D2
- D2 (MSB) — the social demand curve, positioned above D1 by the amount of the external benefit (S$8,200)
- S (MSC = MPC) — the supply curve (assuming no externality on the production side)
- E1 — market equilibrium at intersection of D1 and S, giving quantity Qm
- E2 — socially optimal equilibrium at intersection of D2 and S, giving quantity Q*
- Welfare loss triangle — the area between Qm and Q*, bounded by D2 (above), D1 (below), and S (right side), representing the deadweight loss from underconsumption
Explanation:
- Because the positive externality means MSB > MPB, the social demand curve (D2) lies above the private demand curve (D1). [1]
- The free market ignores external benefits and produces at E1 where MPB = MPC, resulting in quantity Qm. [1]
- The socially optimal outcome is at E2 where MSB = MSC, resulting in the higher quantity Q*. [1]
- The welfare loss triangle between Qm and Q* represents the loss of social surplus due to underconsumption — society foregoes net benefits on those units between Qm and Q* where MSB > MSC. [1]
Teaching note: Award marks for: correct positioning of curves (1), identification of Qm and Q* (1), explanation of divergence (1), welfare loss identification (1). Common mistake: drawing the externality on the supply side instead of the demand side. For positive externalities of consumption, the shift is on the demand curve.
8. Explain how the Vehicular Emissions Scheme (VES) acts as a form of government intervention to correct the market failure identified in the extract. [3]
Answer:
- The VES provides rebates of up to S$25,000 for buyers of low-emission vehicles (EVs), effectively reducing the private cost of purchasing an EV. [1]
- This works like a subsidy — it increases the marginal private benefit (or reduces the effective price) of EV consumption, shifting the MPB curve closer to the MSB curve. [1]
- As a result, the market equilibrium quantity moves closer to the socially optimal quantity, reducing the underconsumption caused by the positive externality. The surcharge on high-emission vehicles similarly internalises the negative externality by increasing the private cost of ICE vehicles. [1]
Teaching note: Students must explain the mechanism — not just describe the policy. They should link the rebate to a shift in the MPB curve and explain how this reduces the gap between market and socially optimal outcomes.
9. The extract states that EV charging infrastructure is a challenge. Discuss whether EV charging points are a public good or a private good. Justify your answer. [3]
Answer:
- EV charging points are not pure public goods because they are rivalrous — if one EV is using a charging point, another EV cannot use it simultaneously. [1]
- EV charging points are also excludable — operators can restrict access to paying customers through payment systems and membership requirements. [1]
- However, EV charging infrastructure may have some characteristics of a quasi-public good or club good if access is partially restricted but the infrastructure generates positive externalities (e.g., encouraging EV adoption, reducing pollution). The government's involvement in deploying 60,000 charging points suggests it recognises the positive externalities and the need for intervention to overcome the free-rider problem in infrastructure provision. [1]
Teaching note: Students must clearly distinguish between public goods, private goods, and quasi-public goods. Award marks for identifying rivalry and excludability, and for discussing the quasi-public good nature. Students who simply state "it is a public good" without justification will not earn full marks.
10. Analyse one limitation of the VES rebate policy mentioned in the extract. [2]
Answer:
- The extract states that "the VES rebates disproportionately benefit higher-income households, who are more likely to purchase new EVs." [1]
- This means the policy may be regressive — it transfers resources to those who are already better off, while lower-income households who cannot afford new EVs (even with the rebate) do not benefit. This raises equity concerns and may limit the effectiveness of the policy in achieving broad-based EV adoption across all income groups. [1]
Teaching note: Students must identify a limitation from the extract and explain it using economic reasoning. Accept other valid limitations such as: the rebate may not fully bridge the price gap between EVs and ICE vehicles; the policy does not address charging infrastructure limitations; or the policy may create a deadweight loss if the rebate is set at the wrong level.
11. Suggest and explain one additional policy measure the Singapore government could use to increase EV adoption, other than the VES. [3]
Answer:
- Suggestion: The government could invest in expanding EV charging infrastructure, particularly in older housing estates where the extract notes infrastructure is limited. [1]
- Explanation: One of the key barriers to EV adoption identified in the extract is "limited charging infrastructure in older housing estates" and "consumer range anxiety." By directly investing in or subsidising the installation of charging points, the government reduces a significant non-price barrier to EV adoption. [1]
- This addresses the market failure by reducing the information and infrastructure gap that prevents consumers from switching to EVs. It also generates positive externalities — more charging points encourage more EV adoption, which in turn generates greater external benefits (S$8,200 per EV per year). [1]
Teaching note: Accept any valid policy measure (e.g., public awareness campaigns, R&D subsidies, direct government provision of charging infrastructure, tax incentives for manufacturers). Students must explain how the policy addresses a specific barrier mentioned in the extract and link it to correcting market failure.
12. Using the extract, explain why traffic congestion represents a form of market failure. [3]
Answer:
- Traffic congestion is a negative externality of consumption — when an individual chooses to drive during peak hours, they impose costs on other road users in the form of longer travel times, increased fuel consumption, and greater pollution. [1]
- The extract states that "traffic congestion in Singapore costs the economy approximately S$3.5 billion per year in lost productivity, wasted fuel, and environmental damage" — these are external costs not borne by the individual motorist. [1]
- Because motorists only consider their private costs (fuel, ERP charges, vehicle costs) and not the social costs (congestion imposed on others), the market equilibrium quantity of car trips exceeds the socially optimal quantity, resulting in overconsumption of road space. [1]
Teaching note: Students must identify congestion as a negative externality and explain the divergence between private and social costs. Reference to the extract (S$3.5 billion figure) is required for full marks.
13. Explain how the Electronic Road Pricing (ERP) system attempts to correct the market failure of traffic congestion. [3]
Answer:
- The ERP system charges motorists for using certain roads during peak hours, effectively increasing the private cost of driving during congested periods. [1]
- This works by internalising the externality — the charge makes motorists take into account the external costs they impose on other road users (longer travel times, pollution). The ERP charge acts as a Pigouvian tax on congestion. [1]
- As the private cost of driving increases, some motorists will switch to public transport, carpool, or travel at off-peak times, reducing the quantity of car trips towards the socially optimal level. The upgrade to ERP 2.0 with dynamic pricing allows charges to be adjusted in real-time based on actual congestion levels, making the intervention more precise. [1]
Teaching note: Students must explain the mechanism of internalisation — not just describe the ERP system. They should reference the Pigouvian tax concept and explain how the charge shifts behaviour.
14. Using a diagram, analyse how a subsidy on public transport can help reduce traffic congestion. [4]
Answer:
Diagram requirements:
- The diagram should show the market for private car transport:
- D1 (MPB) — the private demand curve for car trips, positioned above D2
- D2 (MSB) — the social demand curve, positioned below D1 by the amount of the external cost of congestion
- S (MSC = MPC) — the supply curve (assuming no externality on the production side)
- E1 — market equilibrium at intersection of D1 and S, giving quantity Qm (overconsumption)
- E2 — socially optimal equilibrium at intersection of D2 and S, giving quantity Q*
- Welfare loss triangle — the area between Q* and Qm, bounded by D1 (above), D2 (below), and S (right side)
Explanation:
- A subsidy on public transport reduces the price of public transport, making it more attractive relative to private car use. [1]
- This causes a leftward shift in the demand for private car trips (D1 shifts left towards D2), as some motorists substitute to public transport. [1]
- The new equilibrium quantity of car trips moves closer to Q*, reducing the overconsumption and the associated welfare loss. [1]
- The subsidy effectively reduces the gap between MPB and MSB by encouraging substitution away from the activity that generates the negative externality. [1]
Teaching note: Award marks for: correct diagram with D1 above D2 (1), identification of Qm and Q* (1), explanation of demand shift (1), link to reducing welfare loss (1). Common mistake: drawing the subsidy on the supply curve of public transport instead of showing the effect on demand for car trips. Either approach is acceptable if clearly explained.
15. Discuss one limitation of using subsidies on public transport as a policy to reduce traffic congestion in Singapore. [2]
Answer:
- Limitation: Subsidies on public transport may be costly for the government and may not be sufficient to change behaviour if the cultural status associated with car ownership is a stronger motivator than price. The extract notes that "car ownership remains high relative to population size, partly due to the cultural status associated with car ownership." [1]
- This suggests that non-price factors (convenience, status, habit) may limit the effectiveness of subsidies. Additionally, subsidies must be funded through taxation, which may create distortions elsewhere in the economy. If public transport is already affordable, further subsidies may have diminishing marginal impact on reducing car usage. [1]
Teaching note: Accept any valid limitation (e.g., fiscal cost, diminishing returns, non-price barriers, substitution effects). Students must explain the limitation using economic reasoning and, where possible, reference the extract.
Section C: Essay Questions
16. Carbon Tax [12 marks]
(a) Explain why carbon emissions represent a market failure. [3]
Answer:
- Carbon emissions are a negative externality of production — when firms produce goods using fossil fuels, they generate CO₂ emissions that contribute to climate change, imposing costs on society (e.g., rising sea levels, extreme weather, health impacts) that are not reflected in the market price. [1]
- The marginal social cost (MSC) of production exceeds the marginal private cost (MPC) because firms do not bear the full cost of the environmental damage they cause. [1]
- As a result, the free market overproduces carbon-intensive goods — the market equilibrium quantity (where MPC = MPB) exceeds the socially optimal quantity (where MSC = MSB), leading to a welfare loss. [1]
Teaching note: Students must clearly identify carbon emissions as a negative externality and explain the MSC > MPC divergence. Diagrams may be used but are not required in this part.
(b) Using a diagram, analyse how a carbon tax can correct the market failure associated with carbon emissions. [5]
Answer:
Diagram requirements:
- The diagram should show:
- MPC — the marginal private cost curve, lower than MSC
- MSC — the marginal social cost curve, positioned above MPC by the amount of the external cost (S$25 per unit)
- D (MPB = MSB) — the demand curve (assuming no externality on the consumption side)
- E1 — market equilibrium before tax at intersection of MPC and D, giving quantity Qm
- E2 — socially optimal / after-tax equilibrium at intersection of MSC and D, giving quantity Q*
- Tax per unit = S$25 shown as the vertical distance between MPC and MSC
- Welfare loss triangle — the area between Q* and Qm, bounded by MSC (above), MPC (below), and D (left side)
Explanation:
- A carbon tax of S$25 per tonne increases the private cost of production for carbon-intensive firms, effectively shifting the MPC curve upward towards the MSC curve. [1]
- If the tax is set equal to the marginal external cost (S$25), the new private cost (MPC + tax) equals MSC, and the market equilibrium shifts from E1 to E2. [1]
- The quantity produced falls from Qm to Q*, eliminating the overproduction and the associated welfare loss. The tax internalises the externality — firms now bear the full social cost of their production decisions. [1]
- The government also generates tax revenue equal to S$25 × Q*, which can be used to fund environmental initiatives or reduce other distortionary taxes. [1]
- In the long run, the carbon tax provides an incentive for firms to invest in cleaner technologies and renewable energy, further reducing emissions. [1]
Teaching note: Award marks for: correct diagram (2 — curves and labels, equilibrium points), explanation of tax mechanism (1), internalisation of externality (1), welfare loss elimination and revenue (1). Common mistake: drawing the tax as a shift in the demand curve instead of the supply/MPC curve.
(c) Discuss whether a carbon tax is the most effective policy for Singapore to reduce carbon emissions, compared to alternative policies such as tradable permits or regulation. [4]
Answer:
Arguments in favour of carbon tax:
- A carbon tax provides price certainty — firms know the cost of emitting carbon, which allows them to plan investments in clean technology. [1]
- It is economically efficient because it allows the market to determine how emissions are reduced — firms that can reduce emissions cheaply will do so, while those that cannot will pay the tax. This achieves the emissions reduction at the lowest total cost to society. [1]
Arguments against carbon tax / in favour of alternatives:
- A carbon tax does not guarantee a specific quantity of emissions reduction — if the tax is set too low, emissions may not fall sufficiently. Tradable permits (cap-and-trade) offer quantity certainty by setting a fixed cap on total emissions. [1]
- Regulation (e.g., emissions standards, bans on certain technologies) may be more effective in a small, highly regulated economy like Singapore where the government has strong enforcement capabilities. However, regulation is often less efficient than market-based instruments because it does not allow firms flexibility in how they reduce emissions. [1]
Evaluation:
- For Singapore, a carbon tax may be the most effective policy because it is relatively simple to administer, generates revenue, and provides clear price signals. However, the effectiveness depends on setting the tax at the correct level — the planned increase to S50–S80 by 2030 suggests the government recognises the initial rate may be too low. A combination of policies (carbon tax + regulation + tradable permits) may be more effective than any single policy alone. [1]
Teaching note: Award marks for: analysis of carbon tax advantages (1), analysis of alternative policies (1), comparison and evaluation (1), reasoned conclusion (1). Students must discuss at least one alternative policy and provide a balanced evaluation.
17. Healthcare as a Merit Good [12 marks]
(a) Explain why healthcare may be considered a merit good. [3]
Answer:
- Healthcare is considered a merit good because it is systematically underconsumed in a free market due to information failure and positive externalities. [1]
- Individuals may underestimate the long-term private benefits of preventive healthcare (e.g., regular check-ups, vaccinations) because the benefits are not immediately visible, leading to underconsumption. [1]
- Healthcare also generates positive externalities — when individuals receive treatment or vaccination, others benefit from reduced disease transmission (herd immunity) and a more productive workforce. Since MSB > MPB, the free market underprovides healthcare relative to the social optimum. [1]
Teaching note: Students must explain both information failure and positive externalities as reasons for underconsumption. Simply stating "healthcare is a merit good" without explanation will not earn full marks.
(b) Analyse how government subsidies can correct the market failure associated with merit goods. [4]
Answer:
- A government subsidy reduces the private cost of consuming healthcare, effectively shifting the supply curve to the right (or reducing the price faced by consumers). [1]
- This increases the quantity of healthcare consumed from the market equilibrium (Qm) towards the socially optimal quantity (Q*), reducing the underconsumption caused by the merit good characteristics. [1]
- The subsidy can be targeted at specific groups (e.g., lower-income households through CHAS) to address equity concerns and ensure that those who would otherwise not afford healthcare can access it. [1]
- By increasing healthcare consumption, the subsidy also helps realise the positive externalities (e.g., herd immunity, reduced disease burden), moving the market closer to the socially optimal outcome where MSB = MSC. [1]
Teaching note: Students should ideally include a diagram showing the subsidy shifting the supply curve and increasing quantity. Award marks for: explanation of subsidy mechanism (1), diagram or description of effect (1), link to socially optimal quantity (1), discussion of targeting/equity (1).
(c) Discuss one limitation of using subsidies to increase healthcare consumption in Singapore. [3]
Answer:
- Limitation: Subsidies create a fiscal burden on the government — as healthcare costs rise due to an ageing population and advancing medical technology, the cost of maintaining subsidies increases, potentially requiring higher taxes or reallocation of resources from other sectors. [1]
- Subsidies may also lead to moral hazard — when healthcare is subsidised, individuals may overconsume healthcare services (e.g., visiting the doctor for minor ailments) because they do not face the full cost, leading to inefficiency. [1]
- Additionally, subsidies may not address the root cause of underconsumption if information failure is the primary issue — individuals may still not seek preventive care even if it is subsidised, because they are unaware of its benefits. In such cases, public health education campaigns may be more effective. [1]
Teaching note: Accept any valid limitation (e.g., fiscal cost, moral hazard, deadweight loss, targeting issues). Students must explain the limitation using economic reasoning.
18. Hawker Culture [12 marks]
(a) Explain why the government might consider hawker culture to have characteristics of a public good or merit good. [3]
Answer:
- Hawker culture has characteristics of a merit good because individuals may undervalue its cultural and social significance — the benefits of preserving hawker culture (social cohesion, cultural identity, community bonding) are not fully appreciated by consumers, leading to underconsumption. [1]
- Hawker centres also have characteristics of a quasi-public good — they are non-excludable (anyone can enter and enjoy the atmosphere) and partially non-rivalrous (up to a point, one person's enjoyment does not diminish another's, though congestion can occur). [1]
- The UNESCO inscription recognises the positive externalities of hawker culture — it generates benefits for society beyond those captured by individual consumers, including tourism revenue, cultural preservation, and social equity (affordable food for all income groups). [1]
Teaching note: Students must explain both the merit good and quasi-public good characteristics. Reference to the UNESCO inscription and positive externalities is expected.
(b) Analyse the effects of government subsidies on the hawker market. [4]
Answer:
- Government subsidies (e.g., subsidised rent for hawker stalls) reduce the costs of production for hawkers, shifting the supply curve to the right. [1]
- This leads to a lower equilibrium price for hawker food and a higher equilibrium quantity, making hawker food more affordable and accessible to consumers. [1]
- The subsidy helps preserve hawker culture by making it financially viable for hawkers to continue operating, despite rising costs (e.g., ingredients, labour). Without subsidies, some hawkers might exit the market, leading to a loss of cultural heritage. [1]
- However, the subsidy may also lead to inefficiency — if hawkers receive subsidised rent regardless of performance, there may be less incentive to innovate or maintain quality. Additionally, the subsidy represents an opportunity cost — the government could have used these funds elsewhere. [1]
Teaching note: Students should ideally include a diagram showing the subsidy shifting the supply curve. Award marks for: explanation of subsidy mechanism (1), effect on price and quantity (1), link to cultural preservation (1), discussion of potential inefficiency (1).
(c) Discuss whether government intervention in the hawker market is justified from an economic perspective. [3]
Answer:
- Justified: Government intervention is justified because hawker culture generates positive externalities (cultural preservation, social cohesion, tourism) that are not fully captured by the market. Without intervention, the free market would underprovide hawker culture, leading to a loss of social welfare. [1]
- Not justified: However, critics may argue that government intervention distorts the market — subsidies may keep inefficient hawkers in business, preventing natural market adjustment. Consumers may also have diverse preferences, and government support for hawker culture may come at the expense of other cultural or economic priorities. [1]
- Evaluation: On balance, government intervention is likely justified given the significant positive externalities and the non-market value of cultural preservation. However, the intervention should be carefully designed to minimise inefficiency — for example, linking subsidies to quality standards or providing support for innovation rather than simply subsidising rent. [1]
Teaching note: Students must present both sides of the argument and provide a reasoned evaluation. Award marks for: justification (1), counter-argument (1), evaluation (1).
19. Income Inequality [12 marks]
(a) Explain how income inequality can be viewed as a form of market failure. [3]
Answer:
- Income inequality can be viewed as a form of market failure because the free market may distribute income in a way that does not reflect societal values of fairness or equity. [1]
- The market may fail to provide equal opportunities — individuals born into disadvantaged circumstances may lack access to quality education, healthcare, and social networks, leading to persistent income disparities that are not due to differences in effort or ability. [1]
- High income inequality can also generate negative externalities — it is associated with higher crime rates, lower social cohesion, reduced social mobility, and poorer health outcomes for the population as a whole. These costs are not borne by the wealthy but by society at large, representing a divergence between private and social costs/benefits. [1]
Teaching note: Students must explain income inequality as a market failure in terms of equity, unequal opportunities, and negative externalities. Simply stating "inequality is unfair" without economic reasoning will not earn full marks.
(b) Analyse how the Workfare Income Supplement (WIS) scheme addresses income inequality. [4]
Answer:
- The WIS scheme provides cash payouts and CPF contributions to low-wage workers, effectively increasing their take-home income and retirement savings. [1]
- By targeting low-wage workers, the WIS scheme directly addresses income inequality by raising the income of the lowest earners, reducing the gap between high and low earners. [1]
- The scheme also provides an incentive to work — unlike unconditional welfare payments, WIS is tied to employment, encouraging labour force participation and reducing the risk of welfare dependency. [1]
- The WIS scheme can be seen as addressing the market failure of unequal opportunities — by supplementing the income of low-wage workers, it helps ensure that all workers receive a living wage, regardless of the market wage determined by supply and demand. [1]
Teaching note: Students must explain the mechanism of WIS and link it to reducing income inequality. Award marks for: explanation of WIS (1), targeting of low-wage workers (1), work incentive (1), link to market failure (1).
(c) Discuss one limitation of using government transfers to reduce income inequality in Singapore. [3]
Answer:
- Limitation: Government transfers such as WIS may create disincentives to work or upskill — if the transfer is set at a high level relative to market wages, some workers may choose to remain in low-wage jobs rather than seeking higher-paying employment or investing in skills development. This is known as the poverty trap or welfare dependency. [1]
- Additionally, government transfers are funded through taxation, which may create distortions in the economy — high taxes on higher earners may reduce incentives to work, save, and invest, potentially reducing economic growth and the overall tax base. [1]
- Transfers also do not address the root causes of income inequality (e.g., unequal access to education, discrimination, structural changes in the economy). A more sustainable approach may involve investing in education and skills training to improve the earning potential of low-income workers in the long run. [1]
Teaching note: Accept any valid limitation (e.g., fiscal cost, work disincentives, targeting issues, opportunity cost). Students must explain the limitation using economic reasoning.
20. Information Asymmetry [12 marks]
(a) Explain what is meant by information asymmetry and how it leads to market failure. [3]
Answer:
- Information asymmetry occurs when one party in a transaction (e.g., the seller) has more or better information than the other party (e.g., the buyer), leading to an imbalance of power in the transaction. [1]
- This leads to market failure because it results in adverse selection (e.g., in insurance markets, those most likely to make claims are the most likely to buy insurance) and moral hazard (e.g., insured individuals may take greater risks because they are protected from the consequences). [1]
- Because consumers cannot make fully informed decisions, the market fails to allocate resources efficiently — too much or too little of a good may be consumed, and prices may not reflect the true quality or risk, leading to a loss of allocative efficiency. [1]
Teaching note: Students must define information asymmetry and explain at least one consequence (adverse selection or moral hazard). Examples from financial services are expected.
(b) Analyse how government regulation can correct the market failure caused by information asymmetry in financial services. [4]
Answer:
- Government regulation can require mandatory disclosure of information by financial institutions — for example, requiring banks and insurance companies to clearly disclose the terms, risks, and fees associated with their products. This reduces the information gap between sellers and buyers. [1]
- The Monetary Authority of Singapore (MAS) enforces prudential regulations (e.g., capital adequacy requirements, risk management standards) to ensure that financial institutions remain solvent and do not take excessive risks that could harm consumers. [1]
- Regulation can also establish consumer protection frameworks — for example, cooling-off periods for financial products, dispute resolution mechanisms, and restrictions on misleading advertising. These measures help ensure that consumers are not exploited due to their lack of information. [1]
- By reducing information asymmetry, regulation helps restore consumer confidence in financial markets, encouraging participation and improving the efficiency of capital allocation. This is particularly important in Singapore as a major financial hub where consumer trust is essential. [1]
Teaching note: Students must explain specific regulatory measures and link them to reducing information asymmetry. Award marks for: disclosure requirements (1), prudential regulation (1), consumer protection (1), link to market efficiency (1).
(c) Discuss one limitation of using regulation to address information asymmetry in Singapore's financial sector. [3]
Answer:
- Limitation: Regulation can be costly to implement and enforce — compliance costs for financial institutions (e.g., hiring compliance officers, implementing reporting systems) may be passed on to consumers in the form of higher fees or reduced product offerings. [1]
- Regulation may also lead to regulatory capture — over time, regulated firms may influence the regulatory process to serve their own interests rather than those of consumers, reducing the effectiveness of the regulation. [1]
- Additionally, regulation may not be able to keep pace with financial innovation — new products and technologies (e.g., fintech, cryptocurrency) may create new forms of information asymmetry that existing regulations do not address, requiring constant updating of the regulatory framework. [1]
Teaching note: Accept any valid limitation (e.g., compliance costs, regulatory capture, unintended consequences, innovation challenges). Students must explain the limitation using economic reasoning.
END OF ANSWER KEY
Free quiz and exam paper access
Enter your details to view this paper
Your access is remembered on this device.