From Real Exams Quiz
A Level H2 Economics Macroeconomics Quiz
Free A Level H2 Econs Macroeconomics quiz, HY3 Exam version, with questions, answers, and A Level-style practice for Singapore students.
These static practice materials are generated from the site's syllabus and paper-generation workflow, with source and model context shown so students and parents can evaluate the material before use.
Questions
Free quiz and exam paper access
Enter your details to view this paper
Your access is remembered on this device.
Answers
A-Level Economics H2 Quiz - Macroeconomics (Answer Key)
Total Marks: 40
Topic: Macroeconomics
Section A: Short Structured Questions (1–8)
Q1 [2 marks]
Accept any two from: economic growth, low unemployment, low and stable inflation, balanced balance of payments, equitable income distribution.
Teaching note: Macro objectives are the goals governments target. Each correct objective = 1 mark.
Q2 [2 marks]
Nominal GDP measures output at current prices; real GDP measures output at constant prices to remove inflation effect.
Teaching note: 1 mark for nominal definition, 1 mark for real definition. Real GDP is inflation-adjusted.
Q3 [2 marks]
Leakage: saving (or taxes, imports) withdraws from circular flow. Injection: investment (or government spending, exports) adds to flow.
Teaching note: 1 mark each. Leakages reduce demand, injections raise demand.
Q4 [2 marks]
Fiscal policy is use of government spending and taxation to influence economy. Example: increase in infrastructure spending.
Teaching note: Definition 1 mark, example 1 mark.
Q5 [3 marks]
- Government spending (G) is a component of AD = C + I + G + (X−M).
- Increase in G raises AD at each price level.
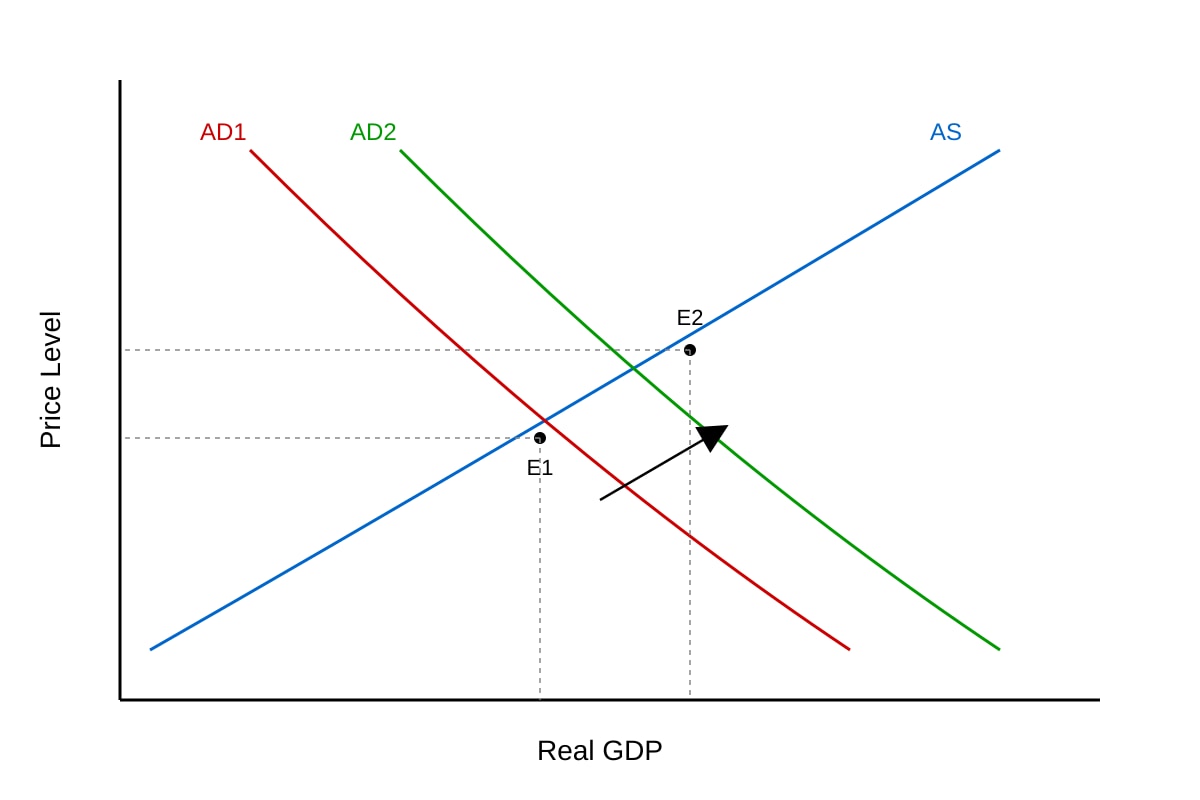
- AD curve shifts right from AD1 to AD2, raising real GDP and price level.
Marking: 1 mark for component link, 2 marks for shift explanation.
Q6 [3 marks]
Diagram: AD shifts right (AD1→AD2) after lower interest rates stimulate consumption/investment.
Explanation: Lower rates reduce cost of borrowing → higher C and I → AD rises → real GDP increases from Y1 to Y2.
Marking: Diagram 1 mark, explanation 2 marks.
Q7 [3 marks]
Multiplier = 1 / (1 − MPC) = 1 / (1 − 0.8) = 1 / 0.2 = 5.
Working: Substitute MPC = 0.8.
Marking: Formula 1 mark, substitution 1 mark, answer 1 mark.
Q8 [3 marks]
Rise in net exports (X−M) increases AD (component). On balance of payments, current account deficit narrows or surplus grows.
Marking: AD effect 2 marks, BoP effect 1 mark.
Section B: Data and Diagram Interpretation (9–14)
Q9 [2 marks]
Real GDP rose from S530b (2023), an upward trend of S$30b.
Marking: Statement of rise 1 mark, quantification 1 mark.
Q10 [2 marks]
Unemployment fell from 4.0% to 3.0% (↓1pp); inflation rose from 1.5% to 2.5% (↑1pp). Opposite directions.
Marking: Each trend 1 mark.
Q11 [3 marks]
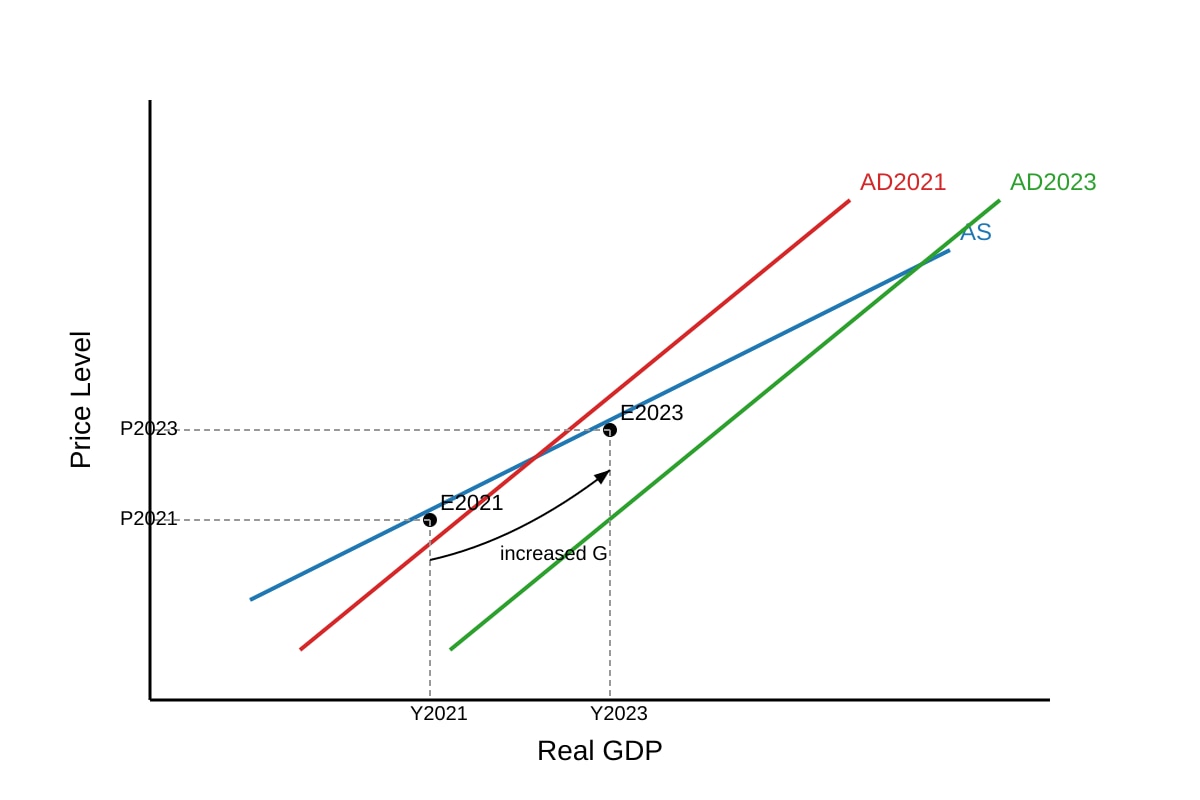
Diagram: AD2021→AD2023 rightward shift due to higher G. Real GDP rises.
Explanation: G increase is injection → AD shifts right → Y increases.
Marking: Diagram 1, explanation 2.
Q12 [3 marks]
% change = (530 − 500) / 500 × 100 = 30 / 500 × 100 = 6%.
Working shown.
Marking: Formula 1, calc 1, answer 1.
Q13 [3 marks]
Possible: rise in consumer confidence → higher C → AD rises → firms hire more → unemployment falls.
Marking: Reason 1, mechanism 2.
Q14 [3 marks]
By 2023 unemployment 3.0% (low), inflation 2.5% (moderate, not "low"). Not full employment (no exact 0% definition but 3% acceptable as low). Achieved low unemployment, not low inflation by strict <2% view.
Marking: Inflation eval 1, unemployment eval 1, judgment 1.
Section C: Extended Response and Evaluation (15–20)
Q15 [3 marks]
Supply-side policies (e.g., training subsidies) improve labour productivity → LRAS shifts right → higher potential output.
Marking: Policy example 1, mechanism 1, capacity effect 1.
Q16 [3 marks]
Adv: direct control of money supply/rates can cool demand quickly. Disadv: may raise unemployment, slow growth.
Marking: Each 1.5 marks.
Q17 [4 marks]
For: fiscal (G↑) directly raises AD → jobs. Against: monetary (rate↓) also raises I/C but may be liquidity-trapped. Diagram AD shift. Eval: depends on context.
Marking: AD link 2, eval 2.
Q18 [4 marks]
Growth gives jobs/income but may cause inflation. Stability aids planning but may slow growth. Eval: stage of economy matters.
Marking: Each side 1.5, judgment 1.
Q19 [4 marks]
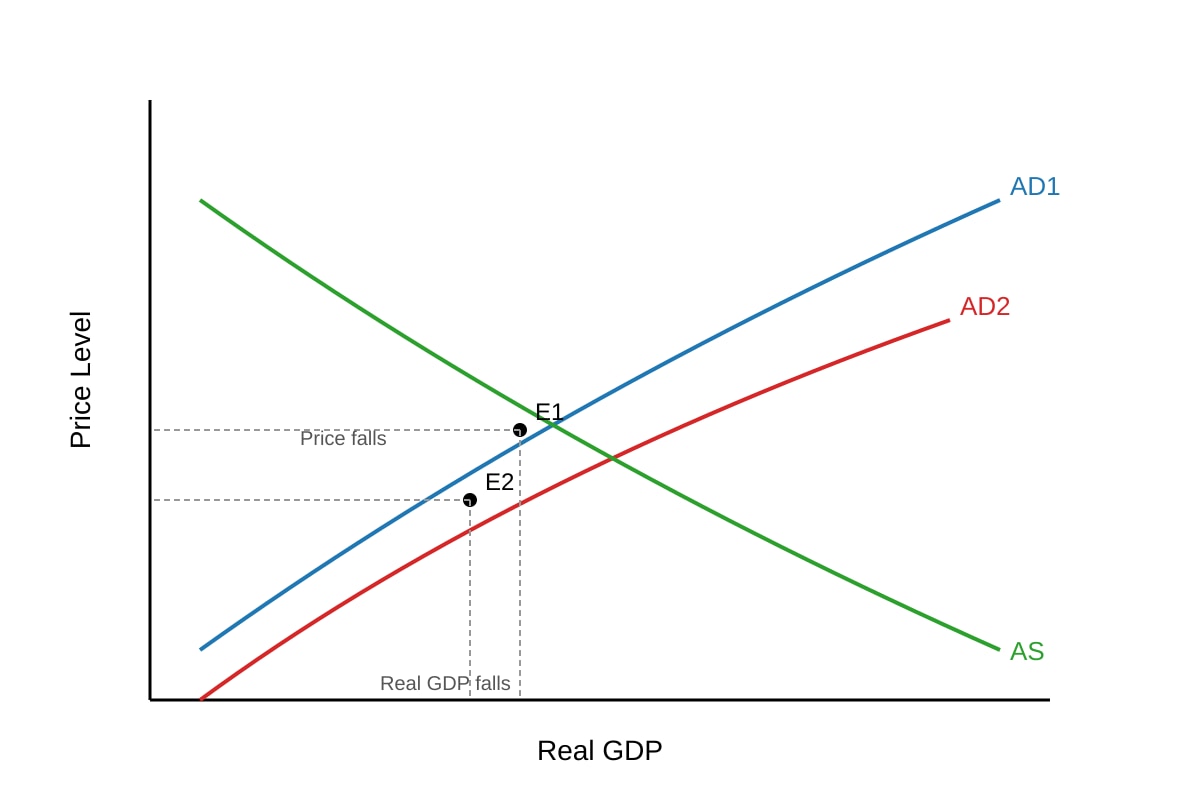
Diagram: AD left shift. Appreciation makes exports dearer, imports cheaper → net exports fall → AD left → Y falls.
Marking: Diagram 2, explanation 2.
Q20 [4 marks]
Data: G rose, GDP rose. But inflation also rose. Continuing may overheat. Eval: if spare capacity exists, ok; else risk inflation.
Marking: Data use 2, eval 2.