From Real Exams Quiz
A Level H2 Economics International Economics Quiz
Free A Level H2 Econs International Economics quiz, HY3 Exam version, with questions, answers, and A Level-style practice for Singapore students.
These static practice materials are generated from the site's syllabus and paper-generation workflow, with source and model context shown so students and parents can evaluate the material before use.
Questions
Free quiz and exam paper access
Enter your details to view this paper
Your access is remembered on this device.
Answers
A-Level Economics H2 Quiz - International Economics (Answer Key)
Total Marks: 40
Topic: International Economics
Section A: Fundamentals (Q1–5, 1 mark each)
Q1. B – Comparative advantage
Teaching note: Comparative advantage (Ricardo) says specialise where opportunity cost is lowest, not where absolute output is highest. Absolute advantage (A) is about productivity, not opportunity cost.
Q2. B – A tax on imported goods
Teaching note: Tariff = customs duty on imports. Quota (A) is quantity limit; subsidy (C) is payment; VER (D) is voluntary restraint.
Q3. B – Trade in goods and services plus income flows
Teaching note: Current account = goods, services, primary income, secondary income. Financial account (A, C, D) records capital flows.
Q4. B – More expensive in US dollar terms
Teaching note: SGD appreciation means 1 SGD buys more USD; US buyers need more USD for same SGD price → S’pore exports pricier for them.
Q5. B – Free movement of goods among members
Teaching note: Trading blocs (e.g. ASEAN) reduce internal barriers; external tariffs may vary (not necessarily higher for all, A).
Section B: Data and Diagrams (Q6–10)
Q6. (3 marks)
- Draw final EV market: D_EV shifts right → higher P and Q of EVs. (1)
- Lithium is derived demand: higher EV output raises demand for lithium → D_li shifts right. (1)
- World lithium market: P_lithium and Q_lithium rise. Label axes (P, Q), curves, new equilibrium. (1)
Teaching note: Must show input market, not just EV market.
Q7. (2 marks)
Terms of Trade (ToT) = (Export Price Index / Import Price Index) × 100
= (130 / 110) × 100 = 118.2 (or 118)
Working: 130 ÷ 110 = 1.1818 → ×100 = 118.2.
Teaching note: ToT > 100 means improving terms; country buys more imports per unit export.
Q8. (2 marks)
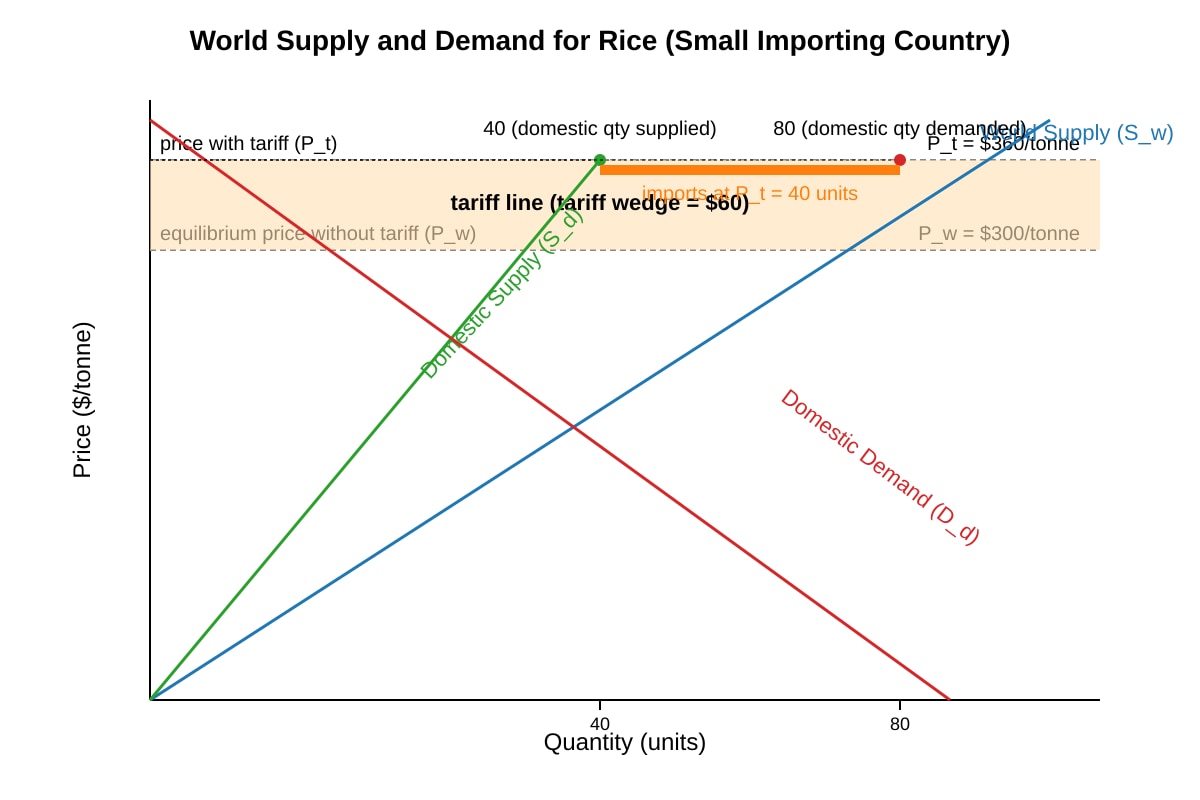
- Without tariff, imports = D_d – S_d at P_w = (say 100 – 20) = 80 units (from context).
- With tariff P_t = $360, domestic supply = 40, demand = 80, imports = 40 units. (1)
- Tariff reduces imports from 80 to 40 units (by 40 units). (1)
Teaching note: Use diagram values: P_w=360, Q_s=40, Q_d=80 → imports 40.
Q9. (2 marks)
One reason: Quota gives certainty on quantity (e.g. protect domestic jobs to a fixed limit) whereas tariff may still allow volume to rise if demand grows. (2) Or: quota avoids tariff revenue going to government, instead rents may go to licence holders.
Teaching note: Need a distinct reason from tariff; not “because it’s a limit”.
Q10. (2 marks)
- Nation A openness increased from 120% to 145% (rising integration). (1)
- Nation B decreased from 90% to 78% (declining trade reliance). (1)
Teaching note: Compare both directions, not just one.
Section C: Structured and Evaluation (Q11–20)
Q11. (4 marks)
Define comparative advantage: lower opp cost. (1)
Example: S’pore & Malaysia; S’pore better at electronics, Malaysia at palm oil; opp cost of electronics lower in S’pore. (1)
Specialisation → each produces more of comparative-advantage good. (1)
Trade → combined output exceeds self-sufficiency (gain from trade). (1)
Teaching note: Must show opportunity cost logic, not just “they are good at it”.
Q12. (4 marks)
Diagram: D_d, S_d, world price P_w; subsidy shifts S_d down to S_d+sub → higher domestic Q, lower price to consumers. (2)
Govt expenditure = subsidy per unit × new Q_s. (1)
Expands domestic output, may reduce imports. (1)
Teaching note: Label subsidy wedge, new equilibrium.
Q13. (5 marks)
For: infant industries need protection to achieve scale/efficiency (2); externalities of learning. (1)
Against: risk of permanence, rent-seeking, consumer cost. (1)
Judgement: justified temporarily with exit plan. (1)
Marking: 2+2+1 structure.
Q14. (4 marks)
Appreciation → exports dearer, imports cheaper. (1)
Diagram: exchange rate ↑, net exports (NX) fall on AD/CA schedule. (1)
Elastic import demand → volume of imports rises substantially, expenditure rises. (1)
Current account worsens (deficit widens). (1)
Q15. (4 marks)
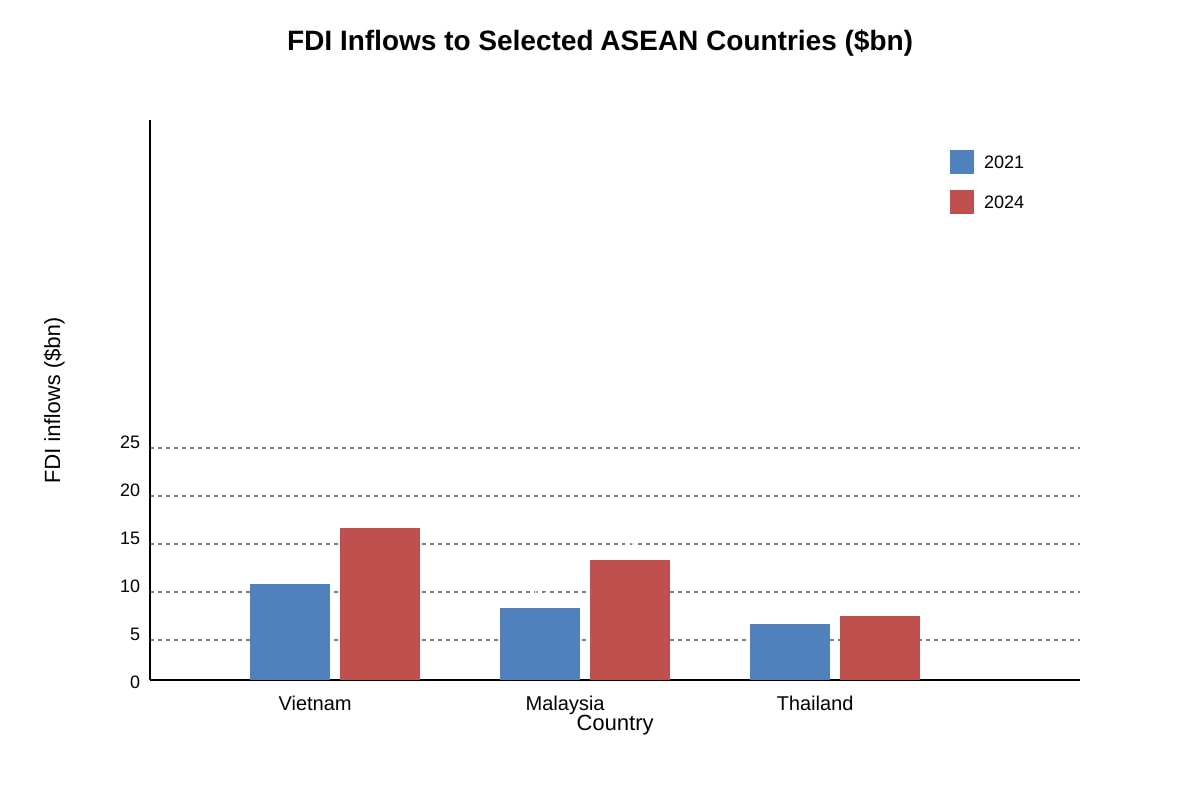
From chart: Vietnam & Malaysia rose, Thailand flat. (1)
Factor 1: Vietnam lower labour costs / supply chain shift from China. (1)
Factor 2: Malaysia existing semiconductor base; Thailand political/slowdown. (1)
Conclude differing locational advantages. (1)
Q16. (6 marks)
Yes gains: tech transfer, cheaper goods, scale. (2)
No / risks: inequality, fragile external dependence, cultural loss. (2)
Eval: net depends on policies, absorptive capacity. (2)
Descriptors: 2 for points each side, 2 for balanced judgement.
Q17. (5 marks)
Diagram: D, S, S_w; tariff raises price P_w→P_t. (1)
CS falls by a+b+c+d. (1)
PS rises by a. (1)
Govt revenue c; DWL = b+d. (2)
Teaching note: label areas.
Q18. (3 marks)
Technical standards as NTB raise compliance cost for Partner D. (1)
Extract: 12% rejected → effective barrier. (1)
Reduces trade despite agreement; like invisible tariff. (1)
Q19. (5 marks)
Not necessarily: deficit may fund investment (2); mirror of capital inflow (1).
But if unsustainable → currency pressure (1).
Judgement: context-dependent (1).
Q20. (6 marks)
Trade creation: bloc members buy cheaper internally → efficiency. (2)
Trade diversion: shift from efficient external to less efficient member → loss. (2)
Eval: net depends on pre-bloc tariffs & complementarity. (2)