From Real Exams Quiz
A Level H2 Economics Data Response Quiz
Free A Level H2 Econs Data Response quiz, HY3 Exam version, with questions, answers, and A Level-style practice for Singapore students.
These static practice materials are generated from the site's syllabus and paper-generation workflow, with source and model context shown so students and parents can evaluate the material before use.
Questions
A-Level Economics H2 Quiz - Data Response
Name:
Class:
Date:
Score:
Duration: 60 minutes
Total Marks: 40
Topic: Data Response
Instructions:
- This quiz contains 20 questions based on data response skills.
- Answer all questions in the spaces provided.
- Use diagrams where requested and label them clearly.
- Marks for each question are shown in brackets.
Section A: Extract and Table Interpretation (Questions 1–5)
Extract 1:
The Southeast Asian semiconductor industry saw mixed output in 2023. Vietnam recorded a 12% rise in chip exports, while Malaysia reported a 4% decline. Government subsidies in Vietnam supported new fabrication plants, whereas in Malaysia, labour shortages constrained production.
Table 1: Electric Vehicle (EV) Battery Material Prices (USD per kg), 2021–2023
| Material | 2021 | 2022 | 2023 |
|---|---|---|---|
| Lithium | 15 | 38 | 22 |
| Cobalt | 30 | 35 | 28 |
| Nickel | 12 | 20 | 18 |
- With reference to Extract 1, identify one country that increased chip exports and one that declined. [2]
- Using Table 1, calculate the percentage change in lithium price from 2021 to 2023. Show your working. [2]
- With reference to Table 1, describe the trend in cobalt prices from 2021 to 2023. [1]
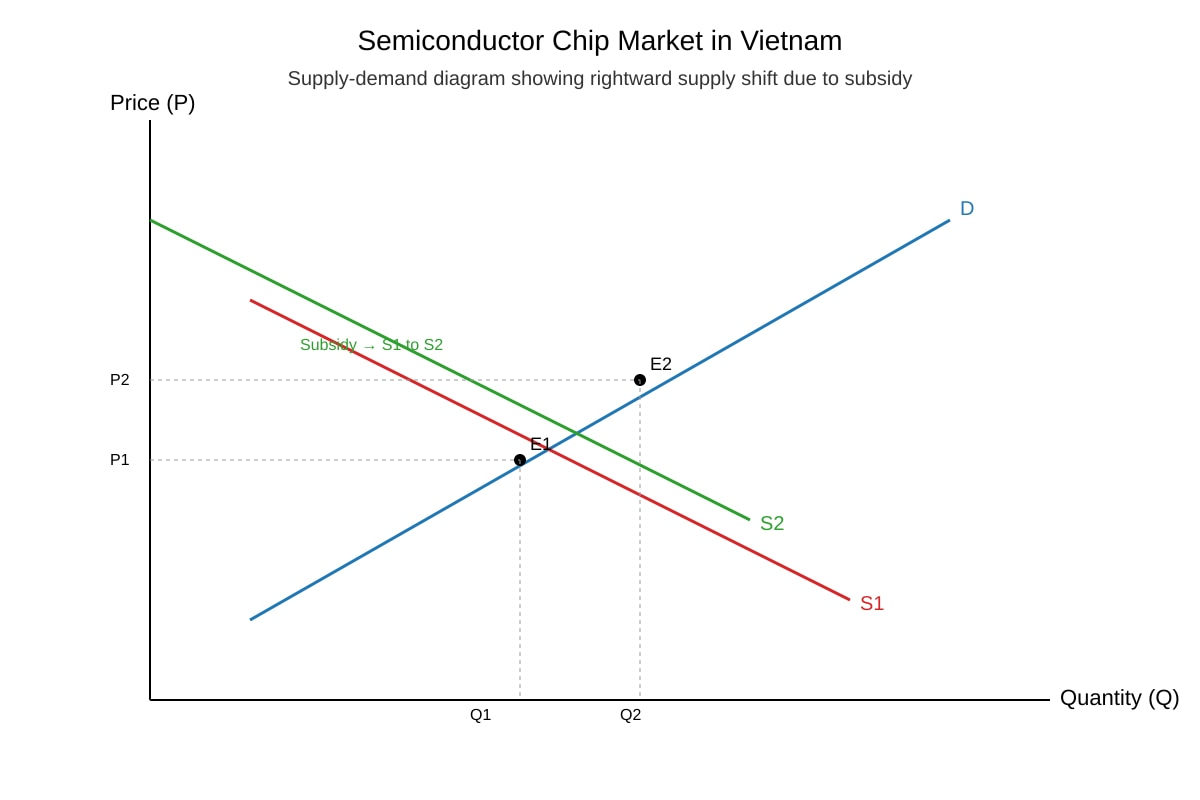
- Explain one possible reason why Vietnam's subsidies led to higher chip exports using a demand-supply diagram of the chip market. [3]
Image pending generation: diagram for Q4.
- With reference to Extract 1 and Table 1, suggest one way in which higher battery material prices could affect EV producers. [2]
Section B: Diagram and Data-Based Analysis (Questions 6–10)
Extract 2:
In 2024, a drought in Brazil reduced coffee bean harvests. Global coffee prices rose by 18%. Simultaneously, a new coffee substitute made from barley gained popularity in Europe.
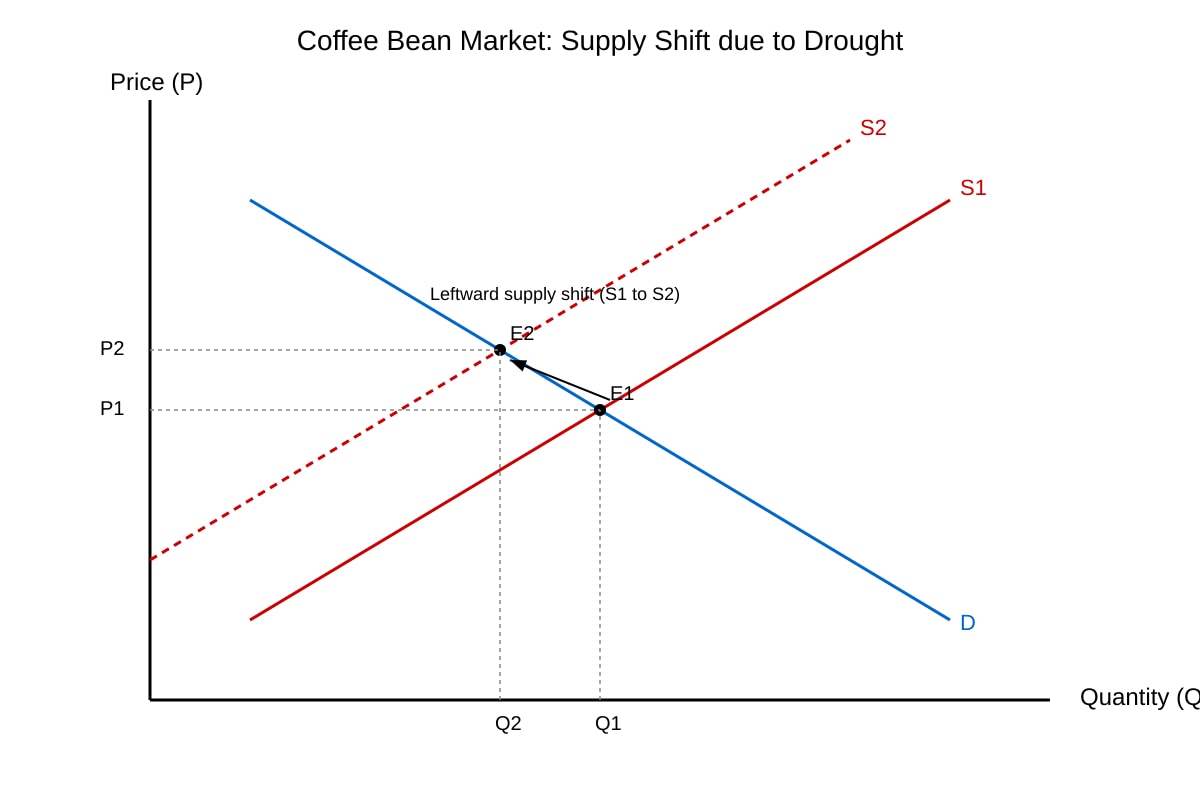
- With the aid of a diagram, explain how the drought in Brazil affects the market for coffee beans. [3]
Image pending generation: diagram for Q6.
- Using Extract 2, explain what is meant by a "substitute" in economics. [2]
- With reference to Extract 2, explain how the popularity of barley coffee substitute may affect demand for coffee beans. [2]
- Table 2 shows rice output (million tonnes). Compute the average annual growth rate of Country X from 2021 to 2023. [2]
| Year | 2021 | 2022 | 2023 |
|---|---|---|---|
| X | 100 | 105 | 110 |
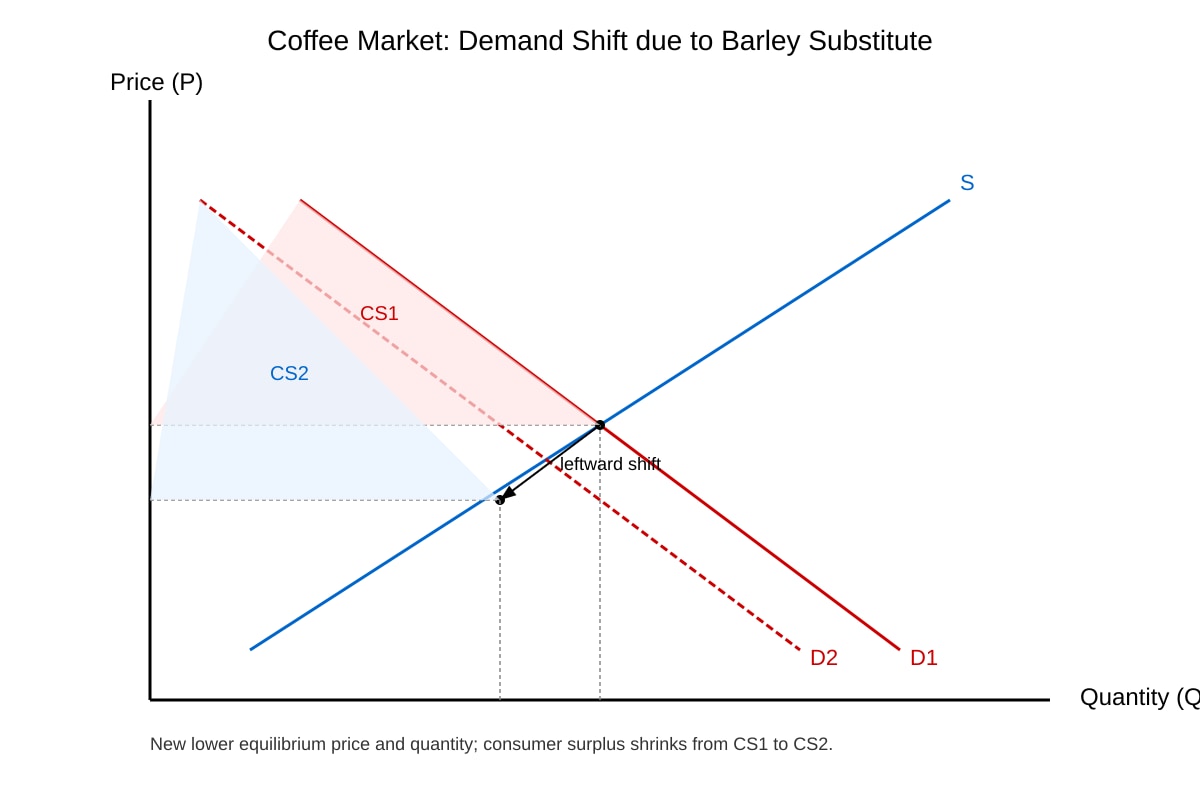
- Using a diagram, explain how a successful barley substitute reduces consumer surplus in the coffee market. [3]
Image pending generation: diagram for Q10.
Section C: Source-Based Evaluation (Questions 11–15)
Extract 3:
The government of Country A imposed a tariff of 20% on imported solar panels to protect local manufacturers. Local output rose by 15%, but consumer prices increased by 10%. Retaliatory tariffs from neighbouring countries reduced Country A's exports of electronics by 8%.
- With reference to Extract 3, identify the two effects of the tariff on the local economy. [2]
- Using Extract 3, calculate the new consumer price index effect if the base price was $200 before tariff. [2]
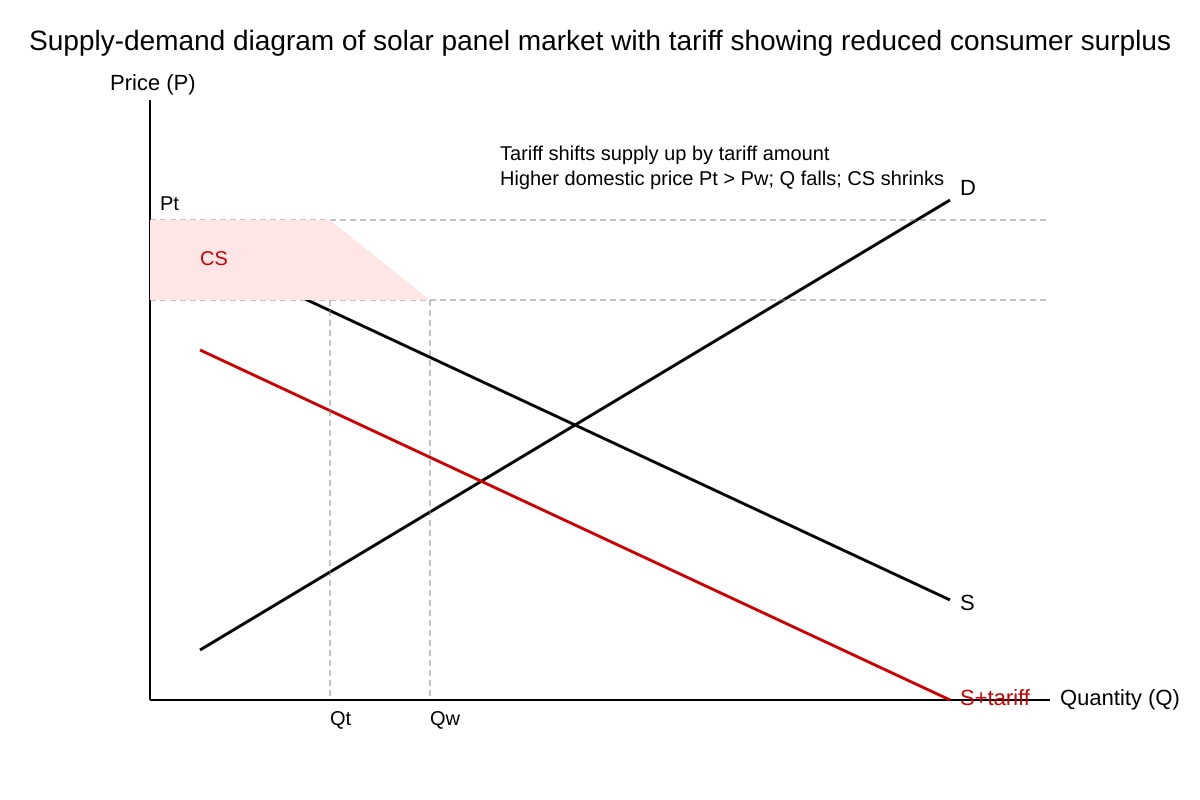
- With the aid of a diagram, explain how the tariff affects consumer surplus in Country A's solar panel market. [3]
Image pending generation: diagram for Q13.
- Explain one possible unintended consequence of the retaliatory tariffs mentioned in Extract 3. [2]
- Evaluate whether the tariff was beneficial for Country A's social welfare. Use evidence from Extract 3. [6]
Section D: Synthesis and Higher-Order Data Response (Questions 16–20)
Extract 4:
Country B introduced a carbon tax of $50 per tonne in 2022. Emissions fell by 9% by 2023. However, energy-intensive firms relocated to countries without carbon pricing, causing a 3% drop in manufacturing jobs. Renewable energy investment rose by 25%.
- With reference to Extract 4, identify two economic effects of the carbon tax. [2]
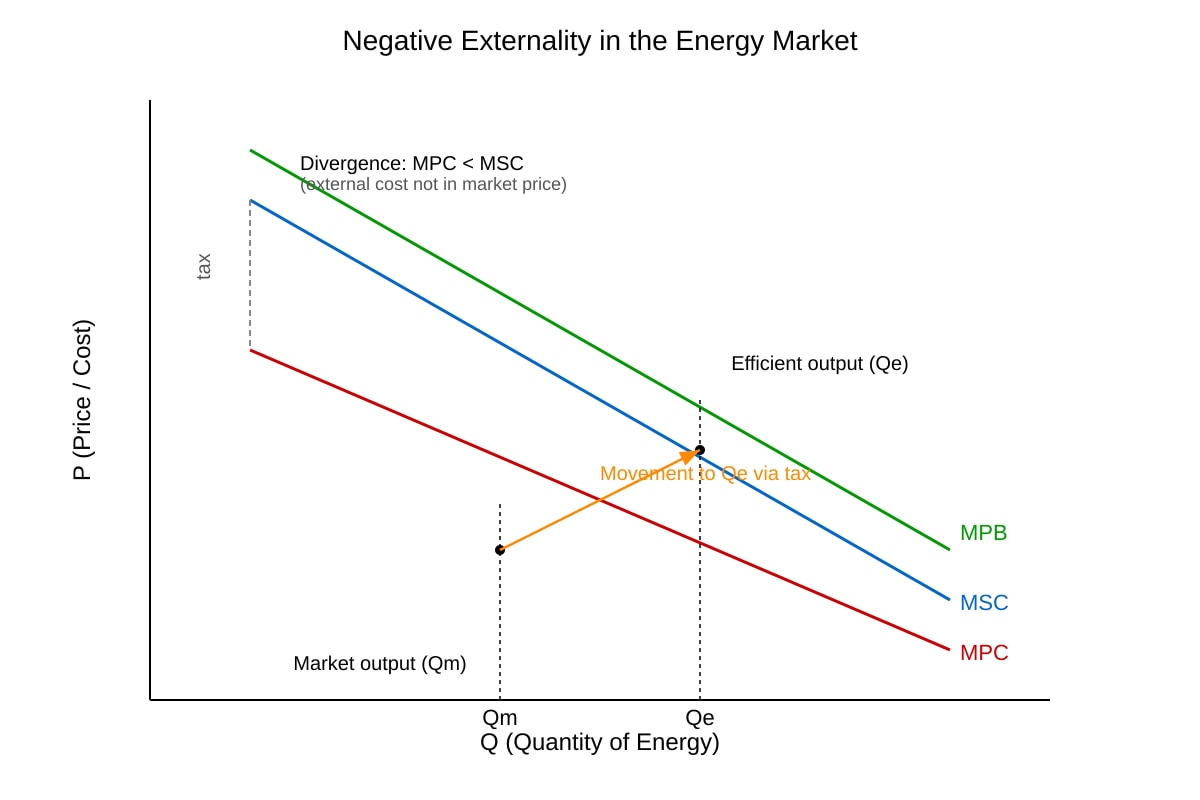
- Using a diagram, explain how a carbon tax corrects a negative externality in the energy market. [3]
Image pending generation: diagram for Q17.
- With reference to Extract 4, explain the concept of "capital flight" as shown by firm relocation. [2]
- Calculate the net percentage change in manufacturing jobs if the 3% drop is the only employment effect. [1]
- Discuss whether a carbon tax is a better policy than a subsidy for reducing emissions, using evidence from Extract 4. [8]
Answers
A-Level Economics H2 Quiz - Data Response (Answer Key)
Total Marks: 40
Topic: Data Response
Section A: Extract and Table Interpretation (Q1–5)
Q1. [2 marks]
- Vietnam increased chip exports (by 12%). [1]
- Malaysia declined (by 4%). [1]
Teaching note: Extract 1 explicitly states Vietnam's rise and Malaysia's fall. Students should quote figures for precision.
Q2. [2 marks]
Working:
Lithium 2021 = 15,2023=22.
Percentage change = ((22 − 15) / 15) × 100 = (7 / 15) × 100 ≈ 46.67%. [2 for correct working and answer]
Common mistake: Using wrong base year or omitting ×100.
Q3. [1 mark]
Cobalt prices rose from 30(2021)to35 (2022) then fell to $28 (2023); net decline over period. [1]
Marking: Award for stating rise then fall or net decrease.
Q4. [3 marks]
- Diagram: Subsidy shifts supply right from S1 to S2. [1]
- Lower price, higher Q. [1]
- Explanation: Subsidy lowers cost of production, increases supply, raises exports. [1]
Teaching note: Subsidy = negative cost → supply increases. Link to Extract 1's fabrication plants.
Q5. [2 marks]
Higher material prices raise EV production costs (cost-push), reduce profit margins, or force price increases. [2] Any one valid suggestion with reference to Table 1.
Section B: Diagram and Data-Based Analysis (Q6–10)
Q6. [3 marks]
- Diagram: Leftward supply shift (S1→S2). [1]
- Price rises, quantity falls. [1]
- Drought reduces supply → scarcity → higher P. [1]
Teaching note: Supply shock from weather is a non-price determinant (shift).
Q7. [2 marks]
A substitute is a good that can replace another; if price of coffee rises, demand for barley coffee rises. [2] Definition + context from Extract 2.
Q8. [2 marks]
Barley substitute reduces demand for coffee beans (leftward D shift) as consumers switch. [2] Link to Extract 2 popularity.
Q9. [2 marks]
Growth 2021→2023: (110−100)/100 = 10% over 2 years. Average annual = 10% / 2 = 5%. [2]
Working: (110−100)/100 = 0.10; /2 = 0.05 = 5% p.a.
Q10. [3 marks]
- Diagram: D shifts left (D1→D2). [1]
- Consumer surplus shrinks from CS1 to CS2. [1]
- Substitute reduces coffee demand, lowers price, less CS. [1]
Section C: Source-Based Evaluation (Q11–15)
Q11. [2 marks]
Local output rose 15% [1]; consumer prices up 10% [1].
Q12. [2 marks]
Base 200+10200 × 1.10 = $220. [2]
Note: Tariff passed to consumers per Extract 3.
Q13. [3 marks]
- Diagram: Tariff raises price Pw→Pt. [1]
- CS falls from area under D above Pw to smaller area above Pt. [1]
- Explanation: higher price, lower Q reduces CS. [1]
Q14. [2 marks]
Retaliatory tariffs reduced electronics exports by 8% → job losses or trade war. [2] Any unintended consequence explained.
Q15. [6 marks] Mark descriptors:
- Identify protection benefit: local output +15% (1)
- Cost: consumer price +10% (1)
- External loss: export drop 8% (1)
- Net welfare: producer gain vs consumer loss + trade retaliation (2)
- Judgement: ambiguous; short-run industry gain, long-run welfare ambiguous (1)
Teaching note: Use CS/PS analysis; tariff creates DWL but protects jobs.
Section D: Synthesis and Higher-Order (Q16–20)
Q16. [2 marks]
Emissions fell 9% [1]; manufacturing jobs −3% [1].
Q17. [3 marks]
- Diagram: MPC shifts to MSC via tax. [1]
- Corrects externality: Qm→Qe. [1]
- Tax internalises cost. [1]
Q18. [2 marks]
Capital flight = firms moving abroad to avoid tax/cost, shown by relocation. [2]
Q19. [1 mark]
Net change = −3% (only effect given). [1]
Q20. [8 marks] Mark scheme:
- Carbon tax: emissions −9%, jobs −3%, investment +25% (2)
- Subsidy alternative: could support renewables without job loss but costs gov revenue (2)
- Evaluation: tax effective but distributional cost; subsidy needs funding (2)
- Conclusion with evidence-based judgement (2)
Teaching note: Synthesis from Extract 4; compare instruments using efficiency and equity.
Free quiz and exam paper access
Enter your details to view this paper
Your access is remembered on this device.