AI Generated Exam Paper
A Level H2 Economics Practice Paper 5
Free A Level H2 Econs Practice Paper 5, LongCat AI version, with questions, answers, and A Level-style practice for Singapore students.
These static practice materials are generated from the site's syllabus and paper-generation workflow, with source and model context shown so students and parents can evaluate the material before use.
Questions
TuitionGoWhere Practice Paper - Economics H2 A-Level
TuitionGoWhere Practice Paper (AI)
Subject: Economics H2
Level: A-Level
Paper: Practice Paper — Microeconomics
Version: 5 of 5
Duration: 1 hour 15 minutes
Total Marks: 40
Name: ___________________________
Class: ___________________________
Date: ___________________________
Instructions
- Answer all questions in Section A and Section B.
- Write your answers in the spaces provided.
- The number of marks for each question or part-question is shown in brackets [ ].
- You are advised to spend approximately 30 minutes on Section A and 45 minutes on Section B.
- Where diagrams are required, draw clearly and label fully.
- Quality of written communication will be assessed in Section B.
Section A: Structured Questions (20 marks)
Answer all questions in this section.
Question 1 [2]
Define the term price elasticity of demand and state its formula.
Question 2 [2]
A supermarket chain reduces the price of its own-brand rice from 5.00to4.50 per kilogram. Weekly sales increase from 2,000 kg to 2,400 kg.
(a) Calculate the price elasticity of demand using the midpoint (arc elasticity) method. Show your working. [1]
(b) State whether demand is elastic or inelastic. Justify your answer. [1]
Question 3 [3]
Distinguish between a normal good and an inferior good. Give one example of each in the context of Singapore.
Question 4 [3]
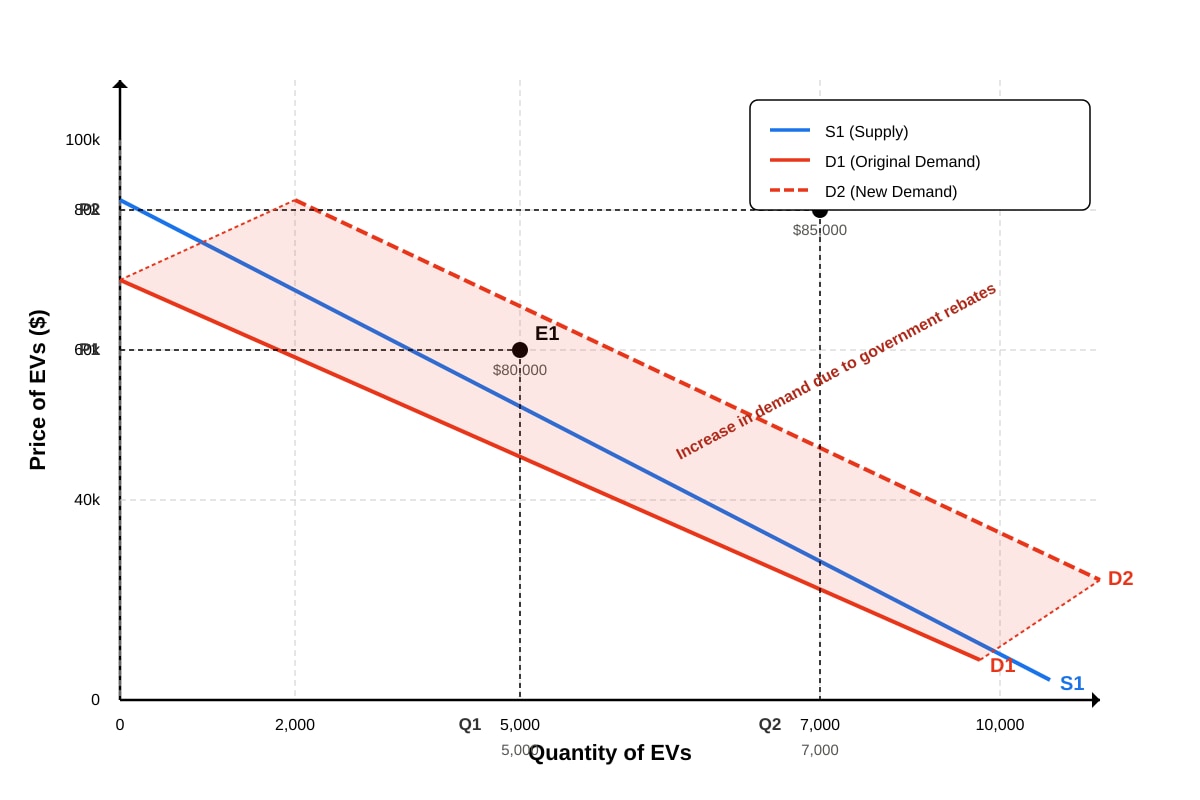
Generated graph for Q4.
Using the diagram above, explain how the Singapore government's Vehicular Emissions Scheme (VES) rebates for electric vehicles could lead to the changes shown. In your answer, identify the type of government intervention and explain the impact on market equilibrium.
Question 5 [3]
Explain two reasons why the Singapore government might provide public goods such as street lighting.
Question 6 [3]
A firm in monopolistic competition is currently making supernormal profits in the short run.
(a) Draw a fully labelled diagram showing the firm's short-run equilibrium. [2]
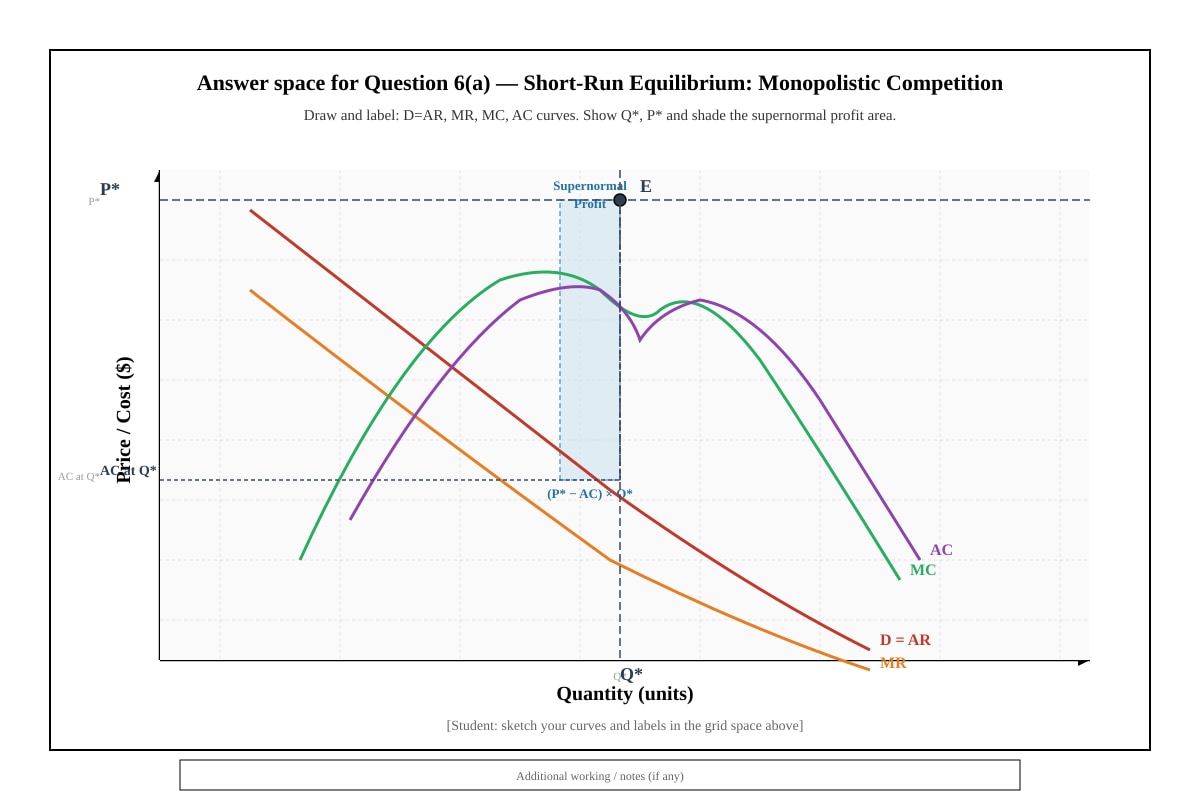
Generated diagram for Q6.
(b) Explain what happens to this firm's profits in the long run. [1]
Question 7 [2]
Explain the difference between productive efficiency and allocative efficiency. State the conditions required for each in a perfectly competitive market.
Question 8 [2]
State two characteristics of an oligopoly market structure and explain why firms in an oligopoly might engage in non-price competition.
Section B: Case Study and Extended Response (20 marks)
Read the following source material and answer all questions.
Source: Singapore's Private Healthcare Market
Singapore's private healthcare sector has seen significant consolidation in recent years. In 2023, Parkway Pantai, one of the largest private hospital groups, announced plans to acquire a chain of specialist clinics across the island. The Competition and Consumer Commission of Singapore (CCCS) reviewed the acquisition and ultimately approved it, subject to conditions that the merged entity would not engage in anti-competitive bundling of services.
Private healthcare in Singapore is characterised by a small number of large hospital groups competing for patients. Barriers to entry are high due to the capital costs of building hospitals, the need for specialist medical staff, and regulatory licensing requirements. Patients often rely on recommendations from general practitioners and have limited information about the quality and pricing of specialist services.
The Singapore government provides subsidies for public healthcare through schemes such as MediShield Life and MediSave, but private healthcare remains largely market-driven. Some economists have argued that the consolidation of private healthcare providers could lead to higher prices and reduced consumer choice. Others contend that economies of scale from mergers could lower costs and improve the quality of care.
In 2024, the Ministry of Health introduced a new regulation requiring all private healthcare providers to publish transparent pricing for common procedures. This was intended to improve information symmetry and enable patients to make better-informed decisions.
Question 9 [4]
Using a demand and supply diagram, explain how the acquisition of specialist clinics by Parkway Pantai might affect the price and quantity of private healthcare services in Singapore.
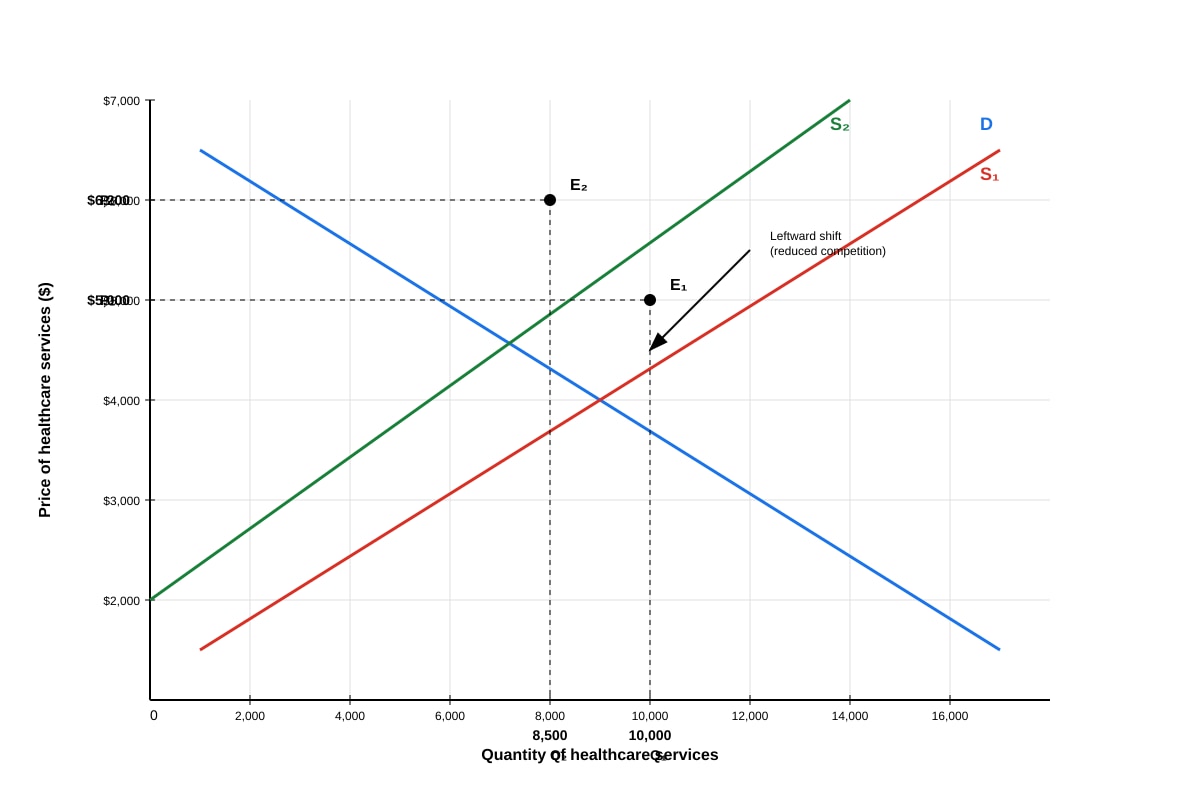
Generated graph for Q9.
Question 10 [4]
The source states that "patients often rely on recommendations from general practitioners and have limited information about the quality and pricing of specialist services."
(a) Identify the type of market failure described in the above statement. [1]
(b) Explain how this market failure leads to an inefficient allocation of resources. [2]
(c) Evaluate whether the 2024 regulation requiring transparent pricing is likely to fully address this market failure. [1]
Question 11 [5]
Using information from the source and your knowledge of market structures, discuss whether the Singapore private healthcare market is best described as an oligopoly. In your answer, consider the characteristics of the market and the behaviour of firms.
Question 12 [7]
"Discuss whether the consolidation of private healthcare providers in Singapore will benefit or disadvantage consumers."
In your answer, consider both the potential benefits and disadvantages for consumers, the role of government regulation, and the relevance of the market structure. Use economic theory and evidence from the source to support your analysis.
End of Paper
Answers
TuitionGoWhere Practice Paper — Economics H2 A-Level
Answer Key and Marking Scheme
Paper: Practice Paper — Microeconomics
Version: 5 of 5
Total Marks: 40
Section A: Structured Questions (20 marks)
Question 1 [2]
Answer:
Price elasticity of demand (PED) measures the degree of responsiveness of the quantity demanded of a good to a change in its own price, ceteris paribus.
Formula:
PED=% change in price% change in quantity demanded
Marking:
- 1 mark for a correct definition that includes "responsiveness of quantity demanded to a change in price" (or equivalent wording).
- 1 mark for the correct formula.
Common mistakes:
- Confusing PED with PES (price elasticity of supply) — students must specify quantity demanded and own price.
- Omitting "ceteris paribus" is acceptable at this level but good practice to include it.
Question 2 [2]
(a) Calculation using midpoint method [1]
Working:
% ΔQd=(Q2+Q1)/2Q2−Q1×100=(2400+2000)/22400−2000×100=2200400×100=18.18%
% ΔP=(P2+P1)/2P2−P1×100=(4.50+5.00)/24.50−5.00×100=4.75−0.50×100=−10.53%
PED=−10.53%18.18%=−1.73
Answer: PED = −1.73 (or +1.73 if using absolute value)
Marking:
- 1 mark for correct final answer with appropriate working shown. Accept answers in the range −1.70 to −1.75 due to rounding differences.
(b) Elastic or inelastic [1]
Answer: Demand is elastic because the absolute value of PED is greater than 1 (|−1.73| > 1). This means that the percentage change in quantity demanded is proportionally greater than the percentage change in price.
Marking:
- 1 mark for stating "elastic" with a valid justification referencing the value being greater than 1 in absolute terms.
Common mistakes:
- Stating the answer is positive — PED is normally negative due to the law of demand, but the sign is often ignored when classifying elasticity. Award the mark if the student states "elastic" with correct reasoning.
- Confusing elastic with inelastic — students must know that |PED| > 1 means elastic.
Question 3 [3]
Answer:
A normal good is one for which demand increases as consumer income rises (positive income elasticity of demand). An inferior good is one for which demand decreases as consumer income rises (negative income elasticity of demand).
Example of a normal good in Singapore: Dining at restaurants (e.g., at hawker centres or food courts, as incomes rise, consumers may dine out more frequently or at higher-end establishments).
Example of an inferior good in Singapore: Consumption of instant noodles or public transport (as incomes rise, consumers may switch to private cars or food delivery services).
Marking:
- 1 mark for correct definition of a normal good.
- 1 mark for correct definition of an inferior good.
- 1 mark for two appropriate Singapore-context examples (½ mark each if only one is given or if examples are vague).
Common mistakes:
- Confusing inferior goods with "low-quality" goods — inferior goods are defined by the relationship between income and demand, not by quality.
- Giving examples without linking them to income changes.
Question 4 [3]
Answer:
The VES rebates for electric vehicles act as a form of government subsidy (or financial incentive) that reduces the effective cost of purchasing an EV for consumers. This increases the demand for EVs at every price level, causing the demand curve to shift rightward from D1 to D2.
At the original equilibrium E1 (P1 = 80,000,Q1=5,000),theincreaseindemandcreatesatemporaryshortage,whichputsupwardpressureonprice.Aspricerises,thereisanextensionofsupply(movementalongS1)untilanewequilibriumE2isestablishedatahigherprice(P2=85,000) and higher quantity (Q2 = 7,000).
The government intervention here is a subsidy/incentive aimed at correcting the positive externality associated with EV use (reduced air pollution and carbon emissions).
Marking:
- 1 mark for identifying the type of government intervention (subsidy/financial incentive).
- 1 mark for explaining the rightward shift in demand (not a movement along the curve).
- 1 mark for explaining the new equilibrium with higher price and quantity.
Common mistakes:
- Confusing a shift of the demand curve with a movement along it. A subsidy to consumers shifts the demand curve rightward; it does not cause a movement along the curve.
- Stating that the supply curve shifts — the VES rebate affects consumers, not producers, so it is a demand-side intervention.
Expected diagram features (Q4-fig1): The diagram should show D1 shifting rightward to D2, with S1 unchanged. Both equilibria E1 and E2 should be clearly labelled with P1, P2, Q1, Q2. The area between D1 and D2 should be shaded to indicate the increase in demand.
Question 5 [3]
Answer:
The Singapore government provides public goods such as street lighting because of two key characteristics of public goods:
1. Non-excludability: It is not possible to prevent anyone from benefiting from street lighting, even if they have not paid for it. Private firms cannot charge individual users, so there is no profit incentive for private provision. This leads to the free-rider problem, where individuals benefit without paying, resulting in under-provision by the market.
2. Non-rivalry: One person's consumption of street lighting does not reduce the amount available for others. The marginal cost of an additional person benefiting is zero.
Because of these two characteristics, the market fails to provide public goods efficiently (market failure due to missing markets). The government must step in to provide street lighting through taxation revenue to ensure an adequate quantity is supplied.
Marking:
- 1 mark for identifying non-excludability and explaining the free-rider problem.
- 1 mark for identifying non-rivalry and explaining its implication.
- 1 mark for linking to market failure and the need for government provision.
Common mistakes:
- Confusing public goods with merit goods. Public goods are defined by non-excludability and non-rivalry; merit goods are goods that are under-consumed due to information failure or positive externalities.
- Only stating one characteristic — both are needed for a complete answer.
Question 6 [3]
(a) Diagram [2]
Expected diagram features (Q6-fig1):
The student should draw a diagram for a firm in monopolistic competition showing:
- A downward-sloping demand curve (D = AR) — reflecting the firm's some degree of market power (product differentiation).
- A marginal revenue (MR) curve below the demand curve.
- A U-shaped average cost (AC) curve.
- An upward-sloping marginal cost (MC) curve.
- The profit-maximising output (Q*) where MC = MR.
- The price (P*) read off the demand curve at Q*.
- The average cost read off the AC curve at Q*.
- The supernormal profit area shaded: the rectangle between P* and AC at output Q*.
Marking:
- 1 mark for correct shape and positioning of curves (D, MR, MC, AC).
- 1 mark for correct identification of equilibrium (MC = MR) and shaded supernormal profit area.
(b) Long-run profits [1]
Answer: In the long run, the supernormal profits attract new firms to enter the market (due to low barriers to entry in monopolistic competition). This reduces the market share of existing firms, causing each firm's demand curve to shift leftward until it is tangent to the AC curve. At this point, firms earn only normal profits (zero economic profit).
Marking:
- 1 mark for explaining that new entry occurs, demand shifts left, and firms earn normal profits in the long run.
Common mistakes:
- Stating that firms continue to earn supernormal profits in the long run — this is a feature of monopoly, not monopolistic competition.
- Not mentioning the role of free entry and exit.
Question 7 [2]
Answer:
Productive efficiency occurs when firms produce at the lowest possible average cost (minimum point of the AC curve). In a perfectly competitive market, this occurs in the long run where P = minimum AC.
Allocative efficiency occurs when resources are allocated to produce the combination of goods and services that best reflects consumer preferences. This occurs where P = MC (marginal benefit to consumers equals marginal cost of production). In a perfectly competitive market, this is achieved in both the short and long run because firms are price takers and produce where P = MC.
Marking:
- 1 mark for correct definition of productive efficiency and the condition (P = minimum AC).
- 1 mark for correct definition of allocative efficiency and the condition (P = MC).
Common mistakes:
- Confusing the two types of efficiency.
- Stating that allocative efficiency requires P = AC — this is incorrect; allocative efficiency requires P = MC.
Question 8 [2]
Answer:
Two characteristics of oligopoly:
- A small number of large firms dominate the market (high concentration ratio).
- High barriers to entry (e.g., economies of scale, brand loyalty, capital requirements).
Non-price competition: Firms in an oligopoly might engage in non-price competition (e.g., advertising, product differentiation, loyalty programmes, after-sales service) because:
- Price wars can be destructive — if one firm lowers prices, rivals are likely to match, leading to lower profits for all (interdependence of firms).
- Non-price competition allows firms to differentiate their products, build brand loyalty, and increase market share without triggering retaliatory price cuts.
Marking:
- 1 mark for two correct characteristics of oligopoly.
- 1 mark for a clear explanation of why non-price competition is preferred over price competition in oligopoly.
Common mistakes:
- Listing characteristics without explaining non-price competition.
- Not linking non-price competition to the concept of interdependence.
Section B: Case Study and Extended Response (20 marks)
Question 9 [4]
Answer:
The acquisition of specialist clinics by Parkway Pantai reduces the number of competing providers in the private healthcare market. This could lead to a leftward shift of the supply curve from S1 to S2, as the merged entity may rationalise services, close duplicate clinics, or gain greater market power to restrict output and raise prices.
Using the diagram:
- At the initial equilibrium E1, price is P1 ($5,000) and quantity is Q1 (10,000).
- After the acquisition, the supply curve shifts left to S2.
- The new equilibrium E2 shows a higher price P2 ($6,200) and lower quantity Q2 (8,500).
Alternatively, students may argue that the merger could lead to economies of scale, shifting the supply curve rightward and lowering prices. Either argument is acceptable if supported by a correctly drawn diagram and sound economic reasoning.
Marking:
- 1 mark for correctly drawing/annotating a supply and demand diagram showing the shift.
- 1 mark for explaining the leftward shift in supply (or rightward if arguing economies of scale).
- 1 mark for explaining the impact on equilibrium price and quantity.
- 1 mark for linking the analysis to the context of the source (private healthcare consolidation).
Common mistakes:
- Shifting the demand curve instead of the supply curve — the merger affects the supply side (number of providers).
- Not labelling the diagram fully.
Expected diagram features (Q9-fig1): The diagram should show S1 shifting leftward to S2, with D unchanged. Both equilibria E1 and E2 should be clearly labelled with P1, P2, Q1, Q2. Alternatively, a rightward shift of S is acceptable if the student argues economies of scale.
Question 10 [4]
(a) Type of market failure [1]
Answer: Asymmetric information (or information failure). Patients have less information about the quality and pricing of specialist services compared to healthcare providers.
Marking:
- 1 mark for correctly identifying asymmetric information / information failure.
(b) Explanation of inefficient allocation [2]
Answer:
Asymmetric information means that patients cannot accurately assess the quality or necessity of specialist treatments. This leads to two problems:
-
Adverse selection: Patients may choose overpriced or unnecessary treatments because they lack the expertise to evaluate alternatives. Providers may exploit this information advantage to recommend more expensive procedures (supplier-induced demand).
-
Misallocation of resources: Resources are directed towards treatments that may not be the most effective or cost-effective, rather than those that maximise patient welfare. This results in allocative inefficiency — the marginal social benefit of healthcare expenditure does not equal the marginal social cost.
Marking:
- 1 mark for explaining how asymmetric information leads to poor consumer choices.
- 1 mark for linking this to allocative inefficiency (MSB ≠ MSC or misallocation of resources).
(c) Evaluation of the 2024 regulation [1]
Answer:
The 2024 regulation requiring transparent pricing is a step towards reducing information asymmetry, but it is unlikely to fully address the market failure because:
- Transparent pricing only addresses price information, not quality information. Patients still lack the medical expertise to judge whether a procedure is necessary or of good quality.
- Healthcare is a credence good — even after consuming the service, patients may not know if they received the best treatment. Publishing prices does not solve this deeper information problem.
Marking:
- 1 mark for a clear evaluative statement (e.g., "unlikely to fully address") with a valid reason (e.g., quality information still lacking, credence good nature).
Common mistakes:
- Simply stating "yes, it will solve the problem" without evaluation — this does not earn the mark as the question asks students to evaluate, not just describe.
Question 11 [5]
Answer:
Arguments that the private healthcare market is an oligopoly:
-
Small number of large firms: The source states that "a small number of large hospital groups" compete in the market. This is a key characteristic of oligopoly. In Singapore, the private healthcare market is dominated by groups such as Parkway Pantai, Raffles Medical, and Thomson Medical.
-
High barriers to entry: The source mentions "capital costs of building hospitals, the need for specialist medical staff, and regulatory licensing requirements" as barriers to entry. These are consistent with oligopoly, where high barriers prevent new firms from easily entering.
-
Interdependence and non-price competition: In oligopolies, firms are interdependent — the actions of one firm affect others. The consolidation through mergers (e.g., Parkway Pantai acquiring clinics) suggests firms are strategically competing for market share, which is typical of oligopolistic behaviour.
Arguments against oligopoly / alternative market structure:
-
Monopolistic competition: Some might argue that private healthcare is closer to monopolistic competition because hospitals differentiate themselves through location, specialist services, and brand reputation. However, the high barriers to entry and small number of firms make oligopoly a better fit.
-
Market power concerns: The CCCS review of the acquisition suggests that the market is concentrated enough to raise competition concerns, which is more consistent with oligopoly than monopolistic competition.
Conclusion: The private healthcare market in Singapore is best described as an oligopoly due to the small number of dominant firms, high barriers to entry, and strategic interdependence in merger and pricing decisions.
Marking (Level-based):
| Level | Marks | Descriptor |
|---|---|---|
| Level 3 | 4–5 | Clear identification of oligopoly characteristics with detailed reference to the source. Considers alternative market structures. Well-structured argument with a reasoned conclusion. |
| Level 2 | 2–3 | Identifies some oligopoly characteristics with limited reference to the source. May not consider alternatives. Argument lacks depth or structure. |
| Level 1 | 1 | Basic description of market structure with little reference to the source or economic theory. |
Question 12 [7]
Answer:
Introduction: The consolidation of private healthcare providers refers to mergers and acquisitions that reduce the number of firms in the market. Whether this benefits or disadvantages consumers depends on the balance between potential efficiency gains and the exercise of increased market power, as well as the effectiveness of government regulation.
Potential benefits for consumers:
-
Economies of scale: Merged entities may achieve lower average costs through bulk purchasing of medical supplies, shared administrative functions, and better utilisation of specialist equipment. If these cost savings are passed on to consumers, prices could fall.
-
Improved quality of care: Larger groups may invest more in advanced medical technology and attract top specialists, improving the quality and range of services available to patients.
-
One-stop service: Consolidation could allow patients to access a wider range of specialist services within a single healthcare group, improving convenience and continuity of care.
Potential disadvantages for consumers:
-
Higher prices due to increased market power: With fewer competitors, the merged entity has greater ability to raise prices. The source notes that "consolidation could lead to higher prices and reduced consumer choice." This is particularly concerning in healthcare, where demand is price inelastic (patients need treatment regardless of price).
-
Reduced consumer choice: Fewer independent providers mean patients have less choice over where to seek treatment. This could reduce the incentive for remaining firms to compete on quality and price.
-
Allocative inefficiency: If the merged firm restricts output to raise prices above marginal cost, there is a deadweight welfare loss. Society's resources are not being used efficiently.
Role of government regulation:
The CCCS approval "subject to conditions" shows that regulation can mitigate some anti-competitive effects. The 2024 transparent pricing regulation addresses information asymmetry. However, regulation has limitations:
- It is difficult for regulators to monitor pricing behaviour continuously.
- Conditions on mergers may not prevent tacit collusion or gradual price increases over time.
- The CCCS approved the merger, suggesting regulators judged the benefits to outweigh the costs in this case.
Evaluation and conclusion:
Whether consumers benefit or are disadvantaged depends on:
- Whether cost savings from economies of scale are passed on to consumers (depends on the firm's pricing strategy and regulatory oversight).
- The price elasticity of demand for private healthcare — if demand is inelastic, firms have more scope to raise prices without losing many customers.
- The effectiveness of ongoing regulation in preventing abuse of market power.
On balance, consumers are more likely to be disadvantaged in the short to medium term because the market is characterised by inelastic demand and information asymmetry, giving merged firms significant pricing power. However, with effective regulation (as seen with CCCS conditions and the 2024 pricing transparency rule), some of the potential disadvantages can be mitigated. The long-run outcome depends on whether new entrants can overcome barriers to entry and restore competitive pressure.
Marking (Level-based):
| Level | Marks | Descriptor |
|---|---|---|
| Level 3 | 6–7 | Comprehensive discussion of both benefits and disadvantages with clear use of economic theory (economies of scale, market power, elasticity, allocative efficiency). Detailed reference to the source. Strong evaluative conclusion that considers context and time frame. Effective use of diagram(s) if included. |
| Level 2 | 3–5 | Some discussion of benefits and disadvantages with reference to economic theory. Limited use of the source. Conclusion may be one-sided or lack depth. |
| Level 1 | 1–2 | Basic points with little economic theory or source reference. No clear conclusion. |
Common mistakes:
- Only discussing benefits OR disadvantages — the command word "discuss" requires both sides.
- Not referencing the source material — students must use evidence from the source to score in the top level.
- Failing to reach a conclusion — evaluation requires a reasoned judgement.
- Not considering the role of government regulation — this is explicitly asked for in the question.
End of Answer Key
Free quiz and exam paper access
Enter your details to view this paper
Your access is remembered on this device.