AI Generated Exam Paper
A Level H2 Economics Practice Paper 4
Free A Level H2 Econs Practice Paper 4, LongCat AI version, with questions, answers, and A Level-style practice for Singapore students.
These static practice materials are generated from the site's syllabus and paper-generation workflow, with source and model context shown so students and parents can evaluate the material before use.
Questions
TuitionGoWhere Practice Paper - Economics H2 A-Level
TuitionGoWhere Practice Paper (AI)
Subject: Economics H2 Level: A-Level Paper: Practice Paper — Microeconomics Version: 4 of 5 Duration: 1 hour 45 minutes Total Marks: 50
Name: ___________________________ Class: ___________________________ Date: ___________________________
Instructions
- Answer all questions in Section A and Section B.
- Write your answers in the spaces provided.
- Begin each section on a fresh page.
- The number of marks for each question is shown in brackets [ ].
- You are advised to spend approximately 45 minutes on Section A and 60 minutes on Section B.
- Where relevant, use clearly labelled economic diagrams to support your answers.
- Credit will be given for the quality of written communication where appropriate.
Section A: Short-Answer and Data Response [20 marks]
Answer all questions in this section.
Question 1 [2 marks]
Define the term allocative efficiency and state the condition under which it is achieved.
Question 2 [3 marks]
The table below shows the total revenue (TR) and total cost (TC) of a firm at different output levels.
| Output (units) | Total Revenue ($) | Total Cost ($) |
|---|---|---|
| 0 | 0 | 20 |
| 1 | 30 | 40 |
| 2 | 55 | 55 |
| 3 | 75 | 65 |
| 4 | 90 | 80 |
| 5 | 100 | 100 |
(a) Calculate the profit-maximising level of output. Show your working. [1]
(b) Calculate the total profit at the profit-maximising output. Show your working. [1]
(c) State the condition for profit maximisation in any market structure. [1]
Question 3 [4 marks]
Image pending generation: graph for Q3.
Refer to the diagram above, which shows the effect of a government subsidy on the market for electric vehicles in Singapore.
(a) Using the diagram, explain why the supply curve shifts from S1 to S2 when a subsidy is introduced. [2]
(b) Identify the change in consumer expenditure on electric vehicles after the subsidy. Show your working. [2]
Question 4 [5 marks]
Read the following extract and answer the questions that follow.
Extract A: The Singapore Private Hire Car Market
Following the entry of Grab and Gojek into Singapore's private hire car market, the market structure has evolved significantly. Before 2013, the market was dominated by traditional taxi operators such as ComfortDelGro and SMRT Taxis, which operated under government-regulated fare structures and limited entry through COE (Certificate of Entitlement) requirements. The ride-hailing platforms disrupted this arrangement by enabling private car drivers to offer rides at dynamic prices, bypassing traditional licensing barriers.
By 2023, Grab held approximately 75% of the private hire car market share in Singapore. Critics argue that Grab's dominant position allows it to charge higher commission rates from drivers (reportedly 20–25% per ride) and surge pricing during peak hours, which harms consumers. Supporters counter that competition from Gojek, TADA, and traditional taxis keeps the market contestable, and that Grab's scale enables technological innovation such as GrabPay and GrabFood integration.
The Competition and Consumer Commission of Singapore (CCCS) fined Grab $6.42 million in 2018 for anti-competitive practices related to its acquisition of Uber's Southeast Asian operations. However, no price caps or market share limits have been imposed on ride-hailing platforms to date.
(a) Using evidence from Extract A, identify the market structure that best describes Singapore's private hire car market. Justify your answer with two characteristics. [3]
(b) Explain one possible reason why the CCCS fined Grab but did not impose price caps. [2]
Question 5 [6 marks]
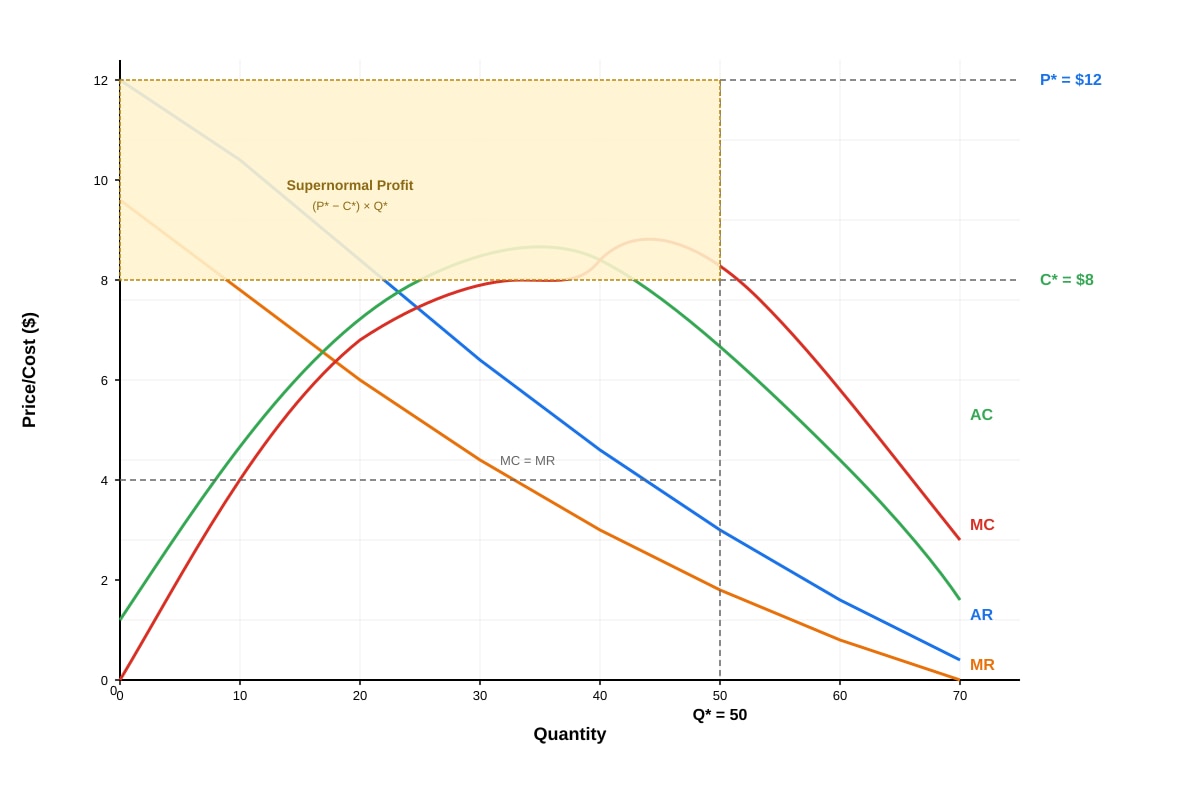
Generated graph for Q5.
Refer to the diagram above, which shows a firm in monopolistic competition earning supernormal profit in the short run.
(a) Using the diagram, explain why the firm is earning supernormal profit at output Q*. [2]
(b) Explain what is likely to happen to this firm's demand curve and profit level in the long run. Illustrate your answer on a diagram. [4]
Section B: Essay Questions [30 marks]
Answer any two questions from this section. Begin each answer on a fresh page.
Question 6 [15 marks]
Singapore's government has progressively increased the Carbon Tax from 5pertonneofCO2−equivalentin2019to25 per tonne in 2024, with plans to raise it to 50–80 per tonne by 2030.
(a) Using an appropriate diagram, explain how a carbon tax can correct the market failure arising from carbon emissions. [7]
(b) Discuss whether increasing the carbon tax is the most effective policy for Singapore to reduce its carbon emissions. [8]
Question 7 [15 marks]
In 2023, the Singapore government announced a $1.5 billion support package for local enterprises undergoing digital transformation, citing the need to remain competitive amid rapid technological disruption.
(a) Explain why the market may under-provide digital transformation services without government intervention. [7]
(b) Assess whether government subsidies or regulation is more effective in promoting digital transformation among Singapore's small and medium enterprises (SMEs). [8]
Question 8 [15 marks]
The global semiconductor shortage of 2021–2023 disrupted supply chains worldwide, affecting industries from automobiles to consumer electronics. Singapore, as a significant player in semiconductor manufacturing (accounting for approximately 11% of global semiconductor output), experienced both challenges and opportunities.
(a) Using demand and supply analysis, explain the causes of the semiconductor shortage and its impact on the price and quantity of consumer electronics. [7]
(b) Discuss whether Singapore should subsidise its semiconductor industry to strengthen its global competitiveness. [8]
End of Practice Paper
Mark Summary
| Section | Marks |
|---|---|
| Question 1 | 2 |
| Question 2 | 3 |
| Question 3 | 4 |
| Question 4 | 5 |
| Question 5 | 6 |
| Section A Total | 20 |
| Question 6 (or 7 or 8) | 15 |
| Question 7 (or 6 or 8) | 15 |
| Section B Total | 30 |
| Grand Total | 50 |
Answers
TuitionGoWhere Practice Paper — Economics H2 A-Level
Answer Key and Marking Scheme
Paper: Practice Paper — Microeconomics (Version 4 of 5) Total Marks: 50
Section A: Short-Answer and Data Response [20 marks]
Question 1 [2 marks]
Question: Define the term allocative efficiency and state the condition under which it is achieved.
Answer:
Allocative efficiency occurs when resources are allocated in a way that maximises consumer satisfaction — that is, the combination of goods and services produced reflects consumer preferences. [1]
It is achieved when Price = Marginal Cost (P = MC), meaning the value consumers place on the last unit consumed (reflected by price) equals the cost of producing that last unit. [1]
Marking Notes:
- 1 mark for a correct definition (must reference consumer preferences/satisfaction or optimal resource allocation).
- 1 mark for stating P = MC as the condition.
- Do not award the second mark for merely stating "MC = MR" (that is profit maximisation, not allocative efficiency).
Question 2 [3 marks]
Question: Calculate profit-maximising output, total profit, and state the profit-maximisation condition.
Answer:
(a) Profit-maximising output: 3 units [1]
Working: Calculate profit (TR − TC) at each output level:
| Output | TR ($) | TC ($) | Profit ($) |
|---|---|---|---|
| 0 | 0 | 20 | −20 |
| 1 | 30 | 40 | −10 |
| 2 | 55 | 55 | 0 |
| 3 | 75 | 65 | 10 |
| 4 | 90 | 80 | 10 |
| 5 | 100 | 100 | 0 |
Profit is maximised at 3 units (or 4 units, both yield $10 profit; accept either 3 or 4 units as the answer, but 3 units is the first occurrence of maximum profit). [1]
Award the mark for correct identification of 3 (or 4) units with or without working shown.
(b) Total profit at profit-maximising output: $10 [1]
Working: At output = 3 units, Profit = TR − TC = 75−65 = $10. [1]
(c) Condition for profit maximisation: Marginal Revenue = Marginal Cost (MR = MC) [1]
Marking Notes:
- (a) Award 1 mark for the correct answer (3 units). Working is not required but helps confirm the answer.
- (b) Award 1 mark for the correct answer ($10). Must show TR − TC calculation.
- (c) Award 1 mark for stating MR = MC. Do not accept "MC = MR" without explanation — though it is mathematically equivalent, the standard economic formulation is MR = MC.
- Common mistake: Students may confuse profit maximisation (MR = MC) with allocative efficiency (P = MC). This question only asks for the profit-maximisation condition.
Question 3 [4 marks]
Question: Refer to the demand and supply diagram for the EV market with a subsidy.
Answer:
(a) Explanation of supply curve shift (2 marks):
A subsidy is a payment by the government to producers for each unit produced. This effectively reduces the cost of production for producers at every level of output. [1]
Because producers' costs fall, they are willing to supply a greater quantity at each price (or the same quantity at a lower price). This is represented by a rightward/downward shift of the supply curve from S1 to S2. [1]
Marking Notes:
- 1 mark for explaining that a subsidy reduces producers' costs.
- 1 mark for linking the cost reduction to a rightward shift in supply (greater quantity supplied at each price).
- Students should not simply state "the supply curve shifts right" without explaining why.
(b) Change in consumer expenditure (2 marks):
Before subsidy: Consumer expenditure = P1 × Q1 = 80,000×5,000=∗∗400,000,000**
After subsidy: Consumer expenditure = P2 × Q2 = 65,000×8,000=∗∗520,000,000**
Change in consumer expenditure = 520,000,000−400,000,000 = +$120,000,000 (increase) [1]
Consumer expenditure increases by $120 million. [1]
Marking Notes:
- 1 mark for correct calculation of expenditure before and after (or correct method with values substituted).
- 1 mark for the correct final answer (increase of $120 million).
- Accept answers that show the correct method even if arithmetic is slightly off.
- Note: Consumer expenditure increases because demand is price inelastic over this range (the percentage increase in quantity demanded is proportionally larger than the percentage decrease in price). Students are not required to state this, but it is a useful teaching point.
Image Placeholder Notes: The diagram must show: D1 (downward sloping), S1 and S2 (upward sloping, S2 to the right of S1), equilibrium points at (Q1, P1) and (Q2, P2), with P2 < P1 and Q2 > Q1. The shaded area between S1 and S2 represents the total subsidy cost to the government. All axes and curves must be clearly labelled.
Question 4 [5 marks]
Question: Market structure analysis of Singapore's private hire car market using Extract A.
Answer:
(a) Market structure identification (3 marks):
The private hire car market in Singapore is best described as an oligopoly (or a market with monopolistic tendencies). [1]
Justification with two characteristics:
-
High market concentration / few dominant firms: Extract A states that Grab holds approximately 75% of the market share, indicating that a small number of firms (Grab, Gojek, TADA) dominate the market. This is a key characteristic of an oligopoly. [1]
-
Barriers to entry: The extract mentions that traditional taxi operators faced barriers through COE requirements and licensing. While ride-hailing platforms bypassed some of these, Grab's dominant position, network effects, and established driver/rider base create significant barriers for new entrants. [1]
Alternative acceptable answer: Students may argue the market is a monopoly (given Grab's 75% share) or monopolistic competition (given product differentiation among platforms). Award marks if justified with evidence from the extract.
Marking Notes:
- 1 mark for correctly identifying the market structure (oligopoly, monopoly, or monopolistic competition — must be justified).
- 1 mark for the first characteristic with reference to the extract.
- 1 mark for the second characteristic with reference to the extract.
- Answers must reference the extract to earn full marks.
(b) Explanation of CCCS decision (2 marks):
The CCCS fined Grab for anti-competitive practices (the Uber acquisition reduced competition in the market) to deter future anti-competitive behaviour and to penalise the reduction in market competition. [1]
However, the CCCS did not impose price caps because price controls can lead to unintended consequences such as reduced service quality, driver shortages, or deadweight loss. The CCCS likely judged that maintaining a competitive market structure (through fines and behavioural remedies) is more efficient than direct price intervention, which could distort market signals and reduce dynamic efficiency. [1]
Marking Notes:
- 1 mark for explaining the purpose of the fine (deterrence, punishment for anti-competitive behaviour).
- 1 mark for explaining why price caps were not imposed (unintended consequences, inefficiency of price controls, preference for market-based solutions).
- Accept other valid reasons, e.g., price caps are difficult to set at the correct level, or the market is contestable enough that price caps are unnecessary.
Question 5 [6 marks]
Question: Monopolistic competition diagram analysis.
Answer:
(a) Explanation of supernormal profit at Q (2 marks):*
At the profit-maximising output Q* (where MC = MR), the price P* (determined by the demand/AR curve) is greater than the average cost C* (determined by the AC curve). [1]
Since P* > AC at Q*, the firm earns revenue per unit that exceeds its cost per unit, resulting in supernormal profit. The total supernormal profit is equal to (P* − C*) × Q*, represented by the shaded area on the diagram. [1]
Numerically: Supernormal profit = (12−8) × 50 = $200.
Marking Notes:
- 1 mark for explaining that P* > AC at Q*.
- 1 mark for linking this to supernormal profit (or calculating the profit value).
- Students must reference the diagram or the values provided.
(b) Long-run adjustment (4 marks):
In the long run, the existence of supernormal profit attracts new firms into the industry (since there are low barriers to entry in monopolistic competition). [1]
As new firms enter, the demand curve for the existing firm shifts leftward (and may become more elastic) because consumers now have more substitute options. This reduces the firm's market share and pricing power. [1]
The demand curve continues to shift left until it is tangent to the AC curve at the profit-maximising output. At this point, P = AC, meaning the firm earns only normal profit (zero economic profit). [1]
The long-run equilibrium condition is: AR = AC (at the output where MC = MR), and the demand curve is tangent to the AC curve. The firm no longer earns supernormal profit. [1]
Diagram requirement: Students should draw a diagram showing the demand curve shifting left to become tangent to the AC curve, with the new equilibrium at P = AC and zero supernormal profit.
Marking Notes:
- 1 mark for explaining that new firms enter due to supernormal profit.
- 1 mark for explaining that the demand curve shifts left (and why).
- 1 mark for stating that the firm earns only normal profit in the long run.
- 1 mark for explaining the tangency condition (AR = AC) or for a correct diagram.
- Common mistake: Students may confuse monopolistic competition with monopoly (where supernormal profit can persist in the long run due to barriers to entry). Emphasise that free entry/exit is the key distinction.
Image Placeholder Notes: The diagram must show: AR (downward sloping demand), MR (below AR), MC (upward sloping or U-shaped), AC (U-shaped), equilibrium at MC = MR, price read from AR curve, cost read from AC curve, shaded supernormal profit area = (P* − C*) × Q*. All labels and axes must be clearly marked.
Section B: Essay Questions [30 marks]
Answer any two questions. Each question is worth 15 marks.
Question 6 [15 marks]
Question: Carbon tax and market failure.
Answer:
(a) Diagram explanation of carbon tax correcting market failure [7 marks]:
Knowledge and Understanding (2–3 marks):
Carbon emissions represent a negative externality of production (or consumption). When firms produce goods using fossil fuels, they impose costs on third parties (e.g., health costs, environmental damage, climate change) that are not reflected in the market price. This is a case of market failure because the market over-produces the good relative to the socially optimal level.
The marginal social cost (MSC) exceeds the marginal private cost (MPC) by the amount of the marginal external cost (MEC). The market equilibrium (where MPC = MPB) results in output Qm, which is greater than the socially optimal output Q* (where MSC = MSB).
<image_placeholder> id: Q6a-fig1 type: graph linked_question: Q6 description: A negative externality diagram showing the market for a carbon-intensive good. The x-axis is labelled 'Quantity' and the y-axis is labelled 'Price/Cost ()′.MPC(marginalprivatecost)isanupwardslopingsupplycurve.MSC(marginalsocialcost)isdrawnparallelandaboveMPC,withtheverticaldistancebetweenthemrepresentingthemarginalexternalcost.Thedemandcurve(MPB=MSB)isdownwardsloping.Themarketequilibriumisat(Qm,Pm)whereMPC=MPB.Thesociallyoptimalequilibriumisat(Q∗,P∗)whereMSC=MSB.TheareabetweenMSCandMPC,fromQ∗toQm,isshadedasthedeadweightloss.AcarbontaxequaltotheMECatQ∗shiftstheMPCcurveupwardtoMPC+tax,whichintersectsMPBatQ∗.labels:MPC,MSC,MPB/MSB,Qm,Q∗,Pm,P∗,MPC+tax,shadeddeadweightlossareavalues:Qm=100,Q∗=70,Pm=30, P* = 45,verticaldistancebetweenMPCandMSCatQ∗=25 (the tax per unit) must_show: Two supply curves (MPC and MSC), one demand curve, two equilibrium points, shaded deadweight loss, tax wedge clearly shown, all labels </image_placeholder>
A carbon tax is a per-unit tax imposed on producers equal to the marginal external cost at the socially optimal output. This shifts the MPC curve upward to MPC + tax, effectively internalising the externality. The new market equilibrium occurs at Q*, where MSC = MSB, eliminating the deadweight loss and achieving allocative efficiency. [2–3 marks for diagram and explanation]
Analysis (2–3 marks):
The carbon tax works by increasing the private cost of production to reflect the full social cost. Firms now face higher costs and reduce output to Q*. The tax revenue collected by the government can be used to fund environmental projects or compensate affected parties. The reduction in output from Qm to Q* represents the elimination of the over-production that caused the deadweight loss. [2–3 marks]
Marking Scheme for (a):
| Level | Marks | Descriptor |
|---|---|---|
| Level 3 | 5–7 | Accurate diagram with clear labels; thorough explanation of how the tax internalises the externality; links to allocative efficiency and deadweight loss. |
| Level 2 | 3–4 | Diagram with minor errors; explanation of the tax mechanism but lacking depth or clarity on welfare gains. |
| Level 1 | 1–2 | Basic understanding of negative externality; diagram missing or incorrect; limited explanation. |
(b) Evaluation: Is increasing the carbon tax the most effective policy? [8 marks]:
For the carbon tax (supporting arguments):
-
Market-based efficiency: A carbon tax is a market-based solution that allows firms to choose how to reduce emissions. Firms with lower abatement costs will reduce emissions more, while those with higher costs may pay the tax. This achieves emission reductions at the lowest total cost to society (cost-effective). [2]
-
Revenue generation: The tax generates government revenue that can be used to fund green technology subsidies, public transport, or to reduce other distortionary taxes (e.g., income tax), creating a "double dividend." [1]
-
Dynamic incentive to innovate: A rising carbon tax (as planned by Singapore) gives firms a long-term signal to invest in clean technology and energy efficiency, promoting dynamic efficiency. [1]
Against the carbon tax (limitations and alternatives):
-
Regressive impact: A carbon tax may disproportionately affect lower-income households, as energy costs form a larger proportion of their expenditure. This raises equity concerns, especially in Singapore where energy costs are significant. [1]
-
Inelastic demand for energy: In the short run, demand for carbon-intensive goods (e.g., petrol, electricity) is price inelastic. A tax may raise prices significantly but reduce emissions only modestly, leading to high costs for consumers without proportional environmental benefits. [1]
-
Carbon leakage: As a small open economy, Singapore may face "carbon leakage" — firms relocating to countries with lower or no carbon taxes, reducing the global effectiveness of the policy while harming Singapore's competitiveness. [1]
-
Alternative policies may be more effective:
- Regulation / emission standards: Directly caps emissions, guaranteeing a specific environmental outcome (unlike a tax, which depends on the price elasticity of demand).
- Tradable permits (cap-and-trade): Sets a fixed quantity of emissions and allows firms to trade permits, combining the certainty of regulation with the efficiency of market mechanisms.
- Subsidies for green technology: Encourages adoption of renewable energy and energy-efficient technologies, addressing the supply side rather than just the demand side.
Judgement (evaluative conclusion):
Increasing the carbon tax is an effective policy for reducing emissions, particularly because it provides a clear price signal and generates revenue. However, it may not be the most effective policy on its own, especially given Singapore's small open economy context. A combination of carbon pricing with targeted subsidies for green technology, investment in public transport, and international cooperation to prevent carbon leakage would likely be more effective. The effectiveness also depends on the rate of increase — too fast may harm competitiveness, too slow may not achieve climate targets. [1 mark for a clear, well-supported judgement]
Marking Scheme for (b):
| Level | Marks | Descriptor |
|---|---|---|
| Level 3 | 6–8 | Balanced discussion of at least 2–3 arguments for and against; clear evaluation with a well-supported judgement; considers Singapore's specific context. |
| Level 2 | 3–5 | Some discussion of both sides but unbalanced; limited evaluation; judgement may be weak or unsupported. |
| Level 1 | 1–2 | One-sided argument; no evaluation; descriptive rather than analytical. |
Question 7 [15 marks]
Question: Government support for digital transformation.
Answer:
(a) Why the market may under-provide digital transformation services [7 marks]:
Knowledge and Understanding (2–3 marks):
Digital transformation services (e.g., cloud computing adoption, AI integration, e-commerce platforms) have characteristics of merit goods and generate positive externalities. [1]
Analysis (3–4 marks):
-
Positive externalities of consumption/production: When one firm digitises its operations, it creates benefits for other firms in the supply chain (e.g., faster communication, better data sharing). These external benefits are not captured by the private firm, leading to under-consumption of digital services relative to the socially optimal level. [2]
-
Information failure / imperfect information: Many SMEs, especially smaller or older firms, may lack awareness of the benefits of digital transformation or may underestimate the long-term cost savings. This information asymmetry leads to under-investment. [1]
-
High upfront costs and capital market imperfections: Digital transformation requires significant initial investment. SMEs may face difficulty accessing finance due to information asymmetry with lenders (lenders cannot accurately assess the returns on digital investment), leading to under-provision. [1]
-
Public good characteristics of digital infrastructure: Some digital infrastructure (e.g., broadband networks, cybersecurity frameworks) has non-rivalrous and non-excludable characteristics, leading to free-rider problems and under-provision by the private market. [1]
Marking Scheme for (a):
| Level | Marks | Descriptor |
|---|---|---|
| Level 3 | 5–7 | Explains at least 2–3 reasons with clear economic reasoning; uses appropriate terminology (externalities, merit goods, information failure); may include a diagram. |
| Level 2 | 3–4 | Explains 1–2 reasons with some economic reasoning; terminology may be imprecise. |
| Level 1 | 1–2 | Basic understanding; limited or no economic reasoning; descriptive. |
(b) Subsidies vs. regulation for promoting digital transformation [8 marks]:
For subsidies:
-
Addresses cost barriers: Subsidies directly reduce the cost of digital transformation for SMEs, making it more affordable and encouraging uptake. The $1.5 billion support package lowers the financial risk for firms. [1]
-
Encourages voluntary adoption: Subsidies are less coercive than regulation, allowing firms to choose the digital solutions best suited to their needs, promoting allocative efficiency. [1]
-
Addresses positive externalities: By subsidising digital transformation, the government corrects the market failure arising from positive externalities, moving the market closer to the socially optimal level of digital adoption. [1]
For regulation:
-
Guarantees minimum standards: Regulation (e.g., requiring firms to adopt e-invoicing or digital payment systems) ensures a baseline level of digitalisation across the economy, preventing free-rider problems. [1]
-
Faster results: Regulation can achieve widespread digital adoption more quickly than subsidies, which rely on voluntary uptake and may take time to have an effect. [1]
Limitations of each:
- Subsidies: May lead to government failure if the government picks the wrong technologies or if firms become dependent on subsidies. Also, subsidies are costly and may divert resources from other uses. [1]
- Regulation: May impose uniform standards that are not suitable for all firms, reducing efficiency. Compliance costs may be disproportionately high for smaller firms. Regulation may also stifle innovation by prescribing specific technologies. [1]
Judgement:
For Singapore's SMEs, subsidies are likely more effective in the short to medium term because they address the key barriers (cost and information) without imposing rigid requirements. However, a combination approach — subsidies to encourage adoption and light-touch regulation to set minimum standards — may be most effective. The government should also invest in education and training to address information failures. [1 mark for a clear, well-supported judgement]
Marking Scheme for (b):
| Level | Marks | Descriptor |
|---|---|---|
| Level 3 | 6–8 | Balanced discussion of both policies with clear economic reasoning; considers limitations of each; clear judgement with justification. |
| Level 2 | 3–5 | Discussion of both policies but unbalanced; limited consideration of limitations; weak judgement. |
| Level 1 | 1–2 | One-sided argument; no evaluation; descriptive. |
Question 8 [15 marks]
Question: Semiconductor shortage and government subsidies.
Answer:
(a) Demand and supply analysis of the semiconductor shortage [7 marks]:
Knowledge and Understanding (2–3 marks):
The semiconductor shortage was caused by a combination of supply-side shocks and demand-side increases. [1]
Analysis (3–4 marks):
Supply-side factors:
- COVID-19 lockdowns disrupted semiconductor manufacturing in key producing countries (e.g., South Korea, Taiwan, Malaysia), reducing the supply of semiconductors. The supply curve shifted left from S1 to S2. [1]
- The semiconductor industry has long lead times for expanding capacity (building new fabrication plants takes 2–3 years), making supply highly inelastic in the short run. [1]
Demand-side factors:
- The pandemic increased demand for consumer electronics (laptops, tablets, gaming consoles) as people worked and studied from home. The demand curve shifted right from D1 to D2. [1]
- The growth of 5G technology, electric vehicles, and AI applications further increased demand for semiconductors. [1]
Impact on price and quantity:
- The combined effect of a leftward shift in supply and a rightward shift in demand resulted in a significant increase in the equilibrium price of semiconductors and consumer electronics. [1]
- The effect on quantity is ambiguous (supply decrease reduces quantity, demand increase increases quantity), but in practice, the supply shock dominated, leading to shortages (excess demand at the original price) and reduced quantity available in the short run. [1]
<image_placeholder> id: Q8a-fig1 type: graph linked_question: Q8 description: A demand and supply diagram for the semiconductor market. The x-axis is labelled 'Quantity of semiconductors' and the y-axis is labelled 'Price of semiconductors ()′.Theinitialsupplycurve(S1)isupwardslopingandsteep(inelastic).Theinitialdemandcurve(D1)isdownwardsloping.Theinitialequilibriumisat(Q1,P1).S2isdrawntotheleftofS1(supplydecrease).D2isdrawntotherightofD1(demandincrease).Thenewequilibriumisat(Q2,P2),whereP2>P1andQ2<Q1.labels:S1,S2,D1,D2,P1,P2,Q1,Q2,x−axis:Quantityofsemiconductors,y−axis:Priceofsemiconductors() values: P1 = 10,P2=25, Q1 = 1,000, Q2 = 800 must_show: Two supply curves, two demand curves, two equilibrium points, clear indication that P2 > P1 and Q2 < Q1, all labels </image_placeholder>
Marking Scheme for (a):
| Level | Marks | Descriptor |
|---|---|---|
| Level 3 | 5–7 | Clear explanation of both supply and demand factors; accurate diagram; correct analysis of price and quantity effects. |
| Level 2 | 3–4 | Explanation of supply or demand factors (but not both); diagram with minor errors; partial analysis. |
| Level 1 | 1–2 | Basic understanding; no diagram; limited analysis. |
(b) Should Singapore subsidise its semiconductor industry? [8 marks]:
For subsidising:
-
Strategic importance: Semiconductors are a critical input for many industries (electronics, automotive, defence). Subsidising domestic production reduces reliance on imports and enhances supply chain resilience, which is especially important given geopolitical tensions (e.g., US-China tech rivalry). [2]
-
Positive externalities: The semiconductor industry generates significant positive externalities — skilled employment, technology spillovers to other industries, and knowledge transfer. The marginal social benefit exceeds the marginal private benefit, justifying government intervention. [1]
-
First-mover advantages and economies of scale: The semiconductor industry has high barriers to entry due to enormous capital requirements. Subsidies can help Singapore's firms achieve economies of scale and establish a competitive position in the global market. [1]
-
Singapore's existing strengths: Singapore already accounts for 11% of global semiconductor output. Subsidies could build on existing comparative advantage and attract further foreign direct investment. [1]
Against subsidising:
-
High opportunity cost: Subsidies are funded through taxation. The $1.5 billion (or more) spent on semiconductor subsidies could be used for other priorities such as healthcare, education, or social welfare. [1]
-
Risk of government failure: The government may not be the best judge of which semiconductor technologies to support. Subsidies may prop up inefficient firms or lead to misallocation of resources. [1]
-
Global overcapacity risk: Many countries (US, EU, China, South Korea, Japan) are simultaneously subsidising their semiconductor industries. This could lead to global overcapacity, falling prices, and wasted resources — a "subsidy war" that benefits no one. [1]
-
Market distortion: Subsidies may encourage firms to become dependent on government support, reducing incentives for innovation and cost efficiency (moral hazard). [1]
Judgement:
Singapore should selectively subsidise its semiconductor industry, focusing on areas where it has a comparative advantage (e.g., advanced packaging, niche chip design) rather than trying to compete across the entire value chain. Subsidies should be time-limited and conditional on performance (e.g., export targets, R&D investment) to reduce the risk of government failure. International cooperation to avoid a subsidy race would also be important. [1 mark for a clear, well-supported judgement]
Marking Scheme for (b):
| Level | Marks | Descriptor |
|---|---|---|
| Level 3 | 6–8 | Balanced discussion with at least 2–3 arguments on each side; clear economic reasoning; well-supported judgement that considers Singapore's specific context. |
| Level 2 | 3–5 | Some discussion of both sides but unbalanced; limited economic reasoning; weak judgement. |
| Level 1 | 1–2 | One-sided argument; no evaluation; descriptive. |
End of Answer Key
Mark Summary
| Question | Marks |
|---|---|
| Q1 | 2 |
| Q2 | 3 |
| Q3 | 4 |
| Q4 | 5 |
| Q5 | 6 |
| Section A Total | 20 |
| Q6 (a) | 7 |
| Q6 (b) | 8 |
| Q7 (a) | 7 |
| Q7 (b) | 8 |
| Q8 (a) | 7 |
| Q8 (b) | 8 |
| Section B Total | 30 |
| Grand Total | 50 |
Free quiz and exam paper access
Enter your details to view this paper
Your access is remembered on this device.