AI Generated Exam Paper
A Level H2 Economics Practice Paper 3
Free A Level H2 Econs Practice Paper 3, HY3 AI version, with questions, answers, and A Level-style practice for Singapore students.
These static practice materials are generated from the site's syllabus and paper-generation workflow, with source and model context shown so students and parents can evaluate the material before use.
Questions
Free quiz and exam paper access
Enter your details to view this paper
Your access is remembered on this device.
Answers
TuitionGoWhere Practice Paper - Economics H2 A-Level (Answers)
Version 3 of 5 — Answer Key
Total Marks: 60
Section A: Market Mechanism and Elasticity (21 marks)
Q1 [2 marks]
Signalling function: Price acts as a signal to producers and consumers. A rising price signals scarcity and encourages producers to increase supply while signalling consumers to reduce demand; a falling price signals surplus and encourages consumers to buy more and producers to supply less.
Marking: 1 mark for definition of signalling, 1 mark for example of price change effect.
Q2 [2 marks]
(a) Shift of the demand curve (income is a non-price determinant).
(b) Movement along the demand curve (own price change).
1 mark each.
Q3 [2 marks]
PED measures responsiveness of quantity demanded to a change in price. Formula:
1 mark definition, 1 mark formula.
Q4 [3 marks]
(elasticity of unity)
1 mark for each calculation step, 1 mark for final value. Note: ignore negative sign for magnitude but show it.
Q5 [2 marks]
YED = +2.5 → normal good (positive YED). Since >1, it is a luxury good (income elastic).
1 mark normal, 1 mark luxury.
Q6 [2 marks]
XED = –1.2 indicates X and Y are complements (negative cross elasticity). A 1% rise in price of Y leads to 1.2% fall in demand for X.
1 mark complement, 1 mark interpretation.
Q7 [3 marks]
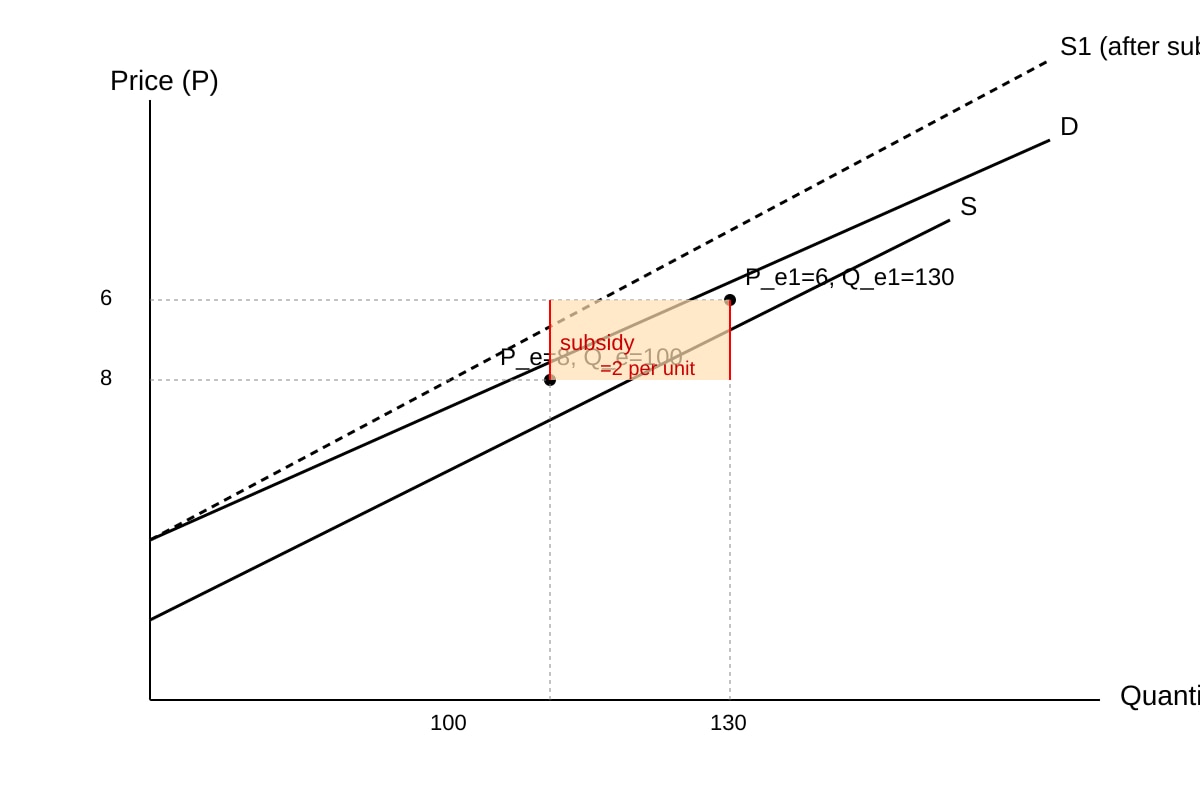
Diagram: subsidy shifts S to S1 right; P falls 6, Q rises 100→130. Consumer expenditure = P×Q = 8×100 = 800 initially; after = 6×130 = 780. Expenditure falls slightly despite higher quantity because price drop dominates.
1 mark diagram correct, 1 mark calculation, 1 mark explanation of net effect.
Section B: Government Intervention and Market Failure (18 marks)
Q8 [2 marks]
Maximum price: legally set ceiling below equilibrium to protect consumers. Minimum price: legally set floor above equilibrium to protect producers.
1 mark each.
Q9 [2 marks]
Max price below equilibrium → quantity demanded exceeds quantity supplied → shortage (excess demand). May lead to queues or black market.
1 mark shortage, 1 mark consequence.
Q10 [4 marks]
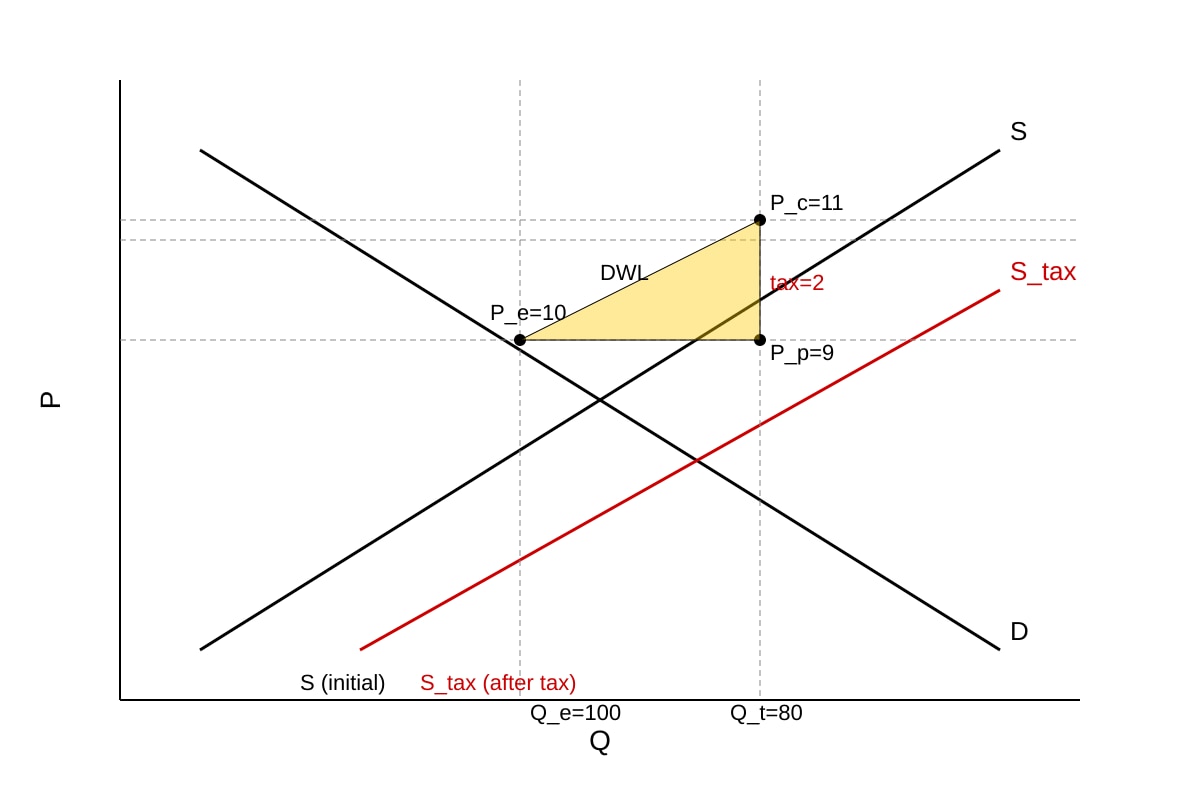
Diagram: tax shifts S left to S_tax; Q falls 100→80; consumers pay 11, producers get 9; DWL triangle shows lost mutual gains.
2 marks diagram, 2 marks explanation of DWL as efficiency loss.
Q11 [2 marks]
Negative externality (e.g. pollution) → private cost < social cost → overproduction relative to socially optimal level.
1 mark externality type, 1 mark effect.
Q12 [4 marks]
Tax corrects negative externality by internalising external cost; subsidy is for positive externalities. Subsidy on negative externality may increase output further, worsening failure. However subsidy to adopt clean tech can reduce externality at source. Evaluation: not always more effective; depends on externality type and behaviour.
2 marks analysis, 2 marks evaluation.
Q13 [4 marks]
At world price, domestic demand 120 > domestic supply + quota 50 → shortage. Domestic price rises above world price to equate domestic supply + 50 import to demand. Quantity traded = domestic supply + 50.
2 marks reasoning, 2 marks price/quantity outcome.
Section C: Firms and Decisions (21 marks)
Q14 [1 mark]
Profit maximisation where MR = MC and MC rising.
Q15 [4 marks]
TR = 100Q – 2Q² → MR = d(TR)/dQ = 100 – 4Q
TC = 20Q + 50 → MC = d(TC)/dQ = 20
Set MR = MC: 100 – 4Q = 20 → 4Q = 80 → Q = 20.
1 mark MR, 1 mark MC, 2 marks solving Q.
Q16 [2 marks]
Managers may satisfice due to separation of ownership and control (principal-agent), aiming for adequate profit to keep shareholders and workers content rather than max.
1 mark reason, 1 mark elaboration.
Q17 [2 marks]
Advertising, branding, product differentiation, customer service. (Any two)
1 mark each.
Q18 [5 marks]
Merger may reduce competition → higher price, lower CS. But efficiencies could lower cost and price; network effects may improve service; if market contestable, discipline remains. Evaluate: not necessarily reduces CS if gains passed to consumers.
2 marks analysis, 3 marks evaluation with balanced judgment.
Q19 [3 marks]
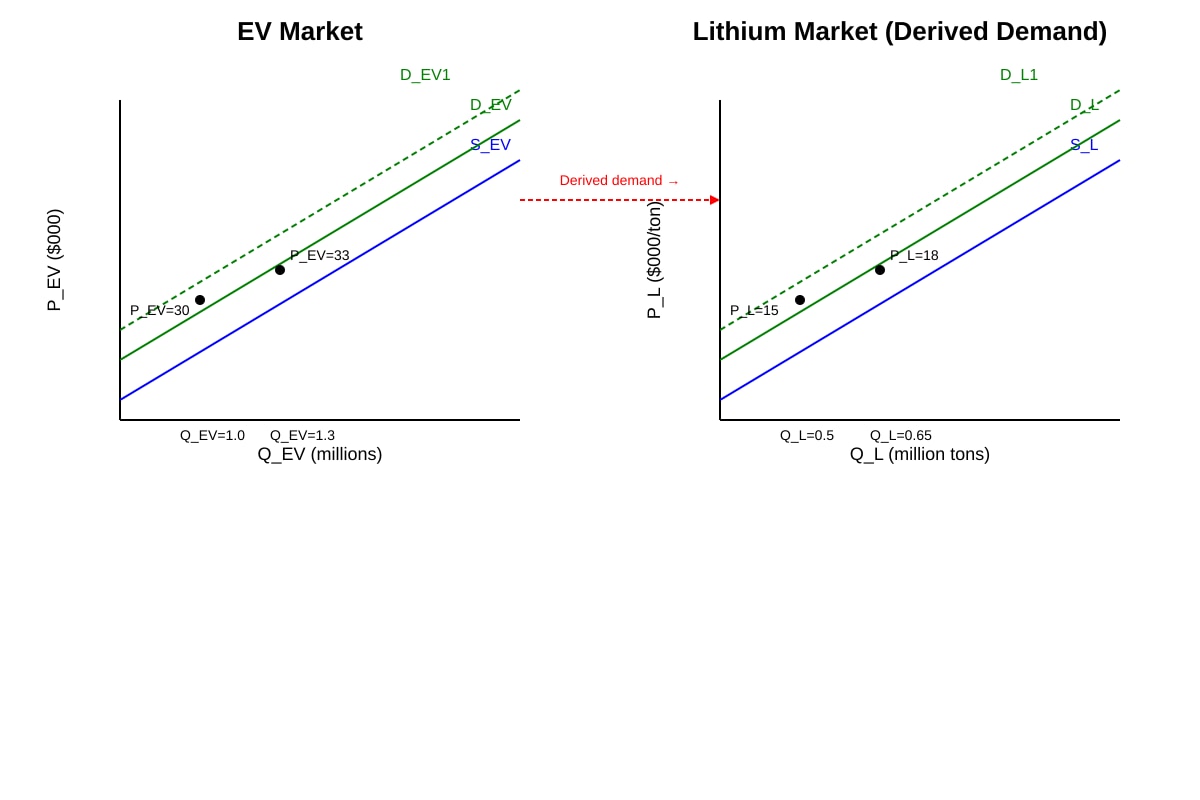
EV demand rise → derived demand for lithium rises → lithium P and Q increase. Diagram shows both shifts.
1 mark diagram, 2 marks explanation of derived demand chain.
Q20 [4 marks]
Price discrimination increases revenue if segments have different PED and arbitrage prevented. But may need complex segmentation; alternative is volume expansion. Not always best; depends on info and elasticity gap.
2 marks analysis, 2 marks evaluation.