AI Generated Exam Paper
A Level H2 Economics Practice Paper 2
Free A Level H2 Econs Practice Paper 2, HY3 AI version, with questions, answers, and A Level-style practice for Singapore students.
These static practice materials are generated from the site's syllabus and paper-generation workflow, with source and model context shown so students and parents can evaluate the material before use.
Questions
Free quiz and exam paper access
Enter your details to view this paper
Your access is remembered on this device.
Answers
TuitionGoWhere Practice Paper — Economics H2 A-Level (Version 2) Answer Key
Total Marks: 60
Section A: Market Mechanism and Elasticity (21 marks)
Q1 [2 marks]
- Signalling function: Prices act as signals to both consumers and producers about relative scarcity. (1 mark)
- A rise in price signals scarcity/profit opportunity, incentivising producers to increase supply and consumers to reduce demand. (1 mark) Teaching note: The price mechanism coordinates without central planning. Students often confuse signalling with rationing — signalling is about information, rationing is about allocation under shortage.
Q2 [3 marks] Midpoint formula: %ΔQ = (80–100)/((80+100)/2) = –20/90 = –22.22%; %ΔP = (5–4)/4.5 = 1/4.5 = 22.22%. PED = –22.22 / 22.22 = –1.0 (absolute value 1.0, unit elastic). (3 marks: 1 for Q change, 1 for P change, 1 for final) Common mistake: Using simple % (100→80 = –20%) without midpoint gives –1.0 here by chance but fails at other values.
Q3 [3 marks]
- Premium rice YED = –4% / 10% = –0.4 → inferior good (demand falls as income rises). (1.5 marks)
- Staple rice YED = +2% / 10% = +0.2 → normal good. (1.5 marks) Note: Negative YED defines inferior; positive defines normal. Premium rice is inferior in this context.
Q4 [2 marks]
- XED = %ΔQd of good A / %ΔP of good B. (1 mark)
- For substitutes, XED > 0 (positive sign). (1 mark)
Q5 [2 marks]
- %ΔQd = PED × %ΔP = 0.4 × (–10%) = –4% (demand falls 4%). (1 mark)
- %ΔQs = PES × %ΔP = 1.2 × (–10%) = –12% (supply falls 12%). (1 mark) Supply responds more strongly due to higher elasticity.
Q6 [3 marks]
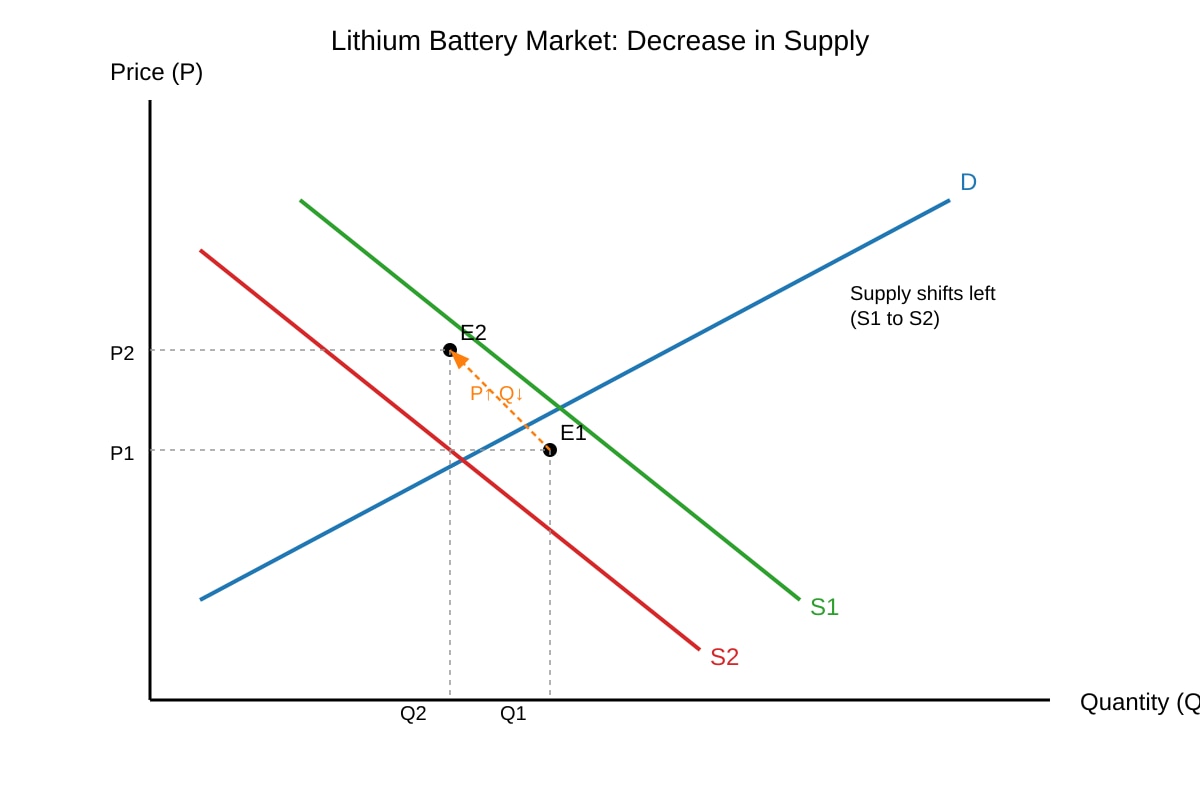
- Diagram shows D vertical? No: D downward sloping, S1 left to S2. (1 mark)
- New equilibrium E2: P↑, Q↓. (1 mark)
- Lithium is input; battery market supply falls, price rises, quantity falls. (1 mark) Expected visual: Leftward S shift, label P2> P1, Q2< Q1.
Q7 [3 marks]
- When price below equilibrium → excess demand (shortage). (1)
- Rising price rations goods to those willing/able to pay, quantity supplied rises. (1)
- Market reaches equilibrium, no persistent shortage without intervention. (1)
Section B: Government Intervention (18 marks)
Q8 [3 marks]
- Max price: legal ceiling below eq price (e.g. rent control). (1.5)
- Min price: legal floor above eq price (e.g. minimum wage). (1.5)
Q9 [3 marks]
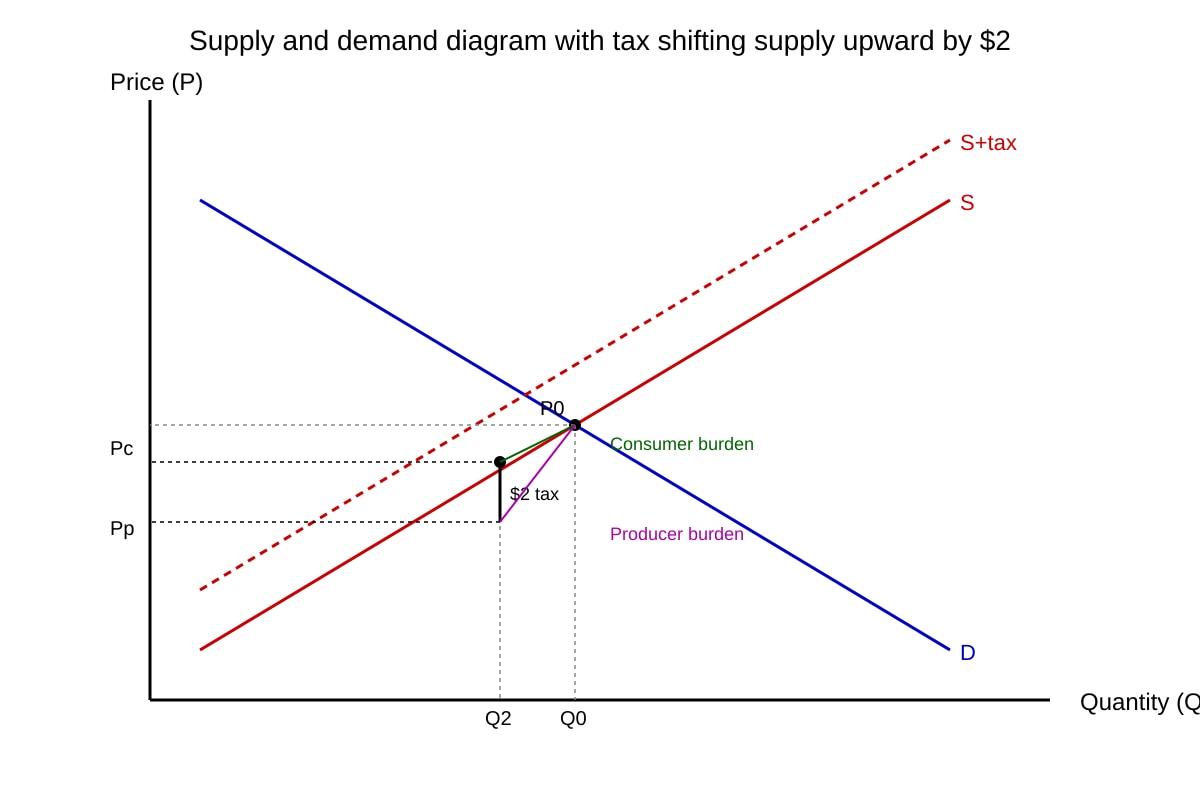
- Supply shifts up by $2 (S to S+tax). (1)
- New eq: Q↓, Pc (consumer) > P0, Pp (producer) < P0. (2) Visual: parallel shift, burden shared.
Q10 [3 marks]
- Inelastic demand: consumers bear more subsidy benefit as price drop small but Q unchanged much. (1.5)
- Elastic demand: larger Q response, producers receive more effective support. (1.5)
Q11 [3 marks]
- Shortage (excess demand) as Qd > Qs at ceiling. (1.5)
- Unintended: black market, deterioration of quality. (1.5)
Q12 [3 marks]
- Initial CE = 10×50 = 560. Rise of $60. (2)
- Outlay rose when price fell → demand inelastic (revenue inverse to price). (1)
Q13 [3 marks]
- Quota limits imports, helps domestic producers, may raise price. (1)
- Consumers face higher price, less choice → welfare may fall. (1)
- Not necessarily improvement; depends on externalities/infant industry. (1)
Section C: Firms and Market Structures (21 marks)
Q14 [3 marks]
- Condition: MR = MC. (1)
- MC rising ensures max not min profit (if MC falling, expanding raises profit). (2)
Q15 [2 marks]
- Advertising, branding, product differentiation. (1)
- Not price cuts, to build loyalty. (1)
Q16 [4 marks]
- High share 65% suggests dominance. (1)
- Exclusive contracts, barriers = monopoly power signs. (1.5)
- But contestable? Brand loyalty high → real power. (1.5) Descriptor: Identify 2+ features, evaluate context.
Q17 [4 marks] At P=14, Q = (30–14)/0.4 = 40. dQ/dP = –2.5. PED = –2.5 × (14/40) = –0.875. |PED|<1 inelastic. (3) Do NOT cut price; revenue falls. (1)
Q18 [3 marks]
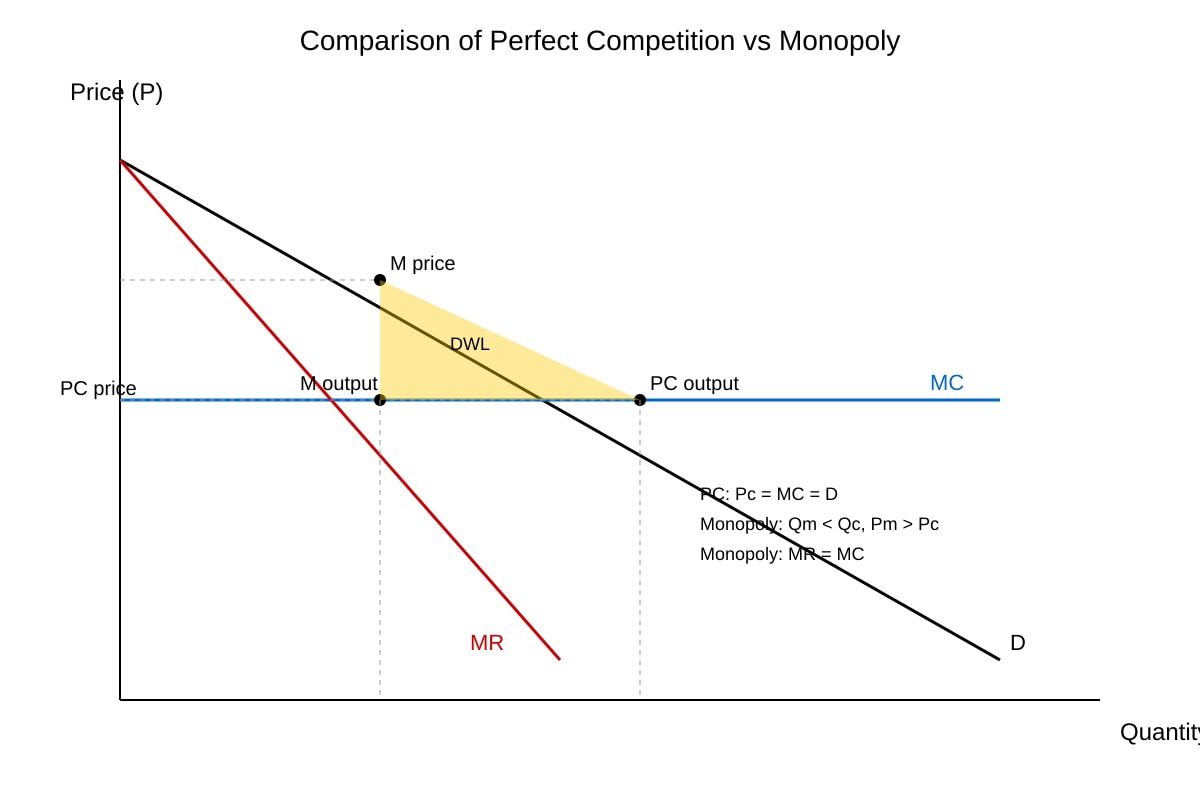
- PC: Pc=MC, Qc. Monopoly: MR=MC, Qm<Qc, Pm>Pc. (3) Visual: show MR, restricted output.
Q19 [3 marks]
- Satisficing: managers meet acceptable profit, avoid risk. (1)
- Large firms: separation ownership/management → realistic. (2)
Q20 [3 marks]
- Cinema charges different groups; fills seats, may raise producer surplus. (1)
- If allocative efficiency improves (empty seats used) welfare up. (1)
- But consumer surplus transfer; net ambiguous. (1)