AI Generated Exam Paper
A Level H2 Economics Practice Paper 1
Free A Level H2 Econs Practice Paper 1, LongCat AI version, with questions, answers, and A Level-style practice for Singapore students.
These static practice materials are generated from the site's syllabus and paper-generation workflow, with source and model context shown so students and parents can evaluate the material before use.
Questions
TuitionGoWhere Practice Paper - Economics H2 A-Level
TuitionGoWhere Practice Paper (AI)
Subject: Economics H2
Level: A-Level
Paper: Practice Paper 1 (Microeconomics)
Version: 1 of 5
Duration: 2 hours 15 minutes
Total Marks: 60
Name: ___________________________
Class: ___________________________
Date: ___________________________
Instructions
- Answer all questions in Section A and Section B.
- Answer one question from Section C.
- Write your answers in the spaces provided.
- The number of marks for each question or part-question is given in brackets [ ].
- Begin each section on a fresh page.
- You are advised to spend approximately:
- 45 minutes on Section A
- 45 minutes on Section B
- 45 minutes on Section C
- Credit will be given for the use of relevant economic analysis, diagrams, and examples.
Section A: Case Study (30 marks)
Read the following source material carefully and answer Questions 1–5.
Source A: Singapore's Ride-Hailing Market
Singapore's ride-hailing market has undergone significant transformation since the entry of Grab in 2013. By 2024, Grab commanded approximately 75% of the private-hail market share, while Gojek held around 15% and TADA held roughly 5%. The remaining 5% was split among smaller operators. The Land Transport Authority (LTA) reported that the total number of private-hail trips increased from 30 million in 2018 to 55 million in 2024.
Grab's dominance has been attributed to several factors: significant venture capital funding allowing sustained subsidies, a first-mover advantage in the Southeast Asian market, network effects that attract both drivers and riders, and a strategy of diversification into food delivery (GrabFood), financial services (GrabPay), and logistics. Grab's commission rate from drivers ranges from 20% to 25% per ride.
In 2023, Grab introduced a dynamic pricing algorithm that adjusts fares in real-time based on demand and supply conditions. During peak hours, fares can surge by up to 3.0 times the base fare. Consumer advocacy groups have raised concerns about price transparency and whether surge pricing disproportionately affects lower-income commuters.
Meanwhile, Gojek exited the Singapore market in early 2024, citing unsustainable losses and an inability to compete with Grab's scale. TADA, a Korean-backed operator, has adopted a zero-commission model for drivers, funded by advertising revenue, but has struggled to attract sufficient riders due to longer waiting times.
Table 1: Singapore Ride-Hailing Market Data (2024)
| Metric | Value |
|---|---|
| Grab market share | 75% |
| Gojek market share | 0% (exited) |
| TADA market share | 5% |
| Other operators | 20% |
| Total private-hail trips (2024) | 55 million |
| Average Grab fare (off-peak) | $12.50 |
| Average Grab fare (peak, surge 2.0x) | $25.00 |
| Grab driver commission rate | 20–25% |
| TADA driver commission rate | 0% |
| Consumer price index (transport), 2023–2024 | +4.2% |
Source B: Government Intervention in the Ride-Hailing Market
In response to concerns about Grab's market dominance, the Competition and Consumer Commission of Singapore (CCCS) conducted a review of the ride-hailing market in 2024. The review found that while Grab held a dominant position, the market remained contestable due to low barriers to entry for new operators and the availability of substitutes such as public transport, taxis, and private car ownership.
CCCS recommended the following measures:
- Price transparency requirements: All ride-hailing platforms must display the total fare (including surge multiplier) before a booking is confirmed.
- Data portability: Drivers must be allowed to switch platforms without losing their ratings and trip history.
- Commission cap consideration: A maximum commission rate of 20% was proposed but not yet implemented.
- Subsidy for new entrants: A one-year grant of up to $2 million for new ride-hailing operators to establish market presence.
The Ministry of Transport (MOT) responded that it would implement measures 1 and 2 immediately, study measure 3 further, and reject measure 4 on the grounds that direct subsidies could distort market competition.
Economists have debated the effectiveness of these interventions. Professor Tan of NUS argued that "the ride-hailing market exhibits natural monopoly characteristics due to network effects, and without regulation, consumer welfare will decline in the long run." In contrast, Dr. Lim of SMU countered that "government intervention risks reducing innovation and efficiency. The exit of Gojek was a market outcome, not a market failure."
Question 1
Using Source A, identify the market structure that best describes Singapore's ride-hailing market in 2024. Justify your answer with two characteristics from the source. [4]
Question 2
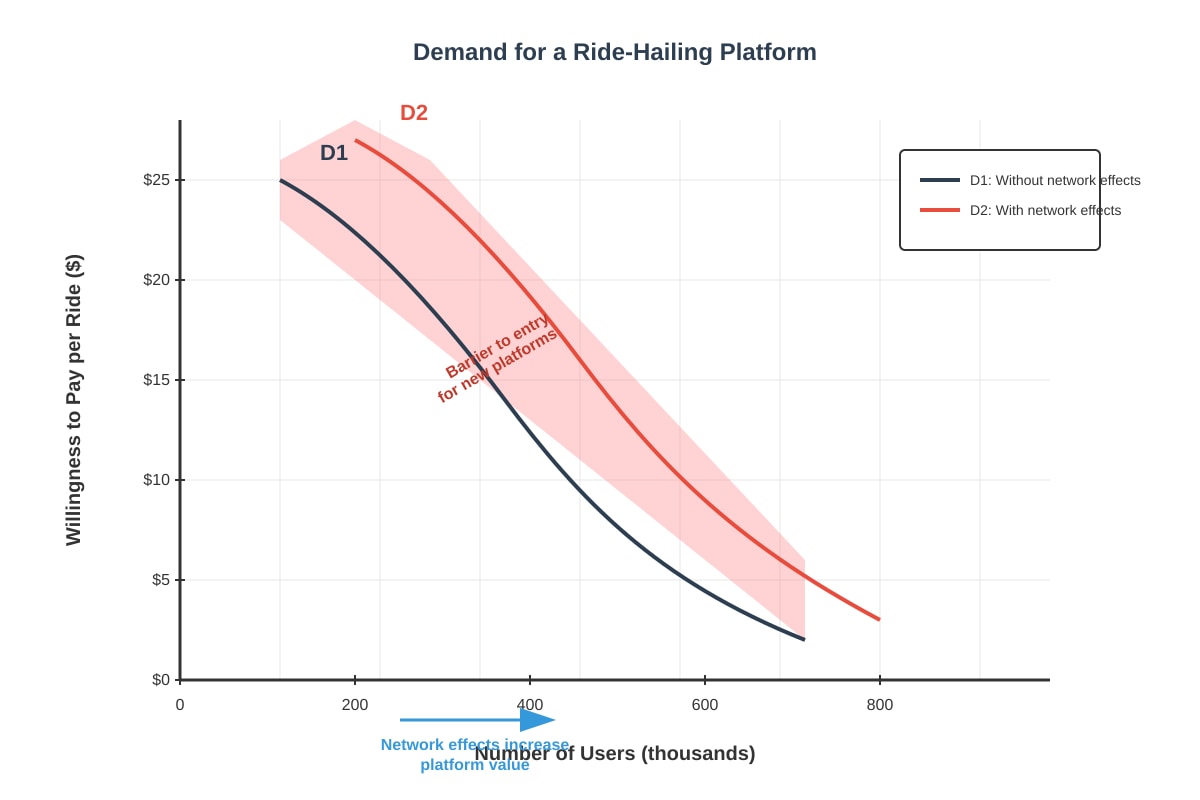
(a) Using a fully labelled diagram, explain how network effects can act as a barrier to entry in the ride-hailing market. [4]
Generated diagram for Q2a.
(b) Explain one reason why TADA's zero-commission model has failed to capture significant market share despite being attractive to drivers. [2]
Question 3
Using the data in Table 1, calculate the price elasticity of demand for Grab rides if a 10% increase in off-peak fares leads to a 15% decrease in the number of off-peak trips. State any assumption you make. [4]
Question 4
Using Sources A and B, analyse how the CCCS-recommended measures might affect both consumer welfare and producer welfare in the ride-hailing market. In your answer, refer to at least two specific measures from Source B. [8]
Question 5
Assess the view that government intervention in Singapore's ride-hailing market will necessarily improve economic efficiency. Use economic theory and evidence from the sources to support your answer. [10]
Section B: Structured Questions (15 marks)
Answer all questions in this section.
Question 6
Explain the difference between allocative efficiency and productive efficiency. Under what market structure(s) is each achieved in the long run? [5]
Question 7
A firm operating in a monopolistically competitive market is currently making supernormal profits.
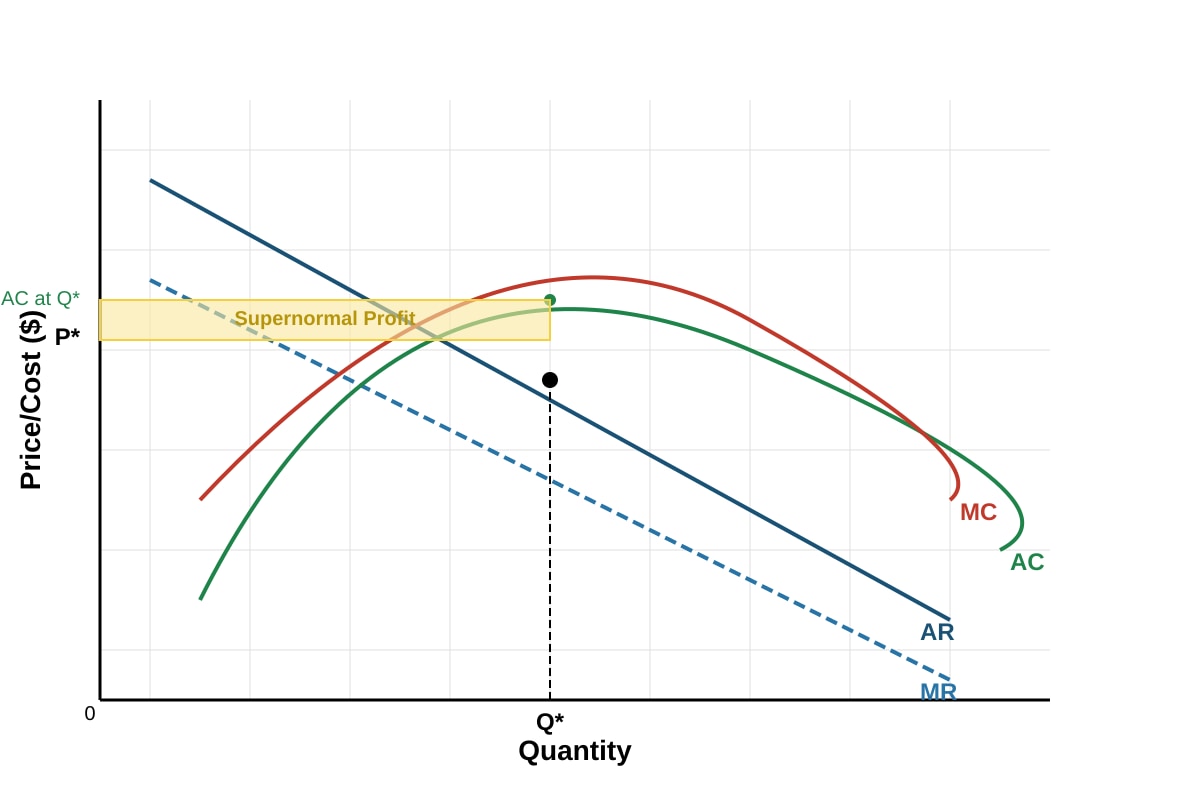
(a) Using a fully labelled diagram, show the short-run equilibrium of this firm. [3]
Generated diagram for Q7a.
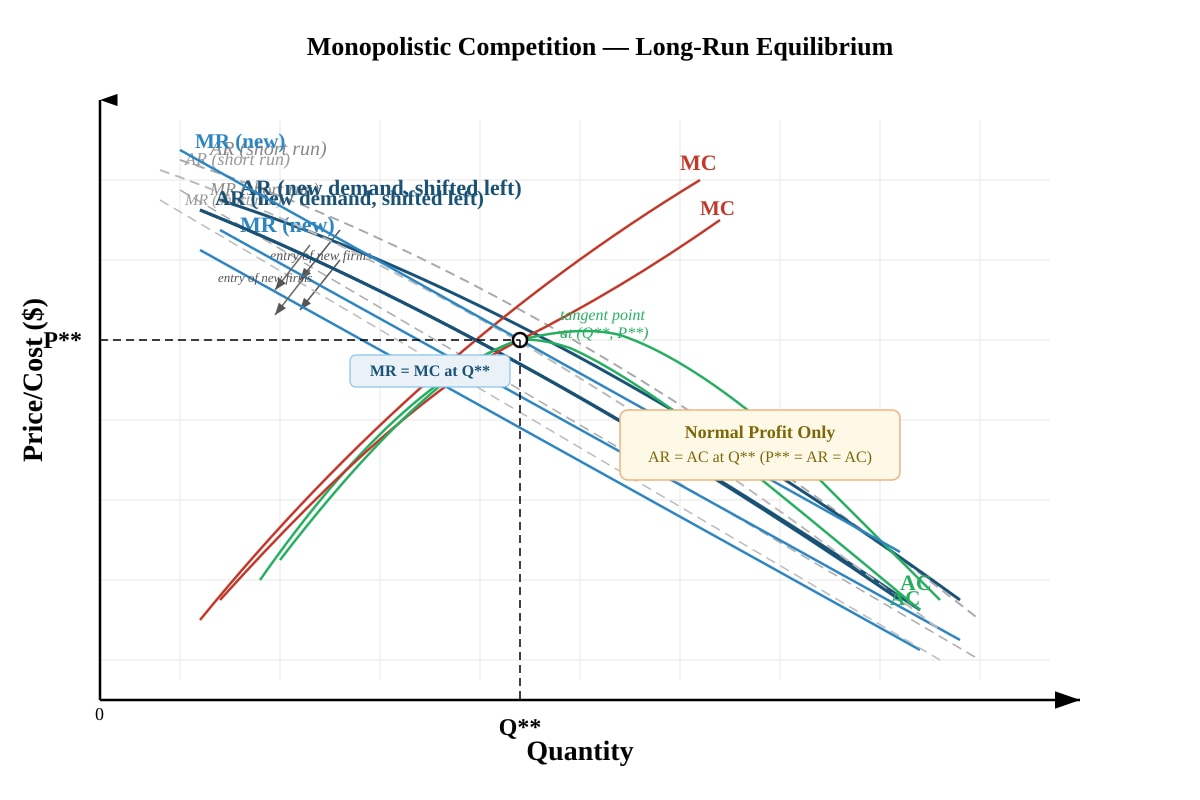
(b) Explain what happens to this firm's profits in the long run. Use a diagram to support your answer. [4]
Generated diagram for Q7b.
(c) Explain why monopolistically competitive firms engage in non-price competition. Give one example. [3]
Section C: Essay Questions (15 marks)
Answer ONE question from this section.
Question 8
"Market dominance by a single firm is always harmful to consumers and the economy."
Discuss this statement with reference to a market of your choice. In your answer, consider the potential benefits and costs of market dominance, and evaluate whether government intervention is justified. [15]
Question 9
Evaluate the effectiveness of taxes and subsidies as government tools to correct market failure arising from externalities. Use examples to illustrate your answer. [15]
End of Practice Paper
Answers
TuitionGoWhere Practice Paper — Economics H2 A-Level
Answer Key and Marking Scheme
Practice Paper 1 (Microeconomics) — Version 1 of 5
Section A: Case Study
Question 1 [4 marks]
Answer:
The market structure that best describes Singapore's ride-hailing market in 2024 is an oligopoly (or, more specifically, a dominant firm oligopoly / near-monopoly).
Justification with two characteristics from the source:
-
High market concentration / dominant firm: Source A states that Grab commands approximately 75% of the private-hail market share. This high concentration ratio is a key feature of an oligopoly, where a small number of firms dominate the market. With Gojek's exit, the market is even more concentrated, approaching a near-monopoly situation.
-
Barriers to entry: Source A mentions that Grab benefits from network effects, significant venture capital funding, and a first-mover advantage. These act as barriers to entry, preventing new firms from easily entering the market. TADA, despite its zero-commission model, has struggled to attract riders due to longer waiting times — illustrating the barrier created by Grab's established network. Barriers to entry are a defining characteristic of oligopoly.
Alternative acceptable answer: Students may argue for monopoly given Grab's 75% share and the exit of Gojek. This is acceptable if justified with reference to Grab's dominant position and the high barriers to entry described in the source.
Mark scheme:
- Correct identification of market structure: 1 mark
- First characteristic identified and linked to source: 1–2 marks (1 for identification, 1 for source reference)
- Second characteristic identified and linked to source: 1–2 marks
Common mistakes:
- Simply stating "oligopoly" without justification — no marks for identification alone.
- Citing characteristics not found in the source (e.g., "collusion") — not credited.
Question 2
(a) [4 marks]
Answer:
Network effects occur when the value of a product or service increases as more people use it. In the ride-hailing market, a platform with more riders attracts more drivers (shorter waiting times for drivers), and a platform with more drivers attracts more riders (shorter waiting times for riders). This creates a positive feedback loop.
Diagram explanation:
The diagram should show:
- D1: The demand curve for a ride-hailing platform without significant network effects — relatively elastic, as users can easily switch to alternatives.
- D2: The demand curve with network effects — shifted to the right and less elastic, because as more users join, the platform becomes more valuable (shorter wait times, better coverage), increasing users' willingness to pay and making them less likely to switch.
The rightward shift from D1 to D2 represents the additional value created by network effects. The shaded area between D1 and D2 represents the barrier to entry: a new entrant without an established user base cannot offer the same value, so users are unwilling to switch unless the new entrant offers a significantly lower price or superior service.
Mark scheme:
- Correct diagram with two demand curves, axes labelled: 1 mark
- Explanation of network effects: 1 mark
- Explanation of how network effects shift demand rightward: 1 mark
- Explanation of how this creates a barrier to entry: 1 mark
Common mistakes:
- Drawing a standard monopoly diagram instead of showing the shift due to network effects.
- Failing to label axes or curves.
(b) [2 marks]
Answer:
Despite TADA's zero-commission model being attractive to drivers, it has failed to capture significant market share because of network effects working in reverse. With fewer riders using the TADA platform, there are fewer drivers willing to join (or drivers spend more time idle between rides), which leads to longer waiting times for riders. This makes the platform unattractive to riders, creating a vicious cycle. Riders prefer Grab because it has a large pool of drivers, ensuring shorter waiting times and greater convenience.
Mark scheme:
- Identification of the problem (lack of riders/drivers leading to longer wait times): 1 mark
- Explanation of the vicious cycle / reverse network effect: 1 mark
Common mistakes:
- Simply restating that TADA has a small market share without explaining why.
- Not connecting the explanation to network effects.
Question 3 [4 marks]
Answer:
The price elasticity of demand (PED) measures the responsiveness of quantity demanded to a change in price.
Formula:
PED=% change in price% change in quantity demanded
Substitution:
PED=+10%−15%=−1.5
Interpretation: The PED is -1.5, which means demand for Grab off-peak rides is price elastic (|PED| > 1). A 10% increase in price leads to a proportionally larger (15%) decrease in the number of trips demanded.
Assumption: The ceteris paribus assumption holds — all other factors affecting demand (income, prices of substitutes, consumer preferences, weather, etc.) remain constant. In reality, this may not hold as commuters may switch to public transport or adjust their travel times.
Mark scheme:
- Correct formula stated or implied: 1 mark
- Correct substitution of values: 1 mark
- Correct final answer (-1.5): 1 mark
- Correct interpretation (elastic) and valid assumption: 1 mark
Common mistakes:
- Omitting the negative sign — PED for normal goods should be negative (law of demand).
- Confusing the numerator and denominator.
- Stating the answer as "1.5" without the negative sign — lose 1 mark.
Question 4 [8 marks]
Answer:
This question requires analysis of how CCCS measures affect consumer and producer welfare. A strong answer should address at least two measures and consider both consumer and producer perspectives.
Measure 1: Price transparency requirements
- Consumer welfare: Requiring platforms to display the total fare (including surge multiplier) before booking reduces information asymmetry. Consumers can make more informed decisions, compare prices across platforms, and avoid unexpectedly high fares. This increases consumer surplus and improves allocative efficiency.
- Producer welfare: Grab may see a reduction in revenue if consumers choose not to book during high-surge periods. However, greater transparency could also increase overall demand as consumers trust the platform more. The net effect on producer welfare is ambiguous.
Measure 2: Data portability for drivers
- Consumer welfare: If drivers can switch platforms without losing ratings, this increases competition among platforms for drivers. More drivers on multiple platforms could reduce waiting times and improve service quality, benefiting consumers.
- Producer welfare: Grab loses some of its competitive advantage from having an exclusive pool of highly-rated drivers. This could increase Grab's costs (needing to attract/retain drivers) and reduce its producer surplus. However, it could also incentivize Grab to improve its service to drivers.
Measure 3: Commission cap consideration (proposed 20%)
- Consumer welfare: A commission cap could lead to lower fares if platforms pass on the savings to consumers. However, if platforms reduce service quality or driver incentives, consumers may experience longer wait times or lower service standards.
- Producer welfare: Grab's revenue per ride would decrease, reducing producer surplus. Drivers might benefit from higher take-home earnings, but the platform may respond by reducing subsidies or incentives.
Mark scheme:
- Analysis of Measure 1 (price transparency) — consumer and producer effects: 2–3 marks
- Analysis of Measure 2 (data portability) or Measure 3 (commission cap) — consumer and producer effects: 2–3 marks
- Use of economic terminology (consumer surplus, producer surplus, information asymmetry, allocative efficiency): 1–2 marks
- Reference to source material: 1 mark
Level descriptors:
- 6–8 marks: Detailed analysis of at least two measures with clear reference to both consumer and producer welfare; uses economic terminology accurately; references source material.
- 3–5 marks: Analysis of at least one measure with some reference to consumer and/or producer welfare; limited use of economic terminology.
- 1–2 marks: Descriptive response with little economic analysis; may only address one stakeholder group.
Question 5 [10 marks]
Answer:
This is an evaluative essay question. Students must assess whether government intervention will necessarily improve economic efficiency, considering arguments for and against.
Introduction: Government intervention aims to correct market failure and improve economic efficiency. However, the word "necessarily" requires critical evaluation — intervention may not always improve efficiency and could even lead to government failure.
Arguments that intervention WILL improve efficiency:
-
Addressing market power / allocative inefficiency: Grab's 75% market share suggests it may have monopoly power. A monopolist restricts output and charges a price above marginal cost, leading to deadweight loss and allocative inefficiency. Price transparency requirements (Measure 1) can reduce information asymmetry, enabling consumers to make better choices and moving the market closer to the allocatively efficient outcome where P = MC.
-
Promoting competition: Data portability (Measure 2) reduces barriers to driver switching, making the market more contestable. Increased competition could drive down prices and improve service quality, moving the market closer to the competitive equilibrium and improving both allocative and productive efficiency.
-
Correcting information failure: Surge pricing without transparency represents an information failure. Consumers cannot make rational choices if they do not know the full price. Price transparency corrects this market failure, improving allocative efficiency.
Arguments that intervention may NOT improve efficiency (or could reduce it):
-
Government failure: The government may not have sufficient information to set optimal regulations. For example, a commission cap set too low could reduce Grab's incentive to invest in technology and service improvement, leading to dynamic inefficiency. The MOT's rejection of Measure 4 (subsidy for new entrants) reflects awareness that subsidies can distort competition.
-
Natural monopoly / efficiency gains from scale: Professor Tan's argument about natural monopoly characteristics suggests that having one dominant firm may actually be efficient due to network effects and economies of scale. Breaking up or heavily regulating Grab could destroy these efficiency gains, leading to higher average costs and productive inefficiency. Multiple small platforms would each have smaller networks, leading to longer waiting times and higher costs per ride.
-
Reduced innovation (dynamic efficiency): Dr. Lim's argument highlights that regulation may reduce the incentive for firms to innovate. Grab's dynamic pricing algorithm, while controversial, is an innovation that improves allocative efficiency by balancing supply and demand. Over-regulation could stifle such innovations.
-
Regulatory capture and compliance costs: Regulations impose compliance costs on firms, which may be passed on to consumers. Additionally, regulations may be influenced by the very firms they are meant to regulate (regulatory capture), reducing their effectiveness.
Evaluation / Conclusion: Government intervention is not guaranteed to improve economic efficiency. While price transparency and data portability are relatively low-cost measures likely to improve consumer welfare without significantly harming efficiency, more heavy-handed interventions (such as commission caps or subsidies) carry greater risks of government failure. The most effective approach may be light-touch regulation that addresses information failures and promotes contestability without undermining the efficiency benefits of scale and network effects. The appropriateness of intervention depends on the specific measure and the extent of market failure in the ride-hailing market.
Mark scheme (Level-based):
| Level | Marks | Descriptor |
|---|---|---|
| Level 4 | 9–10 | Well-structured argument with clear evaluation; considers both sides; uses economic theory (allocative efficiency, productive efficiency, dynamic efficiency, government failure, natural monopoly); references source material; reaches a reasoned conclusion. |
| Level 3 | 6–8 | Good analysis of both sides; uses some economic theory; references source material; may lack clear evaluation or conclusion. |
| Level 2 | 3–5 | One-sided or limited analysis; some economic content but largely descriptive; limited use of source material. |
| Level 1 | 1–2 | Basic response with little economic analysis; may be largely irrelevant. |
Common mistakes:
- Presenting only one side of the argument (only benefits or only costs of intervention).
- Failing to address the word "necessarily" — the question requires evaluation, not just analysis.
- Not referencing the source material.
- Confusing allocative, productive, and dynamic efficiency.
Section B: Structured Questions
Question 6 [5 marks]
Answer:
Allocative efficiency occurs when resources are allocated to produce the combination of goods and services that best matches society's preferences. It is achieved when P = MC (price equals marginal cost), meaning the value consumers place on the last unit produced (reflected in price) equals the cost of producing it. At this point, consumer surplus plus producer surplus is maximised, and there is no deadweight loss.
Productive efficiency occurs when firms produce at the lowest possible average cost, i.e., at the minimum point of the average cost curve (AC). This ensures that the given output is produced using the fewest resources possible.
Market structures:
-
Allocative efficiency is achieved in perfect competition in the long run. In perfect competition, firms are price takers and produce where P = MC. In the long run, entry and exit of firms drive price down to the minimum of AC, and P = MC = minimum AC.
-
Productive efficiency is also achieved in perfect competition in the long run, where firms produce at the minimum point of the AC curve (P = minimum AC).
-
In monopolistic competition, neither allocative nor productive efficiency is achieved in the long run. Firms produce where P > MC (allocative inefficiency) and at a quantity less than the minimum AC (productive inefficiency / excess capacity).
-
In olopoly and monopoly, firms typically produce where P > MC (allocative inefficiency) and may or may not produce at minimum AC (productive inefficiency is possible but not guaranteed, especially if the firm benefits from economies of scale).
Mark scheme:
- Definition of allocative efficiency: 1 mark
- Definition of productive efficiency: 1 mark
- Market structure for allocative efficiency (perfect competition) with explanation: 1–2 marks
- Market structure for productive efficiency (perfect competition) with explanation: 1 mark
Common mistakes:
- Confusing the two types of efficiency.
- Stating that monopoly achieves efficiency — it does not achieve allocative efficiency.
- Not explaining why P = MC is the condition for allocative efficiency.
Question 7
(a) [3 marks]
Answer:
The diagram for a monopolistically competitive firm making supernormal profits in the short run should show:
- Axes: Horizontal axis = Quantity; Vertical axis = Price/Cost ($)
- Curves: Downward-sloping AR (demand) curve (relatively elastic due to many substitutes); MR curve below AR; U-shaped AC curve; MC curve cutting AC at its minimum.
- Equilibrium: The firm produces at the profit-maximising output where MR = MC (quantity Q*).
- Price: The price P* is found by going up from Q* to the AR curve.
- Profit: At Q*, the AR (price) is above AC, so the firm makes supernormal profit. The supernormal profit per unit is (P* − AC at Q*), and total supernormal profit is the shaded rectangle: (P* − AC) × Q*.
Mark scheme:
- Correctly labelled diagram with AR, MR, MC, AC: 1 mark
- Equilibrium shown at MR = MC with Q* and P*: 1 mark
- Supernormal profit area correctly shaded: 1 mark
Common mistake:
- Drawing a perfectly competitive diagram (horizontal demand curve) — this is incorrect for monopolistic competition.
(b) [4 marks]
Answer:
In the long run, the supernormal profits earned in the short run attract new firms to enter the monopolistically competitive market. As new firms enter, the demand curve (AR) for each existing firm shifts to the left (and may become slightly more elastic) because consumers now have more substitutes to choose from. Each firm loses some of its market share.
This process continues until the AR curve is tangent to the AC curve at the profit-maximising output (where MR = MC). At this point:
- P = AR = AC → the firm earns only normal profit (zero economic profit).
- P > MC → allocative efficiency is not achieved.
- The output is less than the output at minimum AC → excess capacity exists, meaning productive efficiency is not achieved.
The firm in long-run equilibrium produces at Q** where MR = MC, charges price P** from the AR curve, and P** = AC at Q**, so there is no supernormal profit.
Mark scheme:
- Explanation of new entry shifting AR left: 1 mark
- Explanation of long-run equilibrium (AR tangent to AC, normal profit): 1 mark
- Correct diagram showing tangency and normal profit: 1 mark
- Mention of allocative and/or productive inefficiency: 1 mark
(c) [3 marks]
Answer:
Monopolistically competitive firms engage in non-price competition because:
-
Product differentiation: In monopolistic competition, firms sell differentiated products. Since products are not identical, firms compete not just on price but through advertising, branding, quality improvements, customer service, and product features. This allows firms to shift their demand curve to the right and make it less elastic, enabling them to charge a higher price without losing all customers.
-
Avoiding price wars: If firms compete on price alone, they may engage in a price war that erodes all profits. Non-price competition allows firms to maintain or increase market share while preserving profit margins.
Example: Coffee shops in Singapore (e.g., Starbucks, local cafés) compete through ambiance, loyalty programmes, menu variety, and store location rather than just price. A café might introduce a mobile ordering app, offer free Wi-Fi, or create Instagram-worthy interiors to attract customers — all forms of non-price competition.
Mark scheme:
- Explanation of why non-price competition occurs (product differentiation / avoiding price wars): 2 marks
- Relevant example: 1 mark
Common mistake:
- Giving a price competition example (e.g., discounts, sales) instead of non-price competition.
Section C: Essay Questions
Question 8 [15 marks]
"Market dominance by a single firm is always harmful to consumers and the economy." Discuss.
Suggested answer structure:
Introduction: Define market dominance (a firm with significant market power, typically >40% market share). State that the word "always" requires evaluation — market dominance can have both costs and benefits.
Arguments that market dominance IS harmful:
-
Allocative inefficiency: A dominant firm with monopoly power restricts output and charges P > MC, leading to deadweight loss. Consumers pay higher prices and consume less than the socially optimal quantity. Example: If Grab charges fares significantly above marginal cost, consumers are worse off.
-
Reduced consumer surplus: Higher prices transfer surplus from consumers to the firm (producer). Consumer choice may also be limited if the dominant firm faces little competitive pressure to innovate or improve service.
-
Barriers to entry: A dominant firm may engage in predatory pricing or leverage network effects to prevent new entrants, reducing long-run competition and innovation.
-
X-inefficiency: Without competitive pressure, a dominant firm may become complacent, leading to higher costs and waste (X-inefficiency).
Arguments that market dominance may NOT be harmful (or may be beneficial):
-
Economies of scale: A dominant firm may achieve significant economies of scale, lowering average costs. If these cost savings are passed on to consumers (lower prices), consumers may actually be better off than under a more fragmented market. Example: Grab's large scale allows it to invest in technology (dynamic pricing, app features) that smaller firms cannot afford.
-
Dynamic efficiency: A dominant firm earning supernormal profits may reinvest in R&D and innovation, leading to better products and services over time. Schumpeterian creative destruction suggests that temporary monopoly profits are the reward for innovation.
-
Network effects and consumer benefit: In markets with network effects (e.g., ride-hailing, social media), having one dominant platform may actually benefit consumers because the platform's value increases with more users. Fragmenting the market across many small platforms could reduce the value for all users.
-
Natural monopoly: In some markets, having a single firm is the most efficient outcome due to very high fixed costs and low marginal costs. Duplicating infrastructure would be wasteful.
Evaluation: Whether market dominance is harmful depends on:
- The contestability of the market (can new firms enter?)
- Whether the dominant firm passes on efficiency gains to consumers
- The regulatory framework in place
- The time horizon (short-run vs. long-run effects)
- The nature of the market (does it have network effects? economies of scale?)
The word "always" is too absolute. Market dominance can be harmful if the firm abuses its position, but it can also bring efficiency benefits. Government intervention should be targeted at preventing abuse of market power rather than breaking up dominant firms per se.
Mark scheme (Level-based):
| Level | Marks | Descriptor |
|---|---|---|
| Level 5 | 13–15 | Comprehensive discussion with clear evaluation; considers both benefits and costs of market dominance; uses relevant economic theory (allocative efficiency, economies of scale, dynamic efficiency, natural monopoly, contestability); provides real-world examples; reaches a well-reasoned conclusion addressing "always." |
| Level 4 | 10–12 | Good analysis of both sides; uses economic theory; provides examples; some evaluation but may not fully address "always." |
| Level 3 | 7–9 | Reasonable analysis but may be one-sided or lack depth; limited use of economic theory; weak evaluation. |
| Level 2 | 4–6 | Descriptive response with limited economic analysis; may not address the question directly. |
| Level 1 | 1–3 | Basic response with little relevant economic content. |
Question 9 [15 marks]
Evaluate the effectiveness of taxes and subsidies as government tools to correct market failure arising from externalities.
Suggested answer structure:
Introduction: Define externalities (positive and negative) and explain that they lead to market failure because the market equilibrium does not account for external costs or benefits. Taxes and subsidies are Pigouvian solutions to internalise externalities.
Taxes to correct negative externalities:
-
Theory: A negative externality (e.g., pollution) means that the marginal social cost (MSC) exceeds the marginal private cost (MPC). The market overproduces the good (Qm > Qs). A Pigouvian tax equal to the marginal external cost (MEC) shifts the supply curve leftward (from MPC to MSC), reducing output to the socially optimal level (Qs) and raising the price to reflect the true social cost.
-
Example: Carbon taxes on emissions, tobacco taxes, congestion charges (Singapore's ERP system).
-
Effectiveness:
- Advantages: Internalises the externality; generates government revenue; incentivises firms to adopt cleaner technology.
- Limitations: Difficult to measure the exact MEC — if the tax is set too low, overproduction continues; if too high, it may cause unnecessary economic hardship. Regressive impact (tobacco taxes fall disproportionately on lower-income groups). May lead to tax evasion or relocation of firms to countries with lower taxes (carbon leakage).
Subsidies to correct positive externalities:
-
Theory: A positive externality (e.g., education, vaccination) means that the marginal social benefit (MSB) exceeds the marginal private benefit (MPB). The market underproduces the good (Qm < Qs). A subsidy equal to the marginal external benefit (MEB) shifts the demand curve rightward (from MPB to MSB), increasing output to the socially optimal level (Qs).
-
Example: Government subsidies for education, renewable energy, public transport, healthcare.
-
Effectiveness:
- Advantages: Encourages consumption/production of merit goods; can be targeted at specific groups; politically popular.
- Limitations: Cost to government (opportunity cost — the subsidy must be funded through taxation or borrowing). Difficulty in measuring MEB accurately. May create dependency or inefficiency (firms may become reliant on subsidies). Risk of government failure (subsidising the wrong goods or setting the wrong level).
Evaluation:
- Measurement problem: Both taxes and subsidies require accurate measurement of external costs/benefits, which is often difficult in practice. This can lead to under- or over-correction.
- Comparison with other policies: Tradable permits (cap-and-trade) may be more effective than taxes for pollution because they set a definite quantity limit. Regulation (e.g., emission standards) may be simpler to enforce but less efficient.
- Political feasibility: Taxes are often unpopular, while subsidies are popular but expensive. The choice between them may depend on political considerations rather than economic efficiency.
- Context matters: The effectiveness depends on the elasticity of demand/supply, the ability to measure externalities, and the institutional capacity to implement and enforce the policy.
Conclusion: Taxes and subsidies can be effective in correcting market failure from externalities in theory, but their practical effectiveness depends on accurate measurement, appropriate implementation, and consideration of unintended consequences. They are most effective when combined with other policies and when the government has good information about the size of the externality.
Mark scheme (Level-based):
| Level | Marks | Descriptor |
|---|---|---|
| Level 5 | 13–15 | Comprehensive evaluation of both taxes and subsidies; uses economic theory (MSC, MPC, MSB, MPB, Pigouvian tax/subsidy); includes diagrams or clear diagrammatic reasoning; provides real-world examples; discusses limitations and compares with alternative policies; reaches a reasoned conclusion. |
| Level 4 | 10–12 | Good analysis of both taxes and subsidies; uses economic theory; provides examples; discusses some limitations; may lack comparison with alternatives. |
| Level 3 | 7–9 | Reasonable analysis of at least one tool; some economic theory; limited evaluation. |
| Level 2 | 4–6 | Descriptive response with limited economic analysis; may only discuss taxes or subsidies, not both. |
| Level 1 | 1–3 | Basic response with little relevant economic content. |
End of Answer Key
Free quiz and exam paper access
Enter your details to view this paper
Your access is remembered on this device.