AI Generated Exam Paper
A Level H2 Economics Practice Paper 1
Free A Level H2 Econs Practice Paper 1, HY3 AI version, with questions, answers, and A Level-style practice for Singapore students.
These static practice materials are generated from the site's syllabus and paper-generation workflow, with source and model context shown so students and parents can evaluate the material before use.
Questions

Free quiz and exam paper access
Enter your details to view this paper
Your access is remembered on this device.
Answers
TuitionGoWhere Practice Paper - Economics H2 A-Level (Answers)
Version 1 of 5 — Answer Key
Section A: Market Mechanism and Elasticity (21 marks)
1. [2 marks]
Signalling function: Price acts as a signal to producers and consumers. High price signals scarcity and encourages producers to increase supply; low price signals surplus and encourages consumers to buy more.
Marking: 1 mark for definition, 1 mark for example of effect.
2. [2 marks]
(a) Shift of demand curve (rightward for normal good as income rises).
(b) Movement along demand curve (extension in quantity demanded when own price falls).
1 mark each.
3. [3 marks]
% change in price = (5-4)/4 × 100 = 25%.
% change in Qd = (80-100)/100 × 100 = -20%.
PED = -20% / 25% = -0.8 (elasticity magnitude 0.8).
1 mark for each step, final answer -0.8.
4. [4 marks]
Subsidy lowers cost of production → S shifts right → equilibrium price falls, quantity rises. Diagram shows S to S_sub rightward, P down, Q up.
2 marks diagram, 2 marks explanation.
5. [2 marks]
YED = -5% / 10% = -0.5. Type: inferior good (negative YED).
1 mark calc, 1 mark type.
6. [3 marks]
XED = 10% / 20% = 0.5. Positive XED → substitutes.
1 mark calc, 2 marks interpretation.
7. [5 marks]
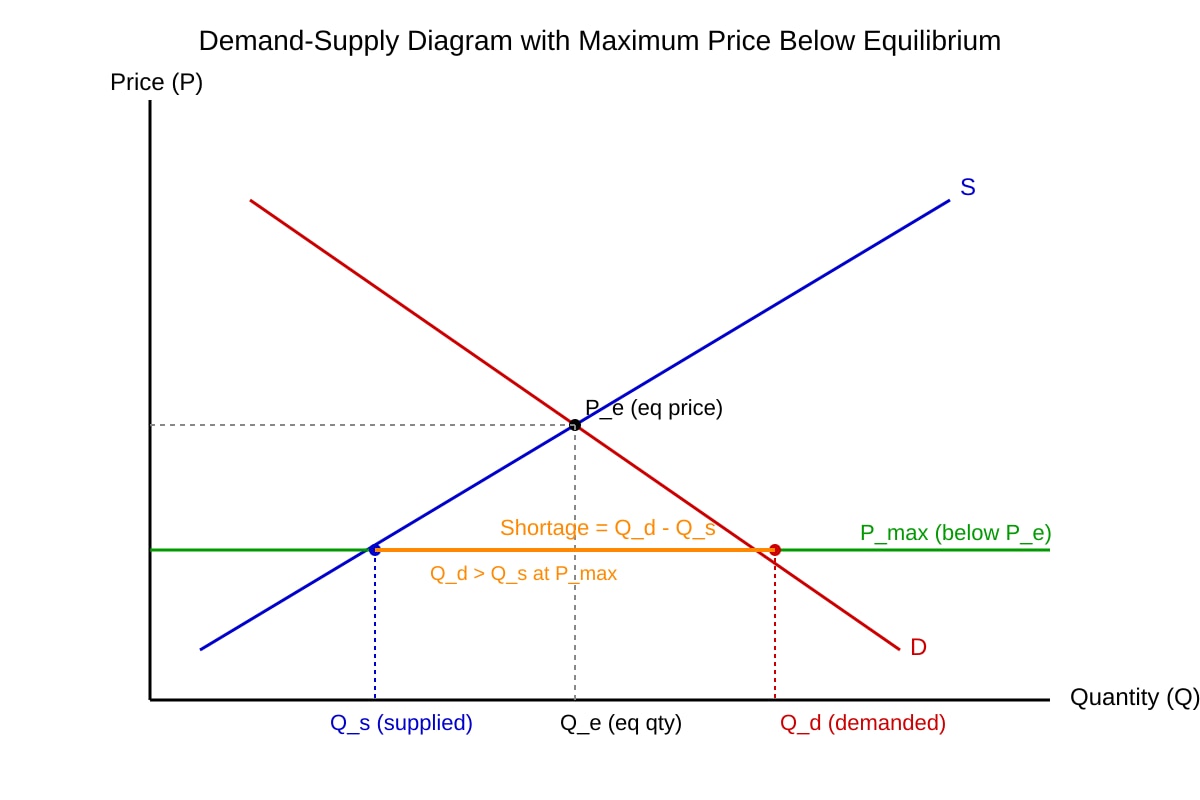
Max price below P_e → Qd > Qs → shortage. Diagram shows P_max line, gap Qd-Qs.
2 marks diagram, 3 marks explanation.
Section B: Firm Behaviour (18 marks)
8. [2 marks]
Profit = TR - TC. Profit max where MR = MC and MC rising.
1 mark each.
9. [4 marks]
MR = d(TR)/dQ = 100 - 4Q. MC = d(TC)/dQ = 20.
Set MR = MC: 100 - 4Q = 20 → 4Q = 80 → Q = 20.
2 marks derivatives, 2 marks solving.
10. [2 marks]
Reasons: (1) Lack of info to maximise profit; (2) Managerial utility / quiet life preference.
1 mark each.
11. [2 marks]
Advertising, branding, product differentiation, service quality.
Any two, 1 mark each.
12. [2 marks]
Condition: market separation (no arbitrage). Explanation: different groups cannot resell.
1 mark condition, 1 mark explain.
13. [6 marks]
Oligopoly: few firms (two), high barriers (network cost), interdependent pricing (match promos).
2 marks each point.
Section C: Intervention (21 marks)
14. [2 marks]
Tax: shifts S left (per-unit). Quota: limits Qs, vertical supply segment.
1 mark each.
15. [4 marks]
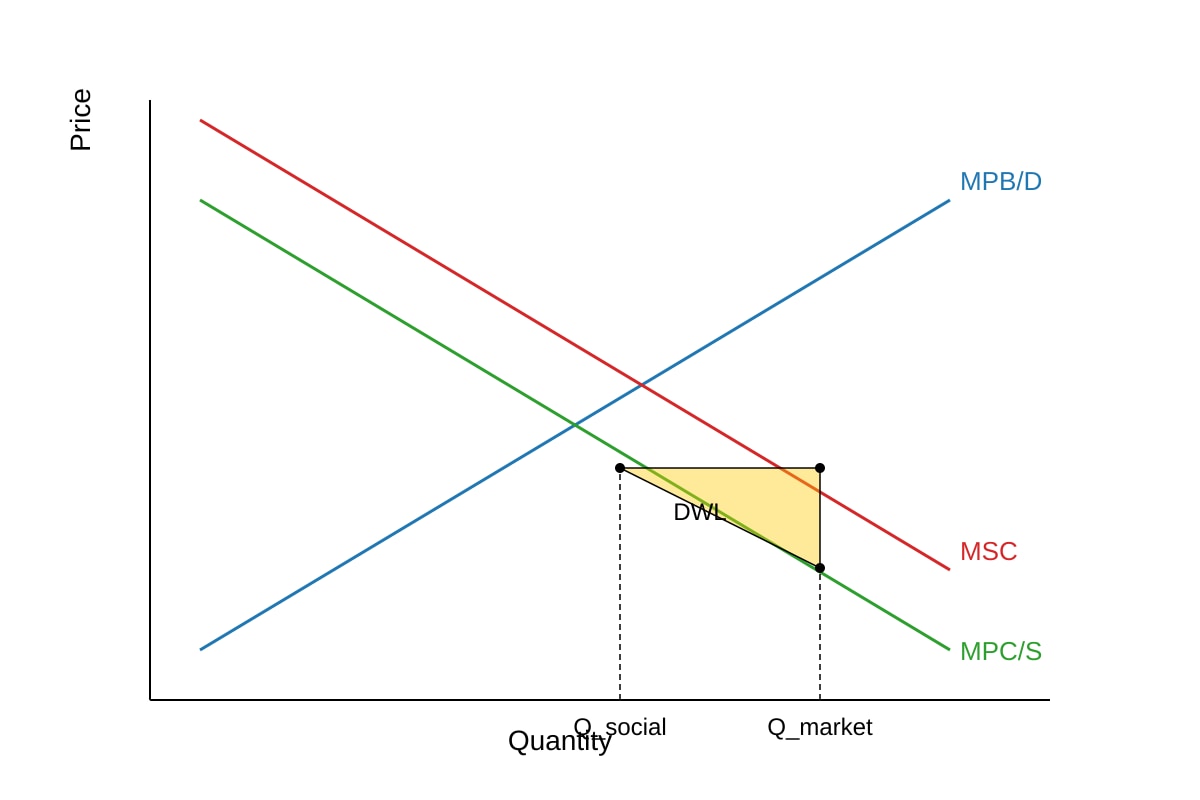
Diagram: MSC > MPC, Q_market > Q_social, DWL triangle.
2 diagram, 2 explain.
16. [4 marks]
Not always: if demand inelastic, tax may raise price little, CS may fall less; govt gains. But generally CS falls. Evaluate with elasticity.
2 marks claim, 2 marks reasoning.
17. [4 marks]
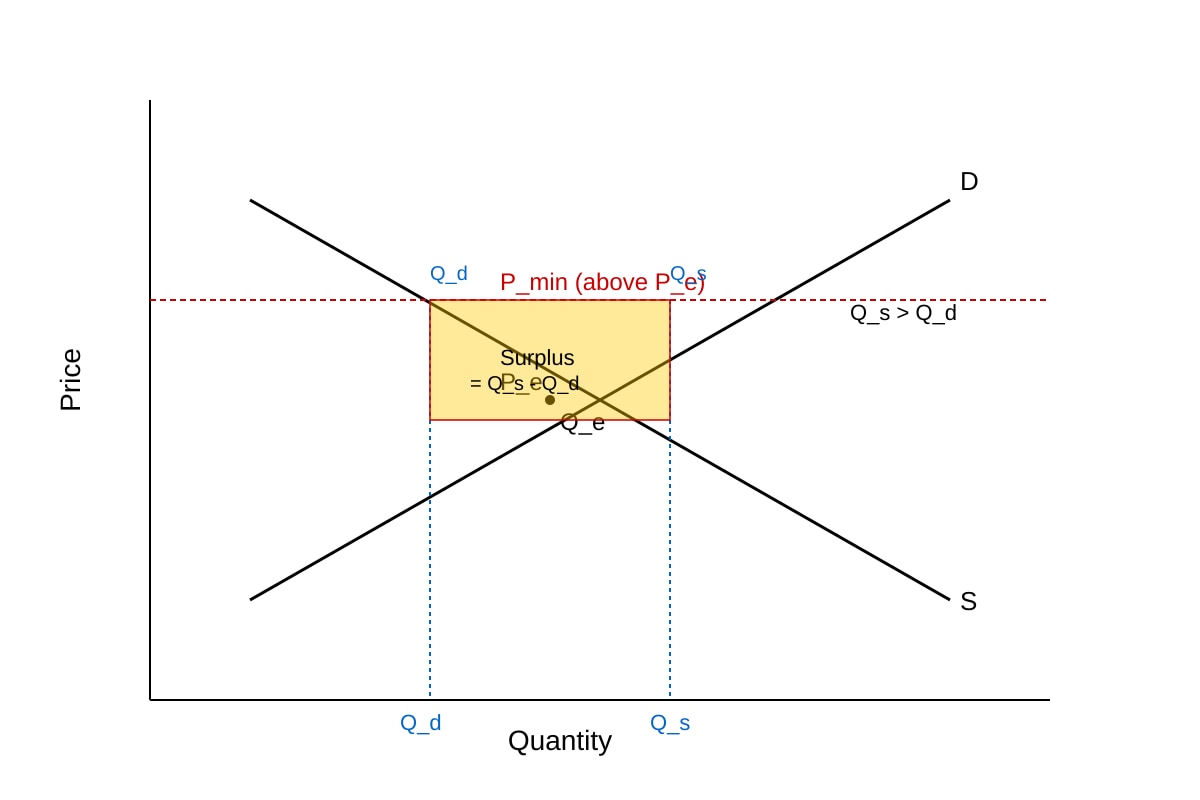
Min price above P_e → Qs > Qd → surplus. Diagram shows gap.
2 diagram, 2 explain.
18. [5 marks]
May lower price (regulation) but risk inefficiency, reduced innovation. Balanced judgment.
Marking descriptors: 2 analysis, 3 evaluation.
19. [4 marks]
Consumer choice affects demand, but market failure (externality, info gap) limits impact. Need systemic policy.
2 points, 2 eval.
20. [8 marks]
High share, network effects, barriers → monopoly-like. But contestable, low switch cost → regulation targeted not breakup.
4 analysis, 4 evaluation.