From Real Exams Exam Paper
A Level H2 Economics Practice Paper 5
Free A Level H2 Econs Practice Paper 5, LongCat Exam version, with questions, answers, and A Level-style practice for Singapore students.
These static practice materials are generated from the site's syllabus and paper-generation workflow, with source and model context shown so students and parents can evaluate the material before use.
Questions
TuitionGoWhere Practice Paper - Economics H2 A-Level
TuitionGoWhere Secondary School (AI)
| Subject: | Economics H2 |
| Level: | A-Level |
| Paper: | Practice Paper — Microeconomics (Paper 1 Style) |
| Version: | 5 of 5 |
| Duration: | 2 hours 15 minutes |
| Total Marks: | 60 |
| Name: | ______________________________ |
| Class: | ______________________________ |
| Date: | ______________________________ |
Instructions
- Answer all questions in Section A and Section B.
- Write your answers in the spaces provided.
- The number of marks for each question or part-question is given in brackets [ ].
- Begin each section on a fresh page.
- The use of an approved calculator is allowed.
- You are advised to spend approximately 45 minutes on Section A and 90 minutes on Section B.
Section A: Case Study (30 marks)
Read the following source material carefully and answer Questions 1–6.
Source A: The Singapore Ride-Hailing Market
The ride-hailing market in Singapore has undergone significant consolidation since 2018. Grab Holdings, which acquired Uber's Southeast Asian operations in 2018, now commands approximately 80% of the private-hire car market. In 2023, Grab announced its proposed acquisition of Trans-cab, one of Singapore's traditional taxi operators with a fleet of over 2,600 taxis. The Competition and Consumer Commission of Singapore (CCCS) conducted a review of the proposed acquisition.
Prior to the acquisition, the market was characterised by the following features:
| Firm | Estimated Market Share (2022) | Pricing Model |
|---|---|---|
| Grab | 78% | Dynamic surge pricing |
| Gojek | 12% | Dynamic surge pricing |
| TADA | 5% | Fixed-rate pricing |
| Trans-cab (taxi) | 3% | Metered fare + surcharges |
| ComfortDelGro (taxi) | 2% | Metered fare + surcharges |
Source A (cont'd):
Industry analysts noted that Grab's surge pricing algorithm adjusts fares in real-time based on demand and supply conditions. During peak hours, fares can increase by up to 3.8 times the base fare. A 2022 survey by the Singapore Consumer Association found that 67% of respondents felt that surge pricing was "excessive," while 23% considered it "acceptable given market conditions."
Following the Uber acquisition, Grab introduced a loyalty programme called "GrabRewards," which offers tiered benefits including priority booking and fare discounts. Critics argue that such programmes increase switching costs for consumers and create barriers to entry for potential competitors.
The Land Transport Authority (LTA) reported that the total number of private-hire vehicle trips increased from 48 million in 2019 to 72 million in 2023, while traditional taxi trips declined from 55 million to 31 million over the same period.
Source B: Government Intervention in the Electricity Market
Singapore's electricity market was fully liberalised in 2019, allowing households to purchase electricity from retailers at competitive rates or remain with SP Group at the regulated tariff. As of 2024, there are 12 licensed electricity retailers offering various pricing plans.
In 2022, global energy prices surged due to supply chain disruptions and the Russia-Ukraine conflict. The regulated electricity tariff increased from 0.23/kWhinQ12021to0.33/kWh in Q4 2022 — a 43.5% increase. Several electricity retailers exited the market, and the number of available retail plans fell from 48 to 22.
The Energy Market Authority (EMA) responded by introducing a Temporary Price Cap mechanism in January 2023, capping retail electricity prices at 120% of the regulated tariff. EMA stated that this measure was necessary to "protect consumers during a period of exceptional market volatility" while preserving the long-term benefits of market competition.
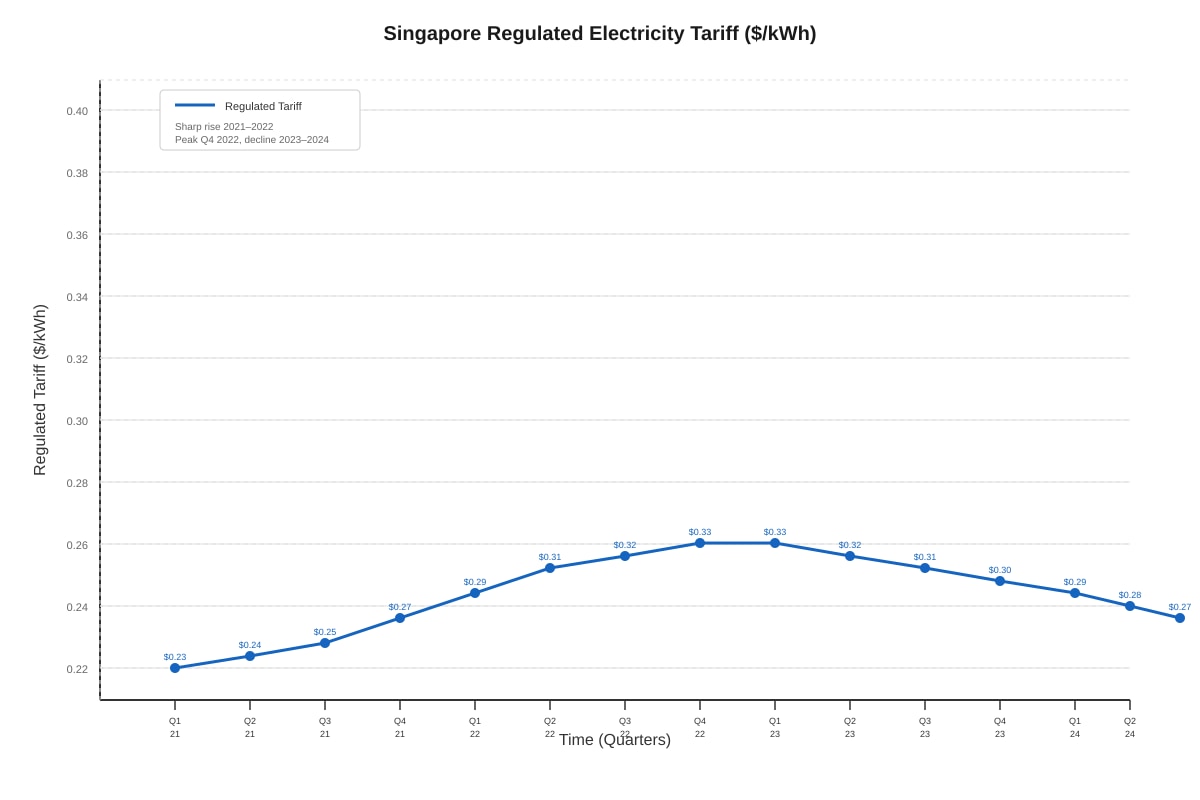
Generated graph for Q3.
Question 1
Using Source A, identify the type of market structure that best describes the Singapore ride-hailing market after Grab's acquisition of Uber. Justify your answer with two characteristics from the source.
[4 marks]
Question 2
(a) Using a fully labelled diagram, explain how Grab's surge pricing algorithm determines the price consumers pay during peak hours.
[4 marks]
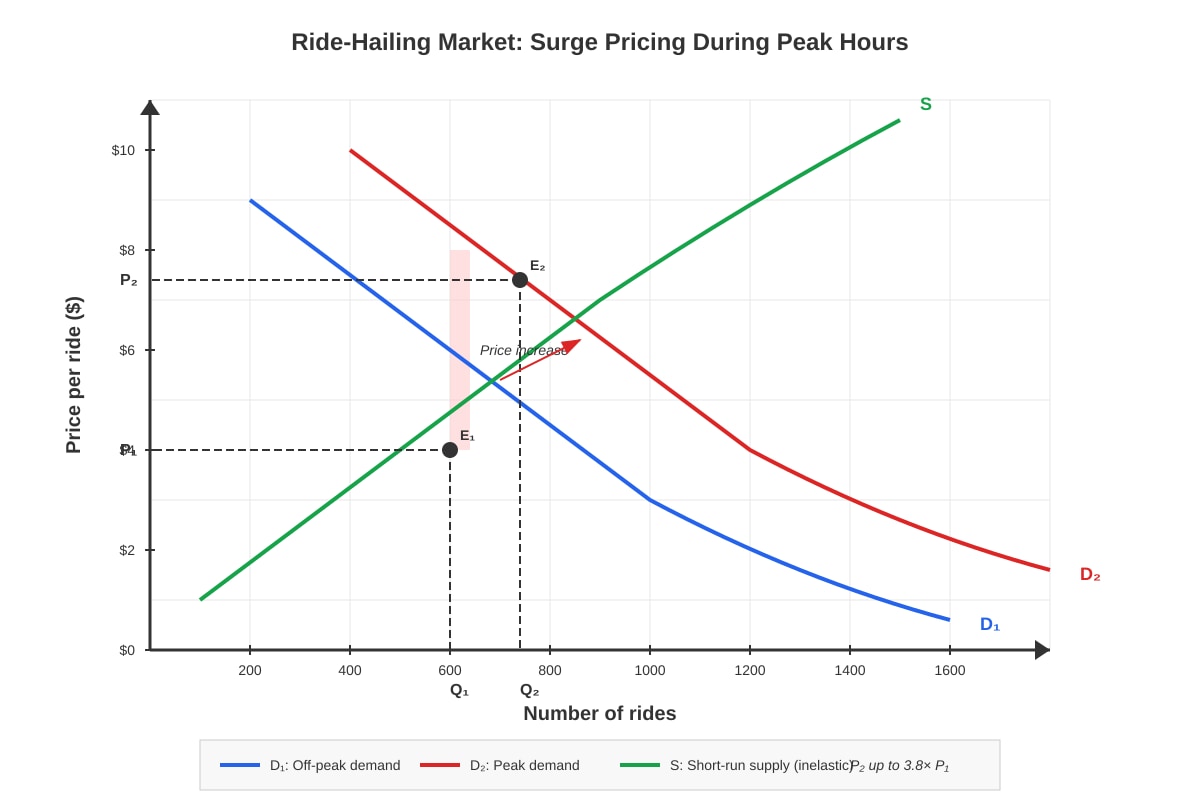
Generated diagram for Q2a.
(b) Explain one reason why the supply of ride-hailing services is relatively inelastic in the short run during peak hours.
[2 marks]
Question 3
With reference to Source B and the diagram above, describe the trend in Singapore's regulated electricity tariff between Q1 2021 and Q4 2024. Calculate the percentage change in the tariff from Q1 2021 to its peak.
[4 marks]
Question 4
Using evidence from both Source A and Source B, explain how the concept of barriers to entry is relevant to both the ride-hailing and electricity markets.
[6 marks]
Question 5
Assess whether the CCCS should approve Grab's proposed acquisition of Trans-cab. In your answer, consider the potential effects on consumers, market competition, and efficiency.
[10 marks]
Section B: Essay Questions (30 marks)
Answer any TWO of the following three questions. Each question carries 15 marks.
Question 6
"Government intervention in markets always leads to a net welfare loss."
Discuss this statement with reference to a specific market of your choice. In your answer, consider the circumstances under which government intervention may improve or reduce economic efficiency.
[15 marks]
Question 7
Discuss whether price discrimination is the best strategy for a firm operating in an oligopolistic market to increase its profits. Use appropriate examples and economic theory to support your answer.
[15 marks]
Question 8
In 2023, the Singapore government increased the Additional Buyer's Stamp Duty (ABSD) for purchase of second and subsequent residential properties from 17% to 25% (for Singapore Citizens buying a second property) and from 25% to 35% (for Singapore Citizens buying a third and subsequent property).
(a) Using a fully labelled demand and supply diagram, explain the likely impact of the ABSD increase on the price and quantity of second residential properties transacted.
[5 marks]
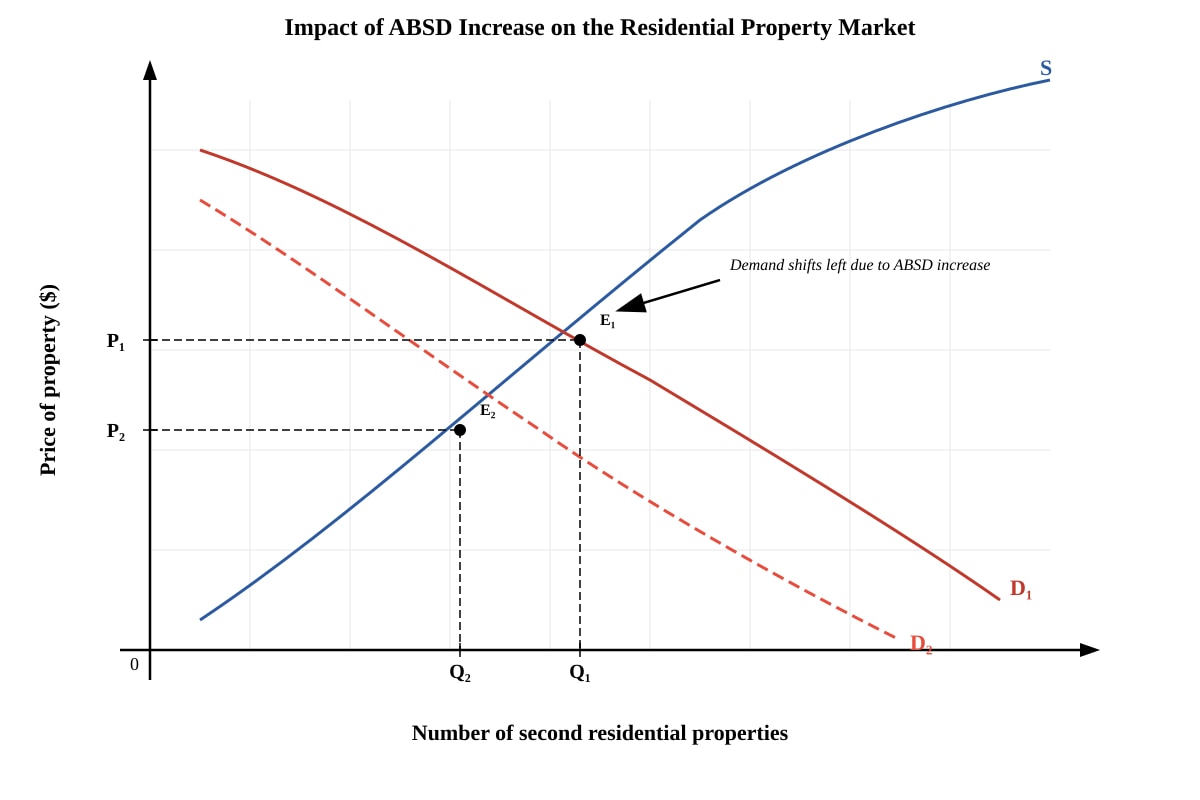
Generated diagram for Q8a.
(b) Discuss whether the increase in ABSD is the most effective policy for making housing affordable for Singapore residents. Consider at least one alternative policy in your evaluation.
[10 marks]
End of Paper
Total Marks: 60
Answers
TuitionGoWhere Practice Paper — Economics H2 A-Level
Answer Key — Version 5 of 5
Section A: Case Study (30 marks)
Question 1 [4 marks]
Answer:
The Singapore ride-hailing market after Grab's acquisition of Uber is best described as an oligopoly (1 mark), leaning towards a dominant firm / near-monopoly structure.
Justification using two characteristics from the source:
-
High market concentration / few dominant firms: Source A shows that Grab commands approximately 78% of the market, with Gojek at 12%, TADA at 5%, and the remaining firms at 5% combined. This indicates that the market is dominated by a small number of large firms, which is a key characteristic of an oligopoly. (1 mark)
-
Interdependence of firms / strategic behaviour: The source notes that both Grab and Gojek use dynamic surge pricing, suggesting that firms are aware of and react to competitors' pricing strategies. This mutual interdependence is a defining feature of oligopolistic markets. (1 mark)
-
Barriers to entry: The source mentions that Grab's loyalty programme (GrabRewards) increases switching costs for consumers and creates barriers to entry for potential competitors. High barriers to entry are a characteristic of oligopoly. (1 mark — any two of the above justifications are acceptable)
Marking notes:
- 1 mark for correctly identifying the market structure (oligopoly or dominant firm).
- Up to 2 marks for two valid characteristics drawn from the source.
- 1 mark for clear linkage between the characteristic and the source evidence.
- Do not award marks for simply restating the market share figure without explaining why it indicates oligopoly.
Common mistakes:
- Students may say "monopoly" — this is not fully correct because there are other firms (Gojek, TADA). Award partial credit if they acknowledge Grab's dominant position.
- Students may list characteristics not supported by the source. Only award marks for characteristics evidenced in Source A.
Question 2
(a) [4 marks]
Answer:
During peak hours, demand for ride-hailing services increases significantly as more people want rides (e.g., during rush hour or rainy weather). This is represented by a rightward shift of the demand curve from D1 to D2. (1 mark for explanation of demand shift)
In the short run, the supply of ride-hailing services is relatively inelastic (steep supply curve) because the number of available drivers cannot increase immediately — drivers need time to respond to price signals, and there is a finite number of licensed private-hire vehicles. (1 mark for explanation of inelastic supply)
The new equilibrium occurs at a significantly higher price (P2) with only a small increase in quantity (Q2). This price increase is the "surge price" that consumers pay. The surge pricing algorithm essentially allows the market to reach a new equilibrium where demand is rationed by the higher price. (1 mark for equilibrium analysis)
The diagram should show:
- D1 and D2 (D2 to the right of D1)
- A steep (inelastic) supply curve S
- Equilibrium at P1Q1 (off-peak) and P2Q2 (peak)
- All axes and curves clearly labelled (1 mark for correct, fully labelled diagram)
Marking notes:
- 1 mark for correct diagram with all labels.
- 1 mark for explaining the demand shift.
- 1 mark for explaining inelastic supply.
- 1 mark for linking the new equilibrium to surge pricing.
(b) [2 marks]
Answer:
One reason why the supply of ride-hailing services is relatively inelastic in the short run during peak hours is that the number of available drivers is fixed in the short run. (1 mark) Drivers cannot instantly enter the market in response to higher prices because they need to be registered, have the appropriate vehicle, and be available. Additionally, there are regulatory constraints such as the need for a Private Hire Car Driver's Vocational Licence (PDVL), which limits the speed at which new drivers can enter the market. (1 mark)
Alternative acceptable answers:
- Drivers who are already working may not be able to increase their hours immediately (they have other commitments).
- The number of vehicles available is fixed in the short run.
Marking notes:
- 1 mark for identifying the reason.
- 1 mark for explaining/elaborating on the reason.
Question 3 [4 marks]
Answer:
Trend description: (2 marks)
The regulated electricity tariff in Singapore rose steadily from 0.23/kWhinQ12021toapeakof0.33/kWh in Q4 2022, representing a sustained upward trend over approximately two years. (1 mark) After reaching its peak, the tariff stabilised in early 2023 and then gradually declined through 2023 and 2024, falling to approximately $0.27/kWh by Q4 2024. (1 mark)
Percentage change calculation: (2 marks)
Percentage change=Initial valuePeak value−Initial value×100%
=0.230.33−0.23×100%
=0.230.10×100%
=43.5% (1 dp)
- 1 mark for correct formula/method.
- 1 mark for correct answer (43.5%).
Marking notes:
- Award 1 mark for describing the upward trend and 1 mark for describing the subsequent decline.
- Award full marks for the calculation even if the student uses a slightly different peak value, provided their working is correct.
- Accept answers in the range 43.4%–43.5% depending on rounding.
Question 4 [6 marks]
Answer:
Barriers to entry refer to obstacles that prevent or deter new firms from entering a market, allowing existing firms to maintain market power and earn abnormal profits in the long run.
Ride-hailing market (Source A): (3 marks)
-
High market concentration / economies of scale: Grab's dominant 78% market share suggests it has achieved significant economies of scale in technology (app platform, algorithm), driver network, and brand recognition. A new entrant would need to invest heavily to build a comparable platform and attract both drivers and riders, creating a substantial barrier to entry. (1 mark for identification + 1 mark for explanation)
-
Switching costs / loyalty programmes: GrabRewards creates switching costs for consumers. Riders who have accumulated points and achieved higher tiers are less likely to switch to a competitor, even if the competitor offers lower prices. This increases the effective barrier to entry for new firms trying to attract customers. (1 mark)
Electricity market (Source B): (3 marks)
-
High capital costs / sunk costs: Entering the electricity retail market requires significant investment in billing systems, customer service infrastructure, and energy procurement contracts. The exit of several retailers during the 2022 price surge suggests that these costs are substantial and act as a barrier. (1 mark for identification + 1 mark for explanation)
-
Regulatory barriers: The need to be licensed by the Energy Market Authority (EMA) creates a regulatory barrier. Compliance with licensing requirements, financial adequacy standards, and consumer protection regulations adds to the cost and complexity of market entry. (1 mark)
Marking notes:
- Award up to 3 marks for each market (1 for identifying a barrier, 1 for explaining it, 1 for linking to the source).
- Students must reference the source material to gain full marks.
- Alternative valid barriers (e.g., brand loyalty, access to technology) are acceptable if well-explained.
Question 5 [10 marks]
Answer:
Introduction: The question requires an assessment of whether the CCCS should approve Grab's acquisition of Trans-cab, considering effects on consumers, competition, and efficiency. This involves weighing the potential benefits against the costs of increased market concentration.
Arguments FOR approval (benefits): (up to 3 marks)
-
Economies of scale and efficiency gains: The acquisition could allow Grab to combine Trans-cab's fleet of 2,600 taxis with its technology platform, achieving economies of scale. This could reduce average costs and improve allocative and productive efficiency. The combined entity could offer a more integrated service, reducing deadweight loss. (1–2 marks)
-
Improved service quality: Grab's technology (real-time tracking, cashless payments, route optimisation) could be applied to Trans-cab's fleet, improving the quality of service for consumers who prefer taxis. This represents a potential improvement in consumer welfare. (1 mark)
-
Survival of Trans-cab: Source A shows that traditional taxi trips have declined significantly (from 55 million to 31 million). Without the acquisition, Trans-cab might exit the market entirely, which would further reduce consumer choice. (1 mark)
Arguments AGAINST approval (costs): (up to 3 marks)
-
Increased market power and higher prices: Post-acquisition, Grab's market share would increase from 78% to approximately 81%. This increased market power could enable Grab to raise prices (higher surge multipliers) or reduce service quality, harming consumer welfare. The market would become even more concentrated, moving closer to a monopoly. (1–2 marks)
-
Reduced consumer choice: The acquisition would eliminate Trans-cab as an independent competitor, reducing the number of distinct service providers. Consumers who prefer metered taxi fares over dynamic pricing would have fewer options. (1 mark)
-
Barriers to entry: A larger, more dominant Grab would be even harder for new entrants to compete against, further entrenching the oligopolistic market structure. (1 mark)
Evaluation / Judgement: (up to 4 marks)
On balance, the CCCS should not approve the acquisition without conditions. While there are potential efficiency gains, the significant increase in market concentration is concerning. The ride-hailing market is already highly concentrated, and further consolidation would likely lead to higher prices and reduced consumer welfare in the long run. (2 marks for reasoned judgement)
However, if the CCCS were to approve the acquisition, it should impose conditions such as:
- Price caps on surge pricing to prevent abuse of market power
- Requirements to maintain Trans-cab's metered fare option
- Mandatory data sharing with regulators to monitor competitive behaviour
(2 marks for evaluative depth / consideration of conditions or alternative approaches)
Marking notes:
| Level | Marks | Descriptors |
|---|---|---|
| Level 1 | 1–3 | Superficial analysis with limited reference to the source. May only consider one side of the argument. |
| Level 2 | 4–6 | Some analysis of costs and benefits with reference to the source. Limited evaluation or one-sided argument. |
| Level 3 | 7–8 | Good analysis of both sides with clear reference to the source. Some evaluation but may lack depth or a clear conclusion. |
| Level 4 | 9–10 | Comprehensive analysis of consumer, competition, and efficiency effects. Clear, well-reasoned judgement with evaluative depth. Excellent use of source material. |
Section B: Essay Questions (30 marks)
Question 6 [15 marks]
Answer:
Introduction: The statement claims that government intervention always leads to a net welfare loss. This is an absolute statement that requires careful evaluation. While some forms of intervention can create inefficiencies (deadweight loss), others can correct market failures and improve welfare. The outcome depends on the type of intervention, the market context, and the government's ability to implement policy effectively.
Body Paragraph 1: When government intervention leads to net welfare loss (up to 4 marks)
- Price floors/ceilings: A price floor set above equilibrium (e.g., minimum wage) creates a surplus and deadweight loss. A price ceiling set below equilibrium (e.g., rent control) creates shortages and misallocation of resources. Diagram should show deadweight loss triangles.
- Taxation: Taxes create a wedge between the price consumers pay and the price producers receive, reducing the quantity traded below the socially optimal level and creating deadweight loss.
- Government failure: Intervention may be based on imperfect information, leading to policies that are too stringent or too lenient. Regulatory capture and rent-seeking behaviour can also reduce welfare.
Body Paragraph 2: When government intervention improves welfare (up to 4 marks)
- Correcting negative externalities: In markets with negative externalities (e.g., pollution), the market overproduces the good. A Pigouvian tax can internalise the externality, shifting the supply curve leftward to the socially optimal level and eliminating deadweight loss. Diagram should show MSC, MPC, and the welfare gain from intervention.
- Provision of public goods: Public goods (e.g., national defence, street lighting) are non-rival and non-excludable, leading to free-rider problems and under-provision by the market. Government provision can improve welfare.
- Correcting information asymmetry: Regulations such as mandatory disclosure requirements (e.g., food labelling, financial product disclosures) can improve market outcomes by enabling consumers to make better-informed decisions.
Body Paragraph 3: Context matters (up to 3 marks)
- The effectiveness of intervention depends on the government's ability to accurately measure the size of the externality or market failure.
- In Singapore's context, government intervention in the housing market (HDB, ABSD) has been relatively effective in managing affordability, suggesting that well-designed intervention can improve outcomes.
- However, the EMA's temporary price cap in the electricity market (Source B) illustrates the risk of intervention — while it protected consumers in the short run, it may have distorted price signals and contributed to retailer exits.
Conclusion / Evaluation: (up to 4 marks)
The statement is too absolute. Government intervention does not always lead to a net welfare loss. When markets fail — due to externalities, public goods, information asymmetry, or market dominance — well-designed intervention can improve welfare by correcting the market failure. However, poorly designed intervention (e.g., excessive price controls, poorly targeted subsidies) can indeed create government failure and net welfare loss. The key is whether the intervention is well-targeted, based on accurate information, and subject to regular review.
Marking notes:
| Level | Marks | Descriptors |
|---|---|---|
| Level 1 | 1–4 | Descriptive response with limited analysis. May only discuss one side. No diagrams or weak diagrams. |
| Level 2 | 5–8 | Some analysis of when intervention helps or harms. Limited evaluation. May lack diagrams or use them poorly. |
| Level 3 | 9–12 | Good analysis of both sides with relevant examples. Some evaluation. Appropriate use of diagrams. |
| Level 4 | 13–15 | Comprehensive analysis with clear evaluation. Well-chosen examples. Accurate, well-labelled diagrams. Clear, reasoned conclusion that directly addresses the absolute nature of the statement. |
Question 7 [15 marks]
Answer:
Introduction: Price discrimination occurs when a firm charges different prices to different consumers for the same product, where the price difference is not justified by cost differences. Whether it is the "best" strategy for profit maximisation in an oligopoly depends on several conditions and must be weighed against alternative strategies.
Body Paragraph 1: How price discrimination increases profits (up to 4 marks)
- Conditions for price discrimination: (1) The firm must have market power (ability to set prices). (2) Different consumer groups must have different price elasticities of demand (PED). (3) The firm must be able to prevent arbitrage (resale between consumer groups).
- Mechanism: By charging a higher price to consumers with more inelastic demand and a lower price to those with more elastic demand, the firm captures more consumer surplus and converts it into additional revenue/profit. Diagram: third-degree price discrimination with two market segments showing different prices.
- Example: Airlines charge higher prices to business travellers (inelastic demand — need to travel on specific dates, expenses paid by employer) and lower prices to leisure travellers (elastic demand — can book in advance, flexible dates).
Body Paragraph 2: Why price discrimination may be the best strategy in oligopoly (up to 3 marks)
- In an oligopoly, firms compete on both price and non-price factors. Price discrimination allows a firm to increase profits without engaging in a destructive price war, which would reduce profits for all firms.
- It is a form of non-price competition that can increase revenue without directly undercutting rivals' prices in the mass market.
- Example: Supermarket loyalty cards (e.g., NTUC FairPrice) allow firms to offer targeted discounts to price-sensitive customers while maintaining higher prices for less price-sensitive customers.
Body Paragraph 3: Limitations and alternative strategies (up to 4 marks)
- Practical difficulties: Identifying and separating consumer groups can be costly. Arbitrage may undermine the strategy (e.g., students reselling discounted tickets).
- Consumer backlash: If consumers discover they are being charged different prices, it may damage the firm's reputation and reduce demand.
- Alternative strategies: (1) Product differentiation — creating perceived differences in products to justify higher prices. (2) Collusion — agreeing with rivals to fix prices (though illegal under competition law). (3) Innovation — investing in R&D to reduce costs or create superior products. (4) Advertising and branding — shifting demand rightward and making it more inelastic.
- In oligopoly, game theory suggests that firms' strategies are interdependent. If one firm uses price discrimination, rivals may respond, potentially reducing its effectiveness.
Conclusion / Evaluation: (up to 4 marks)
Price discrimination can be a highly effective profit-maximisation strategy for firms in oligopolistic markets, provided the conditions are met. However, it is not necessarily the "best" strategy in all cases. The effectiveness depends on the firm's ability to segment markets, prevent arbitrage, and avoid consumer backlash. In some cases, product differentiation or innovation may yield higher long-term profits by building brand loyalty and creating sustainable competitive advantage. The "best" strategy depends on the specific market context, the firm's capabilities, and the likely reactions of competitors.
Marking notes:
| Level | Marks | Descriptors |
|---|---|---|
| Level 1 | 1–4 | Descriptive response. May explain price discrimination but without analysis of why it is/is not the best strategy. |
| Level 2 | 5–8 | Some analysis of price discrimination and its effectiveness. Limited consideration of alternatives. |
| Level 3 | 9–12 | Good analysis with relevant examples. Considers alternatives. Some evaluation of "best." |
| Level 4 | 13–15 | Comprehensive analysis with clear evaluation. Well-chosen examples. Addresses the word "best" directly. Considers oligopoly context and interdependence. |
Question 8
(a) [5 marks]
Answer:
The increase in ABSD from 17% to 25% for Singapore Citizens buying a second residential property raises the total cost of purchasing a second property. This effectively reduces the willingness and ability of buyers to pay for second properties, causing the demand curve to shift leftward from D1 to D2. (1 mark for explaining the demand shift)
The supply of second residential properties is relatively inelastic in the short run because the number of properties available for sale at any given time is fixed (property cannot be quickly built or removed from the market). (1 mark for explaining inelastic supply)
The new equilibrium is at a lower price (P2) and a lower quantity (Q2). The diagram should show:
- D1 shifting left to D2
- An upward-sloping (relatively inelastic) supply curve S
- Original equilibrium at P1, Q1
- New equilibrium at P2, Q2 (where P2 < P1 and Q2 < Q1)
- All curves and axes clearly labelled (2 marks for correct, fully labelled diagram)
Marking notes:
- 1 mark for explaining the demand shift.
- 1 mark for explaining inelastic supply.
- 2 marks for correct diagram (1 for correct shift, 1 for all labels).
- 1 mark for identifying the new equilibrium outcome (lower P and Q).
(b) [10 marks]
Answer:
Introduction: The ABSD increase aims to cool demand for second and subsequent residential properties, thereby improving affordability. However, whether it is the "most effective" policy requires evaluation against alternative approaches and consideration of unintended consequences.
Arguments that ABSD is effective (up to 3 marks)
-
Targets speculative demand: By increasing the tax on second and subsequent properties, the policy specifically targets investors and speculators rather than first-time homebuyers (who are exempt). This reduces demand from those who are purchasing for investment purposes, freeing up supply for owner-occupiers. (1–2 marks)
-
Demonstrated impact: The leftward shift in demand should reduce both the price and quantity of transactions, making housing more affordable for those buying their first property. The policy has been adjusted multiple times (2011, 2013, 2018, 2021, 2023), suggesting the government views it as a useful tool. (1 mark)
Arguments that ABSD may not be the most effective policy (up to 3 marks)
-
Regressive impact on upgraders: The policy also affects genuine upgraders (e.g., families moving to a larger home) who may need to buy a second property before selling their first. This creates hardship for some households. (1 mark)
-
Supply-side limitations: ABSD addresses only the demand side. If the fundamental issue is insufficient housing supply relative to population growth, demand-side measures alone may not be sufficient. Prices may remain high if supply is inelastic. (1 mark)
-
Unintended consequences: The policy may push demand towards the rental market (increasing rents) or towards overseas property markets. It may also reduce labour mobility if homeowners are reluctant to move because of the high cost of buying a second property. (1 mark)
Alternative policy: Increase supply through government land sales and BTO builds (up to 2 marks)
- Increasing the supply of housing (both public HDB and private) through government land sales and accelerated Build-To-Order (BTO) construction would shift the supply curve rightward, reducing equilibrium price and increasing quantity. This addresses the root cause of high prices (insufficient supply) rather than just dampening demand.
- Supply-side policies may be more effective in the long run because they increase the total stock of housing, whereas ABSD only reallocates existing demand.
Evaluation / Judgement: (up to 2 marks)
ABSD is a useful short-term measure to manage demand, but it is unlikely to be the "most effective" policy on its own. A combination of demand-side measures (ABSD, loan-to-value limits) and supply-side measures (increased land sales, faster BTO construction, release of GLS sites) is likely to be more effective. The most effective approach addresses both sides of the market simultaneously. Additionally, the government should consider targeted exemptions for genuine upgraders to reduce unintended consequences.
Marking notes:
| Level | Marks | Descriptors |
|---|---|---|
| Level 1 | 1–3 | Superficial analysis. May only describe the policy without evaluating effectiveness. |
| Level 2 | 4–6 | Some analysis of effectiveness with limited evaluation. May not consider alternatives. |
| Level 3 | 7–8 | Good analysis of ABSD's effectiveness and limitations. Considers at least one alternative. Some evaluation. |
| Level 4 | 9–10 | Comprehensive analysis with clear evaluation. Considers multiple perspectives and alternatives. Clear, well-reasoned judgement on "most effective." |
End of Answer Key
Total Marks: 60
Section A: 30 marks (Q1: 4, Q2a: 4, Q2b: 2, Q3: 4, Q4: 6, Q5: 10)
Section B: 30 marks (Q6/Q7/Q8: 15 each, answer any TWO)
Check: 4 + 4 + 2 + 4 + 6 + 10 + 15 + 15 = 60 marks ✓
Free quiz and exam paper access
Enter your details to view this paper
Your access is remembered on this device.