From Real Exams Exam Paper
A Level H2 Economics Practice Paper 4
Free A Level H2 Econs Practice Paper 4, LongCat Exam version, with questions, answers, and A Level-style practice for Singapore students.
These static practice materials are generated from the site's syllabus and paper-generation workflow, with source and model context shown so students and parents can evaluate the material before use.
Questions
TuitionGoWhere Practice Paper - Economics H2 A-Level
TuitionGoWhere Secondary School (AI)
Subject: Economics H2
Level: A-Level
Paper: Practice Paper — Microeconomics (Paper 1 Style)
Version: 4 of 5
Duration: 2 hours 15 minutes
Total Marks: 60
Name: ___________________________
Class: ___________________________
Date: ___________________________
Instructions to Candidates
- Answer all questions in Section A and Section B.
- Write your answers in the spaces provided.
- Begin each section on a fresh page.
- Show all working for calculation questions.
- Use economic terminology and real-world examples where appropriate.
- The number of marks for each question is shown in brackets [ ].
- You are advised to spend approximately 45 minutes on Section A and 90 minutes on Section B.
Section A: Case Study (30 marks)
Read the following case study carefully and answer Questions 1–5.
Case Study: The Singapore Ride-Hailing Market
Singapore's ride-hailing market has undergone significant structural changes since 2018. The entry of Grab in 2018, following its acquisition of Uber's Southeast Asian operations, fundamentally altered market dynamics. By 2023, Grab commanded approximately 72% of the ride-hailing market share, with Gojek holding around 18% and Tada (a newer entrant using a zero-commission model) capturing approximately 5%. The remaining 5% was distributed among smaller operators including Ryde and Zig.
The Land Transport Authority (LTA) regulates the industry through a licensing framework. All ride-hailing operators must hold a Ride-Hail Service Operator Licence (RSOL), which requires compliance with safety standards, driver background checks, and data-sharing obligations. In 2022, the LTA introduced a requirement that all private hire car drivers must hold a Private Hire Car Driver's Vocational Licence (PDVL), involving a 10-hour training course and examination.
Table 1: Market Share of Ride-Hailing Operators in Singapore (2023)
| Operator | Market Share (%) | Commission Rate Charged to Drivers (%) | Average Fare per Trip (S$) |
|---|---|---|---|
| Grab | 72 | 20–25 | 14.50 |
| Gojek | 18 | 20 | 14.20 |
| Tada | 5 | 0 | 13.80 |
| Others | 5 | 15–20 | 14.00 |
Table 2: Price Elasticity Estimates for Ride-Hailing Services in Singapore
| Segment | Estimated PED | Reasoning |
|---|---|---|
| Overall market | −0.8 | Limited substitutes for short trips; convenience valued |
| Grab users (short-run) | −0.4 | High switching costs due to app loyalty, stored payment details |
| Grab users (long-run) | −1.2 | More time to find alternatives; multi-homing possible |
| Peak-hour demand | −0.3 | Urgency reduces price sensitivity |
| Off-peak demand | −1.1 | More time flexibility; public transport viable |
In 2023, Grab increased its average fares by 8% during peak hours, citing rising fuel costs and the need to incentivise more drivers to be on the road. Following the fare increase, Grab's peak-hour trip volume fell by approximately 3.2%. Gojek responded by maintaining its fares, and its peak-hour trip volume increased by 4%.
Tada, the zero-commission operator, has been gaining attention for its disruptive business model. By charging drivers no commission, Tada attracts more drivers to its platform, reducing average waiting times. However, Tada's revenue comes entirely from a flat booking fee of S$0.50 charged to passengers per trip. Critics argue that Tada's model is unsustainable in the long run, as it cannot generate sufficient revenue to fund technology development and marketing.
The ride-hailing market also generates significant positive externalities. Studies by the LTA estimate that each ride-hailing trip replaces 0.3 private car trips, reducing traffic congestion and carbon emissions. The estimated marginal external benefit per trip is S1.20.However,themarketalsoproducesnegativeexternalities:increasedtrafficcongestionincentralbusinessdistrictsduringpeakhours,withanestimatedmarginalexternalcostofS0.80 per trip.
Question 1
Using the data in Table 1, identify the market structure that best describes Singapore's ride-hailing market. Justify your answer with two characteristics of this market structure. [4]
Question 2
(a) Using the data provided, calculate the price elasticity of demand (PED) for Grab's peak-hour services following the 8% fare increase. Show your working. [3]
(b) Based on your calculation in (a), explain whether Grab's total revenue from peak-hour trips increased or decreased after the fare increase. [2]
Question 3
(a) Calculate the cross elasticity of demand (XED) between Gojek and Grab for peak-hour services. Show your working. [3]
(b) Using your result from (a), explain the relationship between Gojek and Grab's services. [2]
Question 4
Using a demand and supply diagram, illustrate and explain how the introduction of the PDVL requirement in 2022 would affect the market for private hire car drivers in Singapore. [6]
Generated graph for Q4.
Question 5
Discuss whether the positive and negative externalities associated with ride-hailing services in Singapore suggest that the market output is above or below the socially optimal level. Use the data provided to support your answer. [10]
Section B: Structured Essays (30 marks)
Answer Question 6 and Question 7.
Question 6
(a) Explain the conditions necessary for a firm to successfully implement third-degree price discrimination. [6]
(b) Discuss whether price discrimination is the best strategy for Grab to increase its revenue in the Singapore ride-hailing market. [9]
Question 7
(a) Explain why a firm in an oligopoly market might engage in non-price competition rather than price competition. [6]
(b) Assess whether the Singapore government should approve a hypothetical merger between Grab and Gojek. In your answer, consider the potential effects on consumers, drivers, and market efficiency. [9]
End of Practice Paper
Mark Summary
| Section | Question | Marks |
|---|---|---|
| A | Q1 | 4 |
| A | Q2(a) | 3 |
| A | Q2(b) | 2 |
| A | Q3(a) | 3 |
| A | Q3(b) | 2 |
| A | Q4 | 6 |
| A | Q5 | 10 |
| Section A Total | 30 | |
| B | Q6(a) | 6 |
| B | Q6(b) | 9 |
| B | Q7(a) | 6 |
| B | Q7(b) | 9 |
| Section B Total | 30 | |
| Grand Total | 60 |
Answers
TuitionGoWhere Practice Paper — Economics H2 A-Level
Answer Key & Marking Scheme
Version 4 of 5
Section A: Case Study
Question 1 — Market Structure Identification [4 marks]
Answer:
The Singapore ride-hailing market is best described as an oligopoly.
Justification — two characteristics:
-
Few dominant firms: The market is dominated by a small number of large firms — Grab (72%), Gojek (18%), and Tada (5%) — who together account for 95% of the market. This concentration is a defining feature of oligopoly.
-
Interdependence of firms: The case study shows that Gojek responded strategically to Grab's fare increase by maintaining its own fares, indicating that firms in this market are aware of and react to each other's decisions. This mutual interdependence is characteristic of oligopoly.
Alternative acceptable characteristic:
- Barriers to entry: The RSOL licensing requirement and PDVL training create regulatory barriers to entry, which is consistent with oligopoly. High brand loyalty and network effects (more drivers attract more passengers and vice versa) also act as barriers.
Marking:
- 1 mark for correctly identifying oligopoly.
- 1 mark each for two valid characteristics linked to the data (2 marks).
- Total: 4 marks.
Common mistakes:
- Students may identify "monopoly" due to Grab's dominant share. However, the presence of multiple significant competitors (Gojek at 18%) and the evidence of strategic interaction makes oligopoly the more accurate classification.
- Students may describe characteristics without linking them to the case study data.
Question 2(a) — PED Calculation [3 marks]
Working:
The formula for price elasticity of demand is:
PED=% change in price% change in quantity demanded
From the case study:
- % change in price = +8% (fare increase)
- % change in quantity demanded = −3.2% (trip volume fell)
PED=+8%−3.2%=−0.4
Answer: The PED for Grab's peak-hour services is −0.4 (or 0.4 in absolute terms, inelastic).
Marking:
- 1 mark for correct formula.
- 1 mark for correct substitution of values.
- 1 mark for correct final answer (−0.4).
- Total: 3 marks.
Teaching note: The negative sign indicates the inverse relationship between price and quantity demanded (the law of demand). In absolute terms, since |PED| < 1, demand is inelastic — the percentage change in quantity demanded is smaller than the percentage change in price.
Question 2(b) — Total Revenue Effect [2 marks]
Answer:
Grab's total revenue from peak-hour trips increased after the fare increase.
Explanation:
When demand is inelastic (|PED| < 1), an increase in price leads to a proportionally smaller decrease in quantity demanded. Total revenue (TR = P × Q) therefore rises because the gain from the higher price outweighs the loss from fewer trips.
In this case:
- Price increased by 8%.
- Quantity demanded fell by only 3.2%.
- Since the price rise (8%) exceeds the quantity fall (3.2%), total revenue increases.
Marking:
- 1 mark for stating that total revenue increased.
- 1 mark for correct explanation linking inelastic demand to the revenue outcome.
- Total: 2 marks.
Common mistake: Students may confuse the relationship and state that revenue falls. The key principle is: for inelastic demand, price and total revenue move in the same direction.
Question 3(a) — XED Calculation [3 marks]
Working:
The formula for cross elasticity of demand is:
XED=% change in price of Good B (Grab)% change in quantity demanded of Good A (Gojek)
From the case study:
- Grab's price increased by +8%.
- Gojek's trip volume increased by +4%.
XED=+8%+4%=+0.5
Answer: The cross elasticity of demand between Gojek and Grab is +0.5.
Marking:
- 1 mark for correct formula.
- 1 mark for correct substitution of values.
- 1 mark for correct final answer (+0.5).
- Total: 3 marks.
Teaching note: XED measures the responsiveness of demand for one good to a change in the price of another good. The sign of XED indicates the relationship between the goods.
Question 3(b) — Interpretation of XED [2 marks]
Answer:
The positive XED (+0.5) indicates that Gojek and Grab's services are substitutes.
Explanation:
When Grab increased its fares, some consumers switched to Gojek, causing Gojek's trip volume to rise. This positive relationship — where a price increase for one good leads to increased demand for the other — is the definition of substitute goods. The magnitude of +0.5 suggests they are moderate substitutes (not perfect substitutes, which would yield a much higher positive XED).
Marking:
- 1 mark for identifying the goods as substitutes.
- 1 mark for explaining the reasoning (positive XED → substitutes; consumers switched).
- Total: 2 marks.
Question 4 — Diagram: PDVL Requirement Effect [6 marks]
Answer:
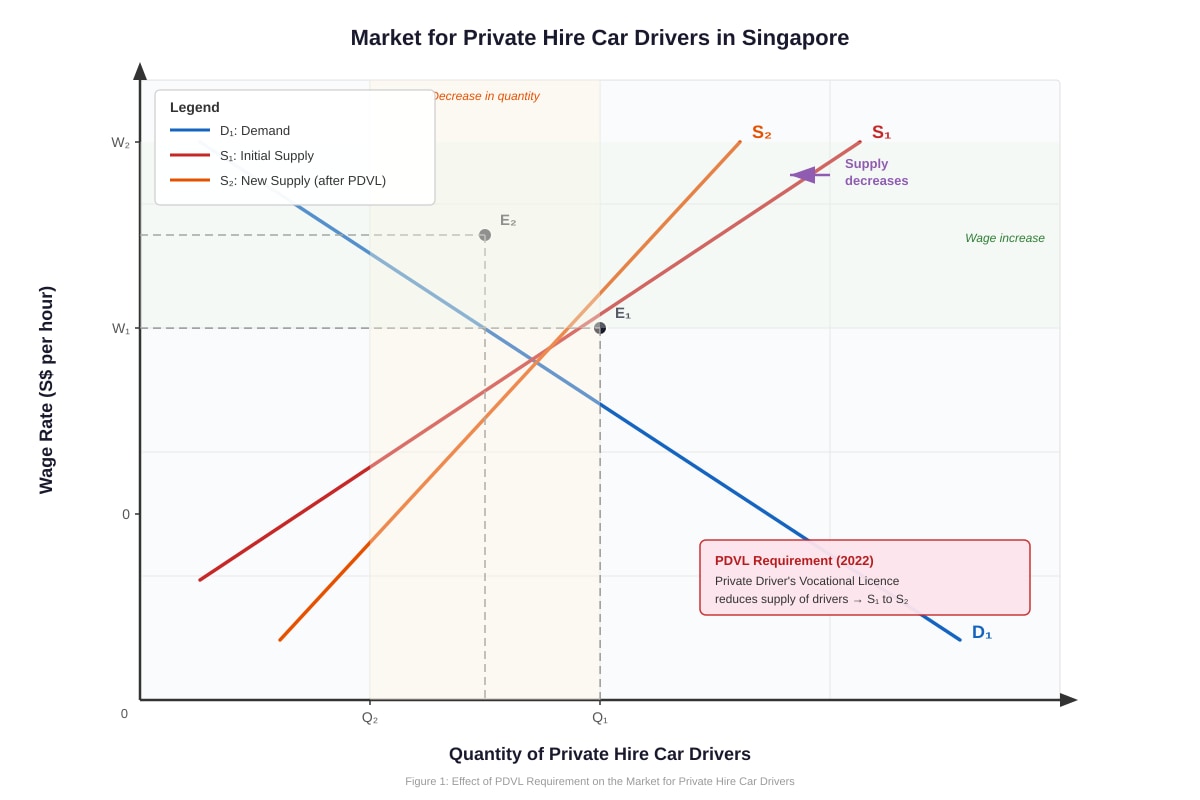
The introduction of the PDVL requirement increases the cost and time required to become a private hire car driver (10-hour training course and examination). This reduces the supply of private hire car drivers at every wage rate.
Diagram description (refer to Q4-fig1):
- The demand curve (D1) for private hire car drivers slopes downward — firms are willing to hire more drivers at lower wage rates.
- The initial supply curve (S1) slopes upward — more drivers are willing to work at higher wage rates.
- The PDVL requirement shifts the supply curve leftward from S1 to S2, as fewer drivers are willing/able to supply their labour at each wage rate due to the additional training requirement.
- The new equilibrium moves from E1 (W1, Q1) to E2 (W2, Q2).
- W2 > W1: The wage rate increases due to the reduced supply of drivers.
- Q2 < Q1: The quantity of drivers employed decreases.
Marking:
- 1 mark for correctly drawn and labelled demand and supply curves with initial equilibrium.
- 1 mark for showing a leftward shift of the supply curve (S1 → S2).
- 1 mark for showing the new equilibrium with higher wage and lower quantity.
- 1 mark for correctly labelling all axes, curves, and equilibrium points.
- 1 mark for explaining that the PDVL increases costs/barriers, reducing supply.
- 1 mark for explaining the resulting higher wage and lower quantity of drivers.
- Total: 6 marks.
Common mistakes:
- Shifting the demand curve instead of the supply curve. The PDVL affects drivers (supply side), not firms' willingness to hire (demand side).
- Not labelling axes or curves clearly.
- Drawing the shift as a movement along the curve rather than a shift of the curve.
Question 5 — Externalities and Socially Optimal Output [10 marks]
Key knowledge and analysis:
The socially optimal level of output occurs where Marginal Social Benefit (MSB) = Marginal Social Cost (MSC).
-
Marginal Private Benefit (MPB): The benefit to the individual consumer of a ride-hailing trip (reflected in the fare they are willing to pay).
-
Marginal External Benefit (MEB): The benefit to third parties — estimated at S$1.20 per trip (reduced congestion, lower emissions from replacing 0.3 private car trips).
-
MSB = MPB + MEB
-
Marginal Private Cost (MPC): The cost borne by the ride-hailing firm (driver wages, fuel, vehicle costs, commission).
-
Marginal External Cost (MEC): The cost to third parties — estimated at S$0.80 per trip (additional congestion in CBD areas during peak hours).
-
MSC = MPC + MEC
Analysis:
Since MEB (S1.20)>MEC(S0.80), the net marginal external benefit is positive (S$0.40 per trip). This means that each additional ride-hailing trip generates more external benefit than external cost.
At the market equilibrium, firms and consumers only consider private benefits and costs (MPB = MPC). However, because there is a net positive externality, the MSB > MPC at the market output. This means the market under-produces relative to the socially optimal level — the market output is below the socially optimal level.
Diagrammatic explanation (if drawn):
- The MSB curve lies above the MPB curve by S$1.20 at every quantity.
- The MSC curve lies above the MPC curve by S$0.80 at every quantity.
- The market equilibrium (MPB = MPC) occurs at a lower quantity than the social optimum (MSB = MSC).
- The welfare loss is the area between MSB and MSC from the market quantity to the socially optimal quantity.
Evaluation points:
-
Magnitude matters: The net positive externality of S0.40pertripisrelativelysmallcomparedtotheaveragefareofS14.50. This suggests the divergence between market and socially optimal output may be modest.
-
Measurement uncertainty: The estimates of MEB and MEC are based on studies and may not capture all externalities (e.g., long-term environmental effects, impact on public transport ridership).
-
Distributional considerations: The positive externalities (reduced congestion, lower emissions) benefit society broadly, while the negative externalities (CBD congestion) are concentrated in specific areas and times.
-
Policy implication: A subsidy of S$0.40 per trip could theoretically correct the market failure by internalising the net positive externality, encouraging output toward the socially optimal level.
Marking (Level-based):
| Level | Marks | Descriptor |
|---|---|---|
| L1 | 1–3 | Limited understanding of externalities; may identify positive/negative externalities but fails to compare them or determine the socially optimal output. |
| L2 | 4–6 | Explains both externalities with some reference to data; attempts to compare MEB and MEC but may not clearly conclude on market vs. socially optimal output. |
| L3 | 7–8 | Clear analysis comparing MEB (S1.20)andMEC(S0.80); correctly concludes market output is below socially optimal; uses MSB/MSC framework. |
| L4 | 9–10 | Comprehensive analysis with evaluation; considers magnitude, measurement issues, or policy implications; well-structured argument with clear conclusion. |
Section B: Structured Essays
Question 6(a) — Conditions for Third-Degree Price Discrimination [6 marks]
Answer:
Third-degree price discrimination involves charging different prices to different groups of consumers for the same product or service. For a firm to successfully implement this strategy, the following conditions must be met:
-
Market power: The firm must have some degree of market power (be a price setter, not a price taker). Grab, with 72% market share, has significant market power in the ride-hailing market.
-
Ability to segment the market: The firm must be able to divide consumers into distinct groups based on identifiable characteristics (e.g., time of travel, location, age, income). In the ride-hailing context, Grab can segment by peak vs. off-peak hours, or by geographical area.
-
Different price elasticities of demand: The different market segments must have different PEDs. The case study shows peak-hour PED = −0.3 (inelastic) and off-peak PED = −1.1 (elastic). This difference allows Grab to charge higher prices to peak-hour consumers (who are less price-sensitive) and lower prices to off-peak consumers.
-
No arbitrage (prevent resale): It must be difficult or impossible for consumers who buy at the lower price to resell to those who would pay the higher price. In ride-hailing, this is naturally satisfied — a trip is a service consumed at the point of purchase and cannot be resold.
Marking:
- 1 mark for each valid condition explained (up to 4 conditions × 1 mark = 4 marks).
- Up to 2 marks for applying conditions to the Grab/ride-hailing context.
- Total: 6 marks.
Question 6(b) — Is Price Discrimination the Best Strategy for Grab? [9 marks]
This is an evaluative essay. A good answer should present both sides and reach a reasoned conclusion.
Arguments FOR price discrimination being the best strategy:
-
Revenue maximisation: By charging higher prices to inelastic segments (peak-hour users) and lower prices to elastic segments (off-peak users), Grab can increase total revenue compared to a single uniform price. This is the fundamental gain from price discrimination.
-
Increased output and efficiency: Price discrimination can enable Grab to serve more market segments. Off-peak discounts can stimulate demand during quieter periods, improving driver utilisation and reducing idle time.
-
Consumer surplus extraction: Grab can capture more consumer surplus, converting it into producer surplus (profit), which can be reinvested in technology, service quality, and driver incentives.
-
Competitive advantage: Sophisticated pricing strategies (e.g., dynamic pricing algorithms) can be a source of competitive advantage that is difficult for competitors to replicate.
Arguments AGAINST price discrimination being the best strategy:
-
Consumer backlash and brand damage: Price discrimination, especially if perceived as unfair, can lead to negative publicity and consumer dissatisfaction. Grab already faces public scrutiny over surge pricing.
-
Regulatory risk: The LTA may view aggressive price discrimination as exploitative, particularly if it targets vulnerable consumer groups or essential travel needs.
-
Competitive response: Gojek and Tada may undercut Grab's prices in specific segments, reducing the effectiveness of price discrimination. Tada's zero-commission model already pressures Grab's pricing.
-
Administrative and technological costs: Implementing and maintaining a price discrimination strategy requires sophisticated data analytics, dynamic pricing algorithms, and continuous monitoring — all of which incur costs.
-
Alternative strategies may be more effective: Non-price competition (improving app features, loyalty programmes, expanding service offerings like GrabFood, GrabPay) may yield more sustainable revenue growth without the reputational risks of price discrimination.
Conclusion:
Price discrimination can be an effective revenue-enhancing strategy for Grab given its market power and the differing elasticities across consumer segments. However, it may not be the "best" strategy in isolation. A combination of moderate price discrimination with strong non-price competition (service quality, ecosystem expansion, loyalty programmes) is likely to be more sustainable and less risky in the long run.
Marking (Level-based):
| Level | Marks | Descriptor |
|---|---|---|
| L1 | 1–3 | Describes price discrimination with limited application to Grab; one-sided argument; no evaluation. |
| L2 | 4–6 | Explains how price discrimination could benefit Grab; some attempt at evaluation but may be unbalanced or superficial. |
| L3 | 7–9 | Balanced discussion of both sides with clear application to the ride-hailing context; reaches a reasoned conclusion; considers alternatives and limitations. |
Question 7(a) — Non-Price Competition in Oligopoly [6 marks]
Answer:
In an oligopoly, firms may prefer non-price competition over price competition for several reasons:
-
Price wars are destructive: If one firm lowers prices, rivals are likely to match the price cut to avoid losing market share. This can trigger a price war, reducing profits for all firms. In the ride-hailing context, a price war between Grab and Gojek would erode margins for both.
-
Kinked demand curve theory: In oligopoly, the demand curve is kinked at the prevailing price. Above the kink, demand is elastic (rivals don't follow price increases); below the kink, demand is inelastic (rivals match price cuts). This creates a price rigidity incentive — firms avoid price changes and instead compete through other means.
-
Non-price competition builds brand loyalty: Investing in service quality, app features, loyalty programmes (GrabRewards), and ecosystem expansion (GrabFood, GrabPay, GrabInsure) creates switching costs for consumers, making demand less elastic and reducing the incentive to compete on price.
-
Differentiation: Non-price competition allows firms to differentiate their products, creating perceived uniqueness that justifies premium pricing. For example, Tada differentiates through its zero-commission model and shorter waiting times.
-
Sustainable competitive advantage: Non-price advantages (technology, brand reputation, network effects) are often more durable than price advantages, which can be easily matched by competitors.
Marking:
- 1 mark for each valid reason explained (up to 4 reasons × 1 mark = 4 marks).
- Up to 2 marks for applying reasons to the ride-hailing/oligopoly context.
- Total: 6 marks.
Question 7(b) — Assessment of a Grab-Gojek Merger [9 marks]
This is an evaluative essay requiring analysis of effects on consumers, drivers, and market efficiency, with a reasoned conclusion.
Arguments that the merger should NOT be approved (against consumer interest):
-
Reduced competition and higher prices: The combined entity would control approximately 90% of the market (72% + 18%), creating a near-monopoly. With reduced competitive pressure, the merged firm would have greater market power to raise fares, harming consumers.
-
Reduced consumer choice: The elimination of Gojek as an independent competitor would reduce the number of options available to consumers, potentially leading to lower service quality and less innovation.
-
Exploitation of drivers: With 90% market share, the merged firm would have monopsony power in the labour market for drivers. It could reduce driver commissions or worsen working conditions, as drivers would have fewer alternative platforms.
-
Barriers to entry: A dominant merged firm could raise barriers to entry through exclusive contracts, network effects, and predatory pricing strategies, making it harder for new entrants like Tada to compete.
-
Allocative and productive inefficiency: A near-monopoly may become complacent, leading to X-inefficiency (higher costs due to lack of competitive pressure) and allocative inefficiency (prices above marginal cost).
Arguments that the merger COULD be approved (potential benefits):
-
Economies of scale: The merged firm could achieve significant cost savings through shared technology platforms, reduced marketing duplication, and operational efficiencies. These savings could theoretically be passed on to consumers.
-
Improved service quality: Greater resources could be invested in technology development, safety features, and service improvements, benefiting both consumers and drivers.
-
International competitiveness: A larger, stronger firm could better compete in regional markets (Southeast Asia), potentially generating returns that benefit the Singapore operation.
-
Regulatory safeguards: The merger could be approved with conditions — price caps, service quality requirements, driver protection measures — to mitigate anti-competitive effects.
Conclusion:
On balance, the merger between Grab and Gojek is unlikely to benefit consumers in the Singapore ride-hailing market. The extreme market concentration (90%) would significantly reduce competition, likely leading to higher fares, lower service quality, and exploitation of drivers. While economies of scale are a potential benefit, the risks to consumer welfare and market efficiency outweigh these gains. The Singapore government should not approve the merger unconditionally. If approval is considered, it should be subject to strict regulatory conditions including price regulation, service quality standards, and driver protection measures.
Marking (Level-based):
| Level | Marks | Descriptor |
|---|---|---|
| L1 | 1–3 | Describes merger effects with limited analysis; one-sided; no clear conclusion. |
| L2 | 4–6 | Analyses effects on consumers and/or drivers with some depth; attempts evaluation but may lack balance or clear conclusion. |
| L3 | 7–9 | Comprehensive analysis of effects on consumers, drivers, and market efficiency; balanced evaluation with clear application to the Singapore context; reaches a well-reasoned conclusion. |
Summary of Marks
| Question | Marks |
|---|---|
| Q1 | 4 |
| Q2(a) | 3 |
| Q2(b) | 2 |
| Q3(a) | 3 |
| Q3(b) | 2 |
| Q4 | 6 |
| Q5 | 10 |
| Section A Total | 30 |
| Q6(a) | 6 |
| Q6(b) | 9 |
| Q7(a) | 6 |
| Q7(b) | 9 |
| Section B Total | 30 |
| Grand Total | 60 |
Free quiz and exam paper access
Enter your details to view this paper
Your access is remembered on this device.