From Real Exams Exam Paper
A Level H2 Economics Practice Paper 4
Free A Level H2 Econs Practice Paper 4, HY3 Exam version, with questions, answers, and A Level-style practice for Singapore students.
These static practice materials are generated from the site's syllabus and paper-generation workflow, with source and model context shown so students and parents can evaluate the material before use.
Questions
Free quiz and exam paper access
Enter your details to view this paper
Your access is remembered on this device.
Answers
Answer Key – TuitionGoWhere Practice Paper (Microeconomics) Version 4
Total Marks: 80
Section A (28 marks)
Q1 [2 marks]
Opportunity cost is the next best alternative forgone when a consumer makes a choice due to scarcity.
Teaching note: Consumers have limited income; choosing one good means giving up another. Define clearly from consumer perspective.
Marking: 1 mark for definition of OC, 1 mark for consumer context.
Q2 [3 marks]
- Draw final good market (EV): D shifts right → higher P and Q.
- Lithium is an input (derived demand): increased EV output raises demand for lithium → D_lithium shifts right → higher P and Q.
Teaching note: Derived demand = demand for input from demand for final good. Show two diagrams.
Marking: 1 mark diagram final good, 1 mark diagram lithium, 1 mark explanation of link.
Q3 [3 marks]
Midpoint formula: PED = [(Q2-Q1)/((Q1+Q2)/2)] / [(P2-P1)/((P1+P2)/2)]
= [(140-100)/120] / [(8-10)/9] = (40/120) / (-2/9) = (0.333) / (-0.222) = -1.5
Absolute PED = 1.5 (elastic).
Teaching note: Use midpoint to avoid base bias. Negative sign shows inverse relation; report magnitude.
Marking: 1 mark formula, 1 mark substitution, 1 mark correct value.
Q4 [2 marks]
The price mechanism signals where resources are needed: rising prices indicate shortage and attract producers; falling prices indicate surplus and signal exit.
Marking: 1 mark signalling definition, 1 mark example.
Q5 [3 marks]
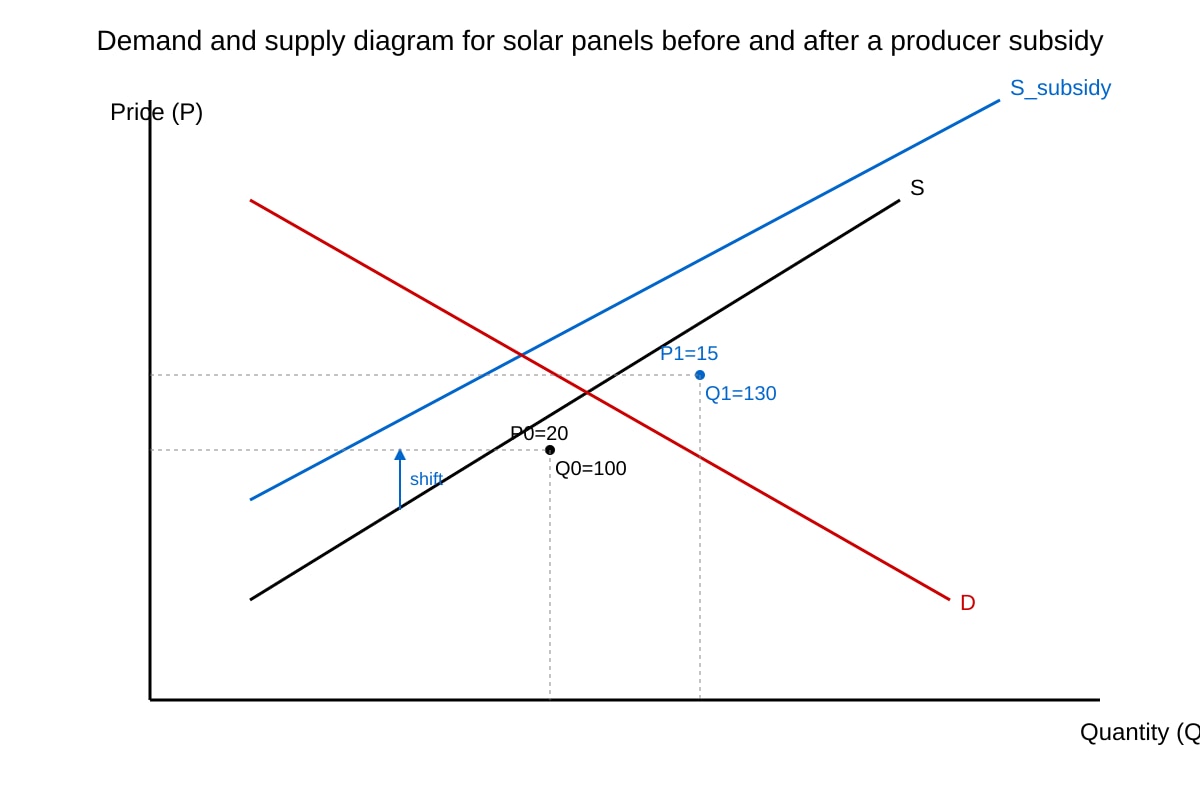
Subsidy shifts S right to S_subsidy. Equilibrium price falls P0→P1, quantity rises Q0→Q1. Producer receives P1+subsidy.
Image features: D and S at (100,20); S_subsidy rightward; new eq (130,15).
Marking: 1 mark diagram shift, 1 mark P fall, 1 mark Q rise.
Q6 [2 marks]
Movement along: caused by change in own price (extension/contraction). Shift: caused by non-price determinant (e.g. income, technology) changing demand at each price.
Marking: 1 mark each.
Q7 [3 marks]
Oligopoly firms compete via non-price methods: matching promotions (to avoid price war), heavy advertising, product differentiation. They are interdependent.
From extract: 3 providers match data plans, advertise, avoid price cuts.
Marking: 1 mark identification of oligopoly competition, 2 marks applied to extract.
Section B (28 marks)
Q8 [3 marks]
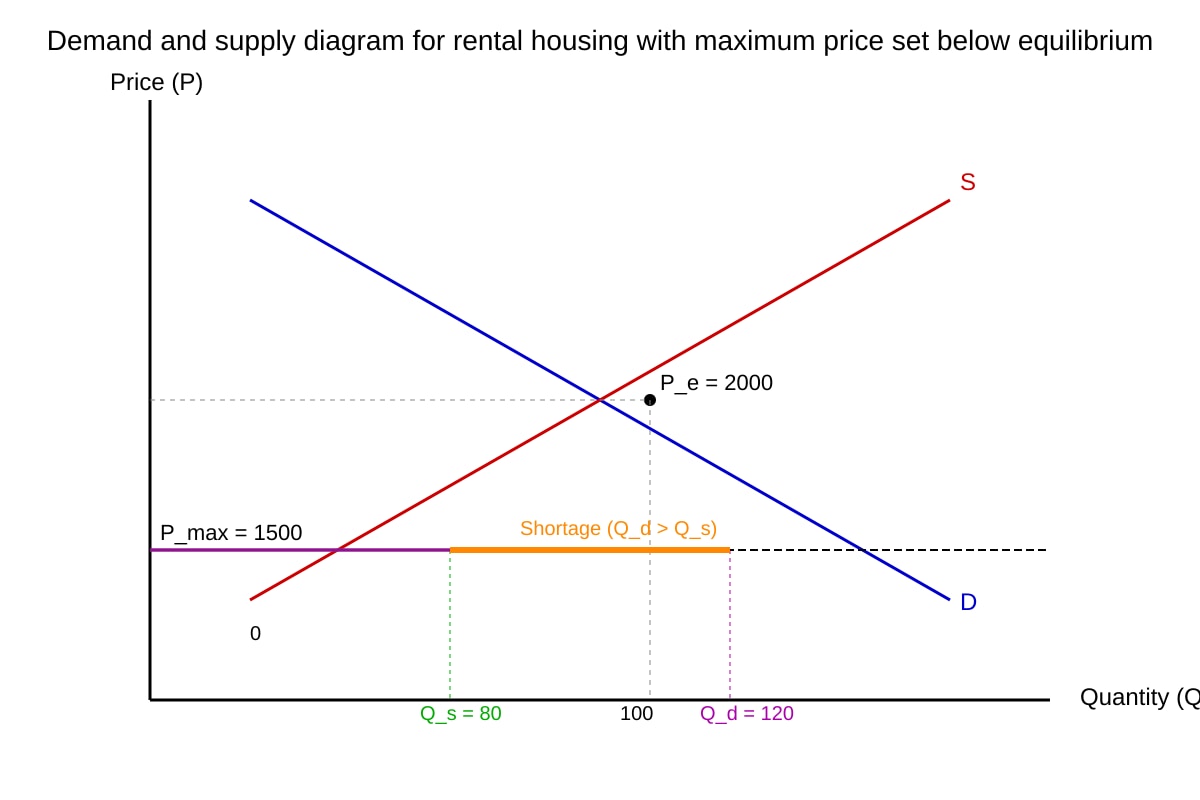
Max price below P_e causes Q_d > Q_s → shortage. Diagram shows horizontal line at P_max, gap = shortage.
Image: P_e=2000, P_max=1500, Q_d=120, Q_s=80.
Marking: 1 mark diagram, 1 mark shortage identified, 1 mark explanation.
Q9 [3 marks]
If PED inelastic, consumers bear more tax incidence (price rises more, quantity falls little). If elastic, producers bear more (must absorb to keep sales).
Marking: 1 mark link to elasticity, 2 marks explanation of inelastic/elastic cases.
Q10 [2 marks]
XED = +2.5 → substitutes (positive cross elasticity means as price of Y rises, demand for X rises).
Marking: 1 mark substitutes, 1 mark explanation.
Q11 [8 marks]
Content points:
- Carbon tax internalises negative externality (AO1/AO3).
- Producers pass cost → consumers face higher prices (regressive? depends on share).
- Emissions fall 20% (env. improvement) but consumer surplus falls.
- Small open economy: firms may relocate (carbon leakage) if not global tax.
- Evaluation: net welfare gain if MSC corrected > consumer loss; need recycling of revenue.
Marking descriptors: 2 marks data use, 3 marks analysis of effects, 3 marks evaluation/judgment.
Q12 [4 marks]
At P=5: Qd=100-50=50, CS = 0.5*(10-5)50 = 125.
At P=8: Qd=100-80=20, CS = 0.5(10-8)*20 = 20.
Teaching: CS triangle between demand curve and price.
Marking: 2 marks before, 2 marks after.
Q13 [2 marks]
- Quota gives certainty on quantity (tax uncertain effect).
- Quota protects domestic industry directly; politically clearer.
Marking: 1 mark each.
Q14 [3 marks]
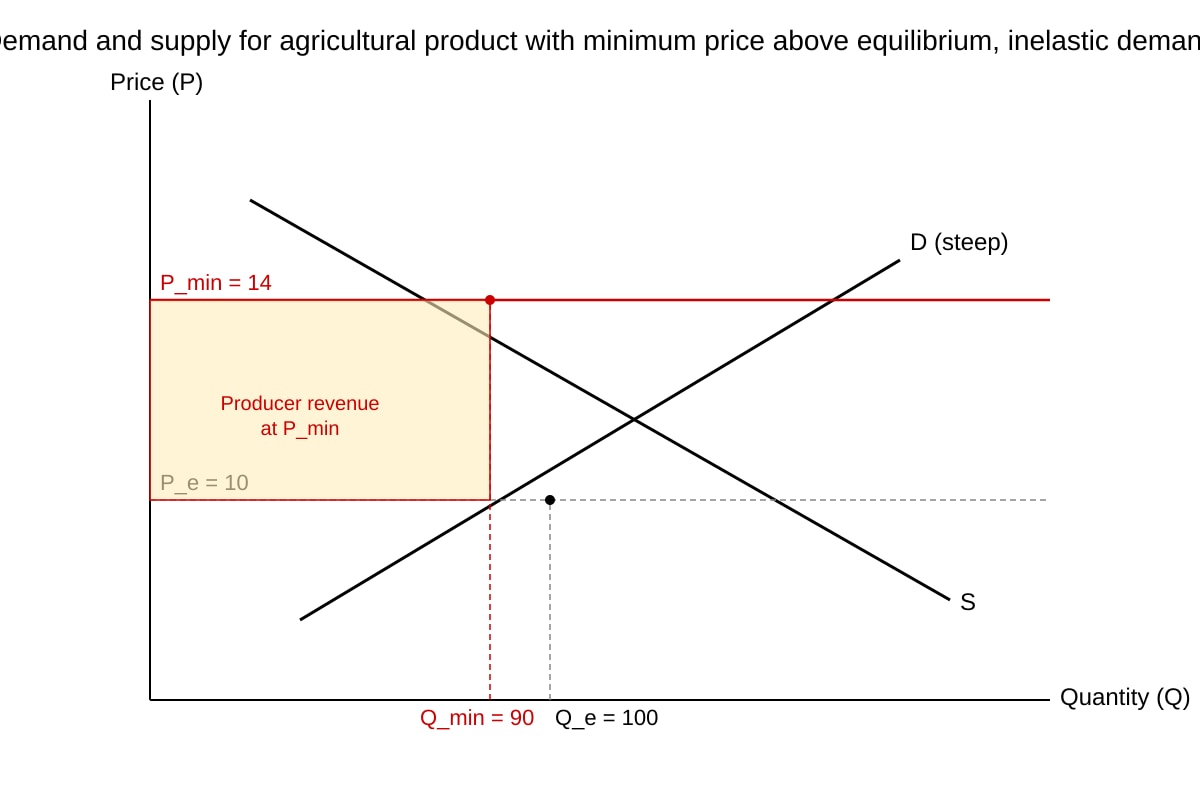
Min price above eq → Q falls slightly (inelastic D). P rises more → producer revenue = P*Q rises. Diagram shows area.
Image: D steep, P_min=14, Q_min=90 vs P_e=10,Q_e=100 → revenue up.
Marking: 1 mark diagram, 1 mark inelastic note, 1 mark revenue outcome.
Section C (24 marks)
Q15 [15 marks]
Essay: Discuss merger of ride-hailing firms.
- Define market structure pre/post (duopoly → monopoly).
- Pro: economies of scale, lower costs, better tech, uniform service.
- Con: higher prices, reduced choice, lower consumer surplus, deadweight loss.
- Diagram: CS before/after.
- Evaluation: if efficiency gains > price rise, consumers may benefit; depends on regulation.
Marking: 10 marks analysis (incl diagram), 5 marks evaluation.
Q16 [8 marks]
- Consumer choice affects demand (AO1).
- But market failure: info asymmetry, externalities, income constraint.
- Individual action insufficient; need EPR, bans, education.
- Conclude: both roles needed.
Marking: 2 marks role of consumer, 4 marks limitations, 2 marks judgment.
Q17 [3 marks]
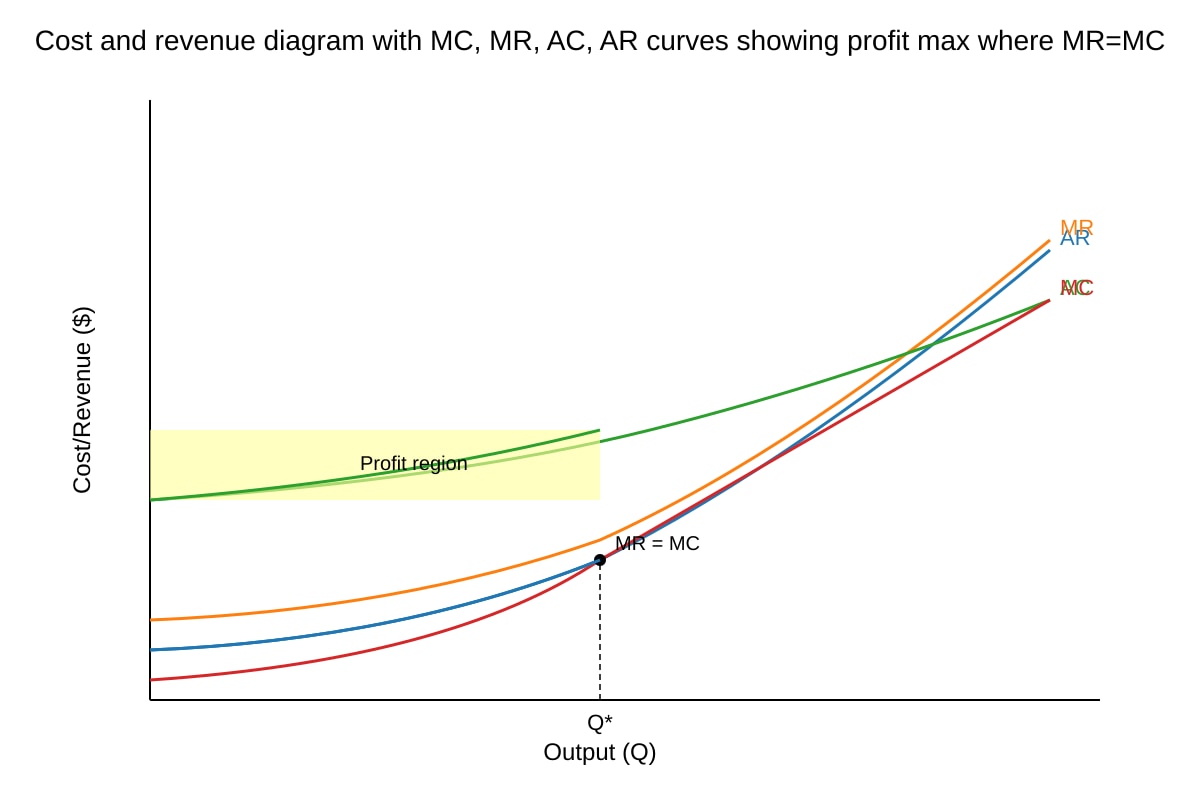
Profit max where MR=MC and MC rising. Beyond Q* MC>MR reduces profit. Diagram shows Q*.
Image: MR=MC at Q*, MC rising.
Marking: 1 mark condition, 1 mark diagram, 1 mark explanation.
Q18 [2 marks]
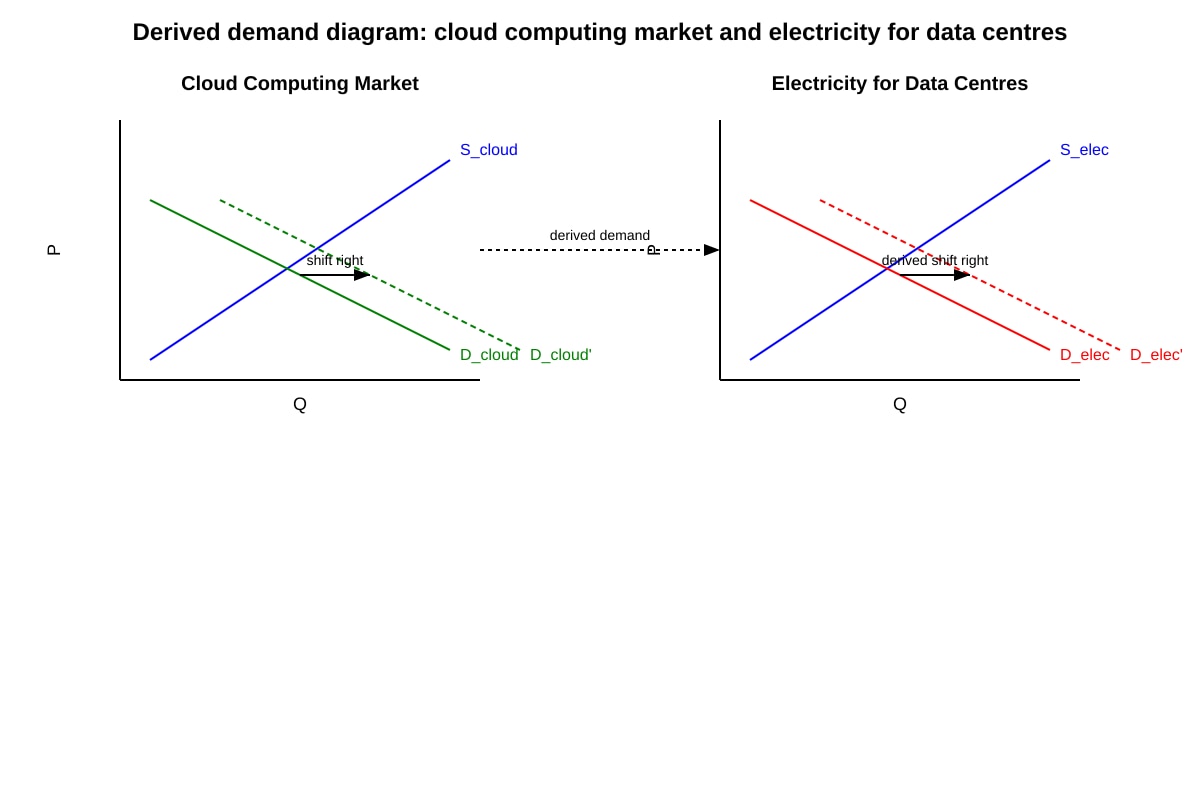
Cloud demand ↑ → derived demand for electricity ↑ → D_elec right → P,Q ↑. Two diagrams linked.
Marking: 1 mark diagram, 1 mark explanation.
Q19 [2 marks]
e.g. (1) Technology: better tech shifts S right. (2) Cost of production: lower cost shifts S right.
Marking: 1 mark each.
Q20 [15 marks]
Assess price discrimination for monopolist.
- Define PD (1st/2nd/3rd degree).
- Increases revenue by capturing CS if segments separable.
- Not always best: needs market power, no arbitrage, info.
- Alternatives: advertising, quality differentiation.
- Evaluation: best if conditions met; else costly.
Marking: 10 marks analysis, 5 marks evaluation.
End of Answer Key