From Real Exams Exam Paper
A Level H2 Economics Practice Paper 3
Free A Level H2 Econs Practice Paper 3, HY3 Exam version, with questions, answers, and A Level-style practice for Singapore students.
These static practice materials are generated from the site's syllabus and paper-generation workflow, with source and model context shown so students and parents can evaluate the material before use.
Questions
TuitionGoWhere Practice Paper - Economics H2 A-Level (Version 3)
School: TuitionGoWhere Exam Practice (AI)
Subject: Economics H2
Level: A-Level
Paper: Practice Paper (Microeconomics Topic Quiz)
Version: 3 of 5
Duration: 90 minutes
Total Marks: 60
Name: ___________________________
Class: ___________________________
Date: ___________________________
Instructions
- This practice paper contains 20 questions on Microeconomics (Theme 2.1 Price Mechanism and Applications, and related micro concepts).
- Section A: Short Structured Questions (Questions 1–10) — 20 marks
- Section B: Data and Diagram Response (Questions 11–15) — 20 marks
- Section C: Extended Response and Evaluation (Questions 16–20) — 20 marks
- Write your answers in the spaces provided. Use diagrams where requested and label them clearly.
- Marks for each question are shown in brackets [ ].
Section A: Short Structured Questions (20 marks)
1. Define the term "opportunity cost" from the perspective of a consumer. [2]
2. State two functions of the price mechanism in allocating scarce resources. [2]
(i) _______________________________________________________
(ii) _______________________________________________________
3. Explain the difference between a movement along a demand curve and a shift in the demand curve. [2]
4. Given the demand schedule below, calculate the price elasticity of demand (PED) when price rises from 4to5 using the midpoint formula. Show your working. [3]
| Price ($) | Quantity Demanded |
|---|---|
| 4 | 100 |
| 5 | 80 |
Working: _______________________________________________
PED = _______________
5. A good has an income elasticity of demand (YED) of –0.6. State whether it is a normal or inferior good, and explain what happens to quantity demanded when consumer income rises by 10%. [2]
6. Explain how a per-unit subsidy on producers affects the supply curve. [2]
7. With reference to the table, calculate the consumer surplus at the equilibrium price of 3ifthemaximumwillingnesstopayforthe10thunitis6. [2]
| Price ($) | Quantity Demanded | Quantity Supplied |
|---|---|---|
| 3 | 10 | 10 |
| 6 | 4 | 14 |
Consumer surplus = _______________
8. State one reason why a government may impose a maximum price on a necessity. [1]
9. Define cross elasticity of demand (XED) and state the sign of XED for two substitute goods. [2]
10. A firm produces where MR = MC and MC is rising. State the firm's objective being satisfied at this output. [1]
Section B: Data and Diagram Response (20 marks)
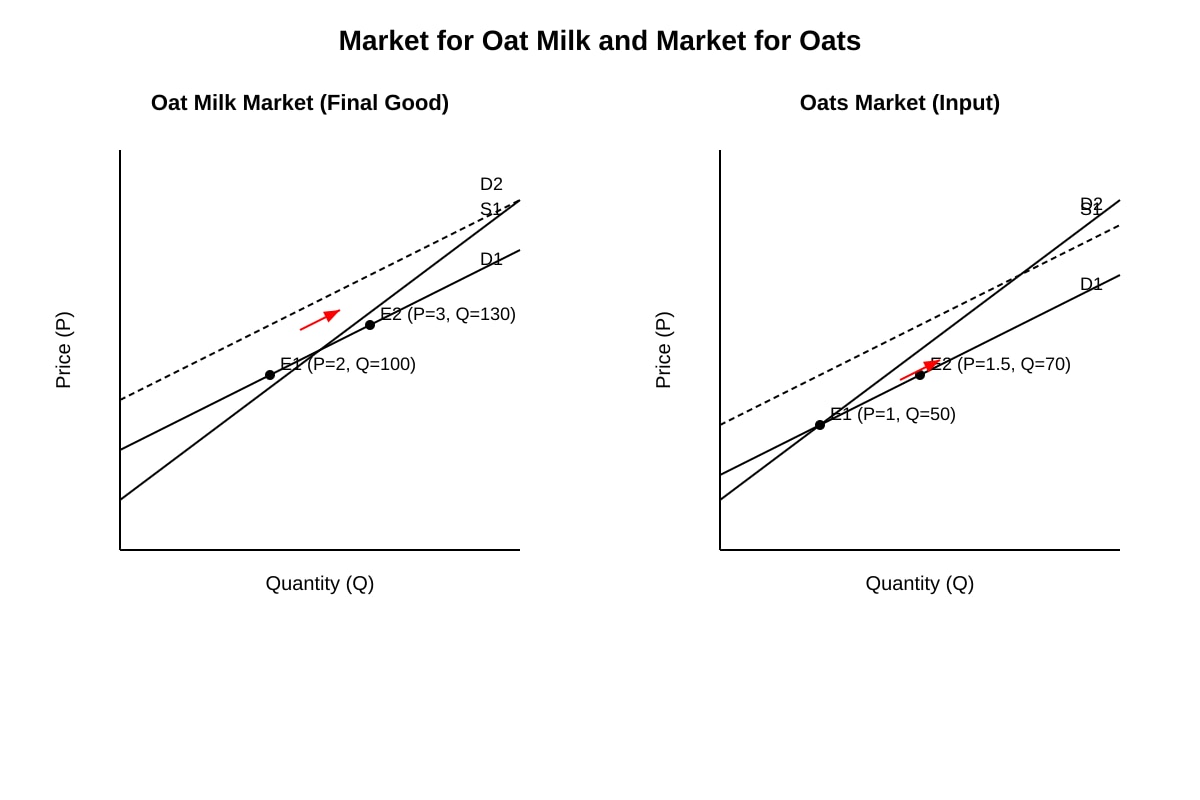
11. With reference to Extract 1 below, use a demand and supply diagram to explain how a rise in health awareness increases the demand for oat milk and affects the market for oats (an input). [4]
Extract 1: A national survey shows a 20% increase in consumers choosing plant-based milk for health reasons over the past year.
Image pending generation: diagram for Q11.
Diagram and explanation: ___________________________________
12. Using the data in Table 1, compare the percentage change in quantity demanded for Good X and Good Y when price increases by 10%, given PED(X) = 0.4 and PED(Y) = 1.2. [3]
| Good | PED | Price Change |
|---|---|---|
| X | 0.4 | +10% |
| Y | 1.2 | +10% |
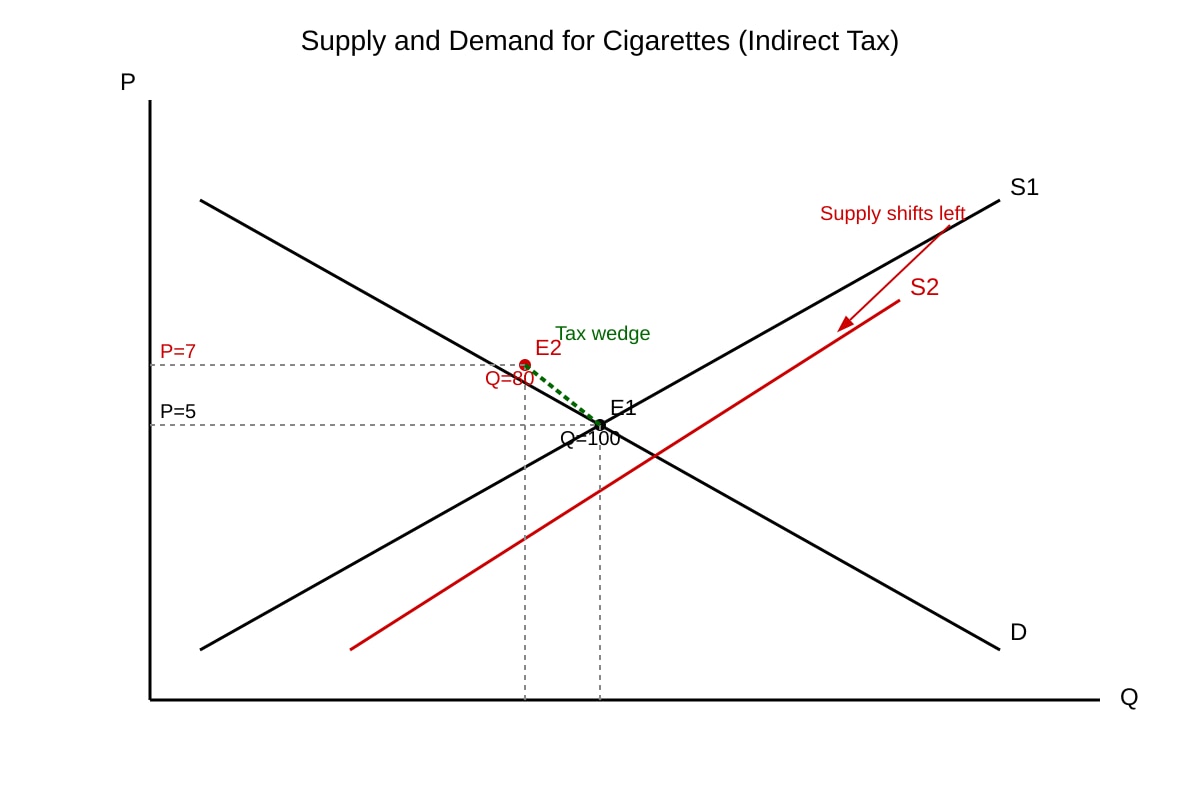
13. With the aid of a diagram, explain how a specific indirect tax on cigarettes leads to a change in equilibrium price and quantity. [4]
Image pending generation: diagram for Q13.
Diagram and explanation: ___________________________________
14. Extract 2 states that ride-hailing firms in an oligopoly use both price and non-price competition. Explain two forms of non-price competition used. [3]
Extract 2: Firms compete through driver incentives, app features, and loyalty rewards.
15. Calculate the producer surplus after a quota reduces supply from 100 to 70 units at a price floor of 4,ifcostofproductionisconstantat2 per unit. Show working. [6]
Working: _______________________________________________
Producer surplus = _______________
Section C: Extended Response and Evaluation (20 marks)
16. "Discuss whether the merger of two leading supermarket chains in Singapore will benefit consumers." [4]
17. Evaluate the statement: "Consumers should alone choose to avoid single-use plastics; market forces will solve the pollution problem." [4]
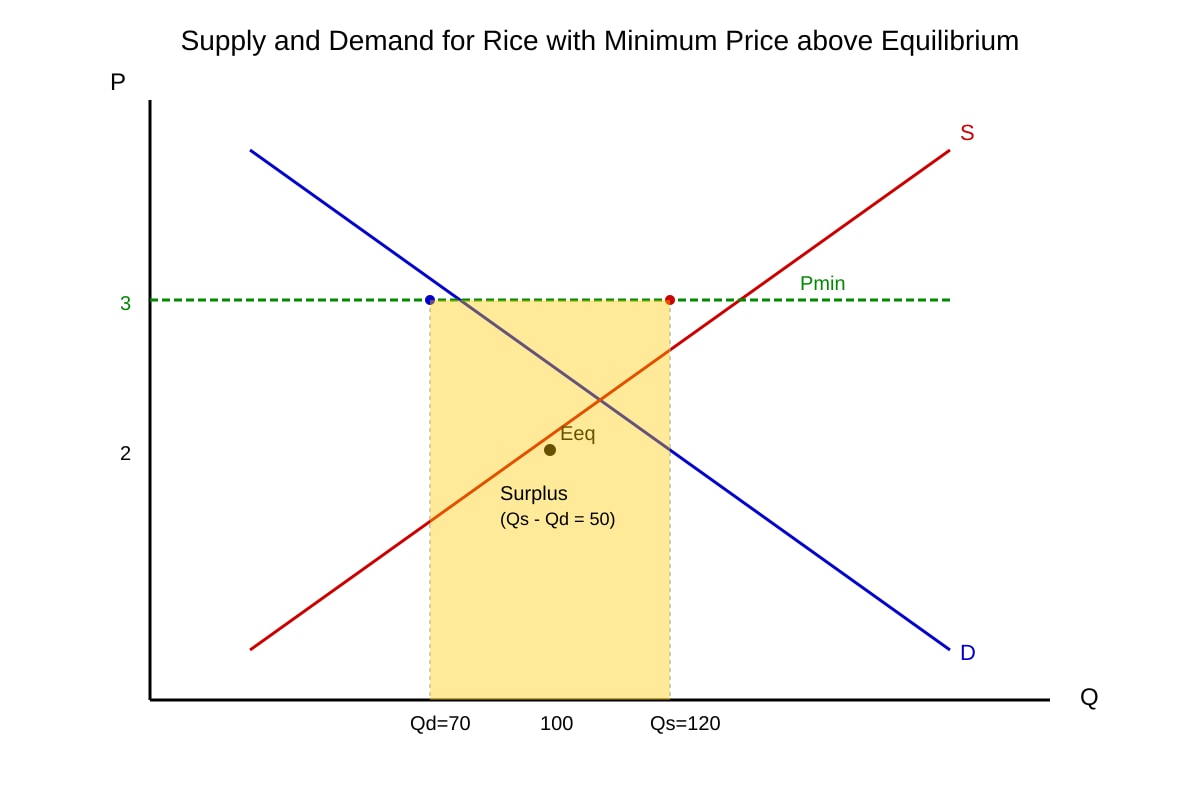
18. Using a diagram, explain how a minimum price for rice above equilibrium affects consumer and producer surplus, and discuss one unintended consequence. [4]
Image pending generation: diagram for Q18.
19. Discuss whether price discrimination is the best strategy for a streaming firm to increase revenue. [4]
20. With reference to Extract 3, assess whether government intervention in the local taxi market necessarily improves consumer outcomes. [4]
Extract 3: Ride-hailing entry lowered fares but raised concerns on driver welfare; government considers minimum fare rules.
End of Paper
Answers
Answer Key – TuitionGoWhere Practice Paper Economics H2 A-Level (Version 3)
Total Marks: 60
Topic: Microeconomics
Version: 3 of 5
Section A: Short Structured Questions
1. [2 marks]
Opportunity cost is the value of the next best alternative forgone when a consumer makes a choice due to scarcity.
Teaching note: Consumer has limited income; choosing one good means giving up another. Define clearly from consumer perspective.
Marking: 1 mark for scarcity/choice link, 1 mark for next best alternative forgone.
2. [2 marks]
(i) Signalling function – prices signal where resources are needed.
(ii) Incentive function – prices incentivise producers/consumers. (Rationing also accepted.)
Teaching note: Price mechanism coordinates via these three functions.
3. [2 marks]
Movement along demand curve is caused by a change in the good's own price (quantity demanded changes). Shift in demand curve is caused by non-price determinants (e.g. income, tastes) changing demand at each price.
Common mistake: Confusing own-price with income.
4. [3 marks]
Midpoint formula:
%ΔQ = (80−100) / ((100+80)/2) = −20 / 90 = −0.2222
%ΔP = (5−4) / ((4+5)/2) = 1 / 4.5 = 0.2222
PED = |−0.2222 / 0.2222| = 1.0 (using absolute value) or −1.0.
Marking: 1 for Q change, 1 for P change, 1 for final PED.
5. [2 marks]
Inferior good (YED negative). When income rises by 10%, quantity demanded falls by 6% (0.6 × 10%).
Teaching note: Inferior goods: demand falls as income rises.
6. [2 marks]
A per-unit subsidy lowers cost of production, shifting supply curve rightward (increase in supply at each price).
7. [2 marks]
Consumer surplus = (Max WTP − Eq Price) × Eq Q for linear approx = (6−3) × 10 = $30.
Marking: 1 for method, 1 for answer.
8. [1 mark]
To make necessity affordable for low-income households / prevent prices rising too high.
9. [2 marks]
XED = %ΔQd of A / %ΔP of B. For substitutes, XED > 0 (positive).
Teaching note: Substitutes: price of B up → demand A up.
10. [1 mark]
Profit maximisation.
Section B: Data and Diagram Response
11. [4 marks]
Diagram: left oat milk D shifts right (D1→D2), P and Q rise. Right oats (input) derived demand shifts right, P and Q rise.
Explanation: Health awareness ↑ demand oat milk → firms produce more → derived demand for oats ↑ → oats price/quantity ↑.
Marking: 2 for diagrams labelled, 2 for explanation chain.
12. [3 marks]
%ΔQd X = PED × %ΔP = 0.4 × 10% = 4% fall.
%ΔQd Y = 1.2 × 10% = 12% fall.
Y falls more (elastic).
Marking: 1 each for X, Y, comparison.
13. [4 marks]
Diagram: S left (S1→S2), P ↑ Q ↓. Tax wedge = difference.
Explanation: Tax raises marginal cost, supply falls, equilibrium moves up left.
Marking: 2 diagram, 2 explanation.
14. [3 marks]
Non-price: (1) App feature improvement (e.g. safety); (2) Loyalty rewards / driver incentives.
Marking: 1.5 each.
15. [6 marks]
At quota Q=70, price floor 4,cost2.
Producer surplus = (P − cost) × Q = (4−2) × 70 = $140.
Marking: 2 working, 2 answer, 2 context (quota).
Teaching note: PS is area above supply curve below price.
Section C: Extended Response and Evaluation
16. [4 marks]
Benefits: economies of scale → lower prices, more efficiency. Disadvantages: reduced competition → higher prices, less choice. Balanced judgment needed.
Marking descriptors: 2 for analysis both sides, 2 for evaluation/conclusion.
17. [4 marks]
Consumer choice helps demand for plastics fall (market). But market failure: externality, info asymmetry. Need gov regulation. Balanced.
Marking: 2 points for, 2 against/eval.
18. [4 marks]
Diagram: Pmin above E, Qd<Qs (surplus). CS falls, PS may rise for those who sell. Unintended: excess supply / gov buys surplus.
Marking: 2 diagram, 2 consequence.
19. [4 marks]
Price discrimination (1st/2nd/3rd degree) can raise revenue by capturing surplus. But needs market power, no resale. Alternatives: advertising. Eval.
Marking: 2 method, 2 eval.
20. [4 marks]
Extract: ride-hailing lowered fares (benefit) but min fare may raise fares (cost). Intervention not necessarily improve welfare; depends on weighting.
Marking: 2 use extract, 2 evaluation.
End of Answer Key
Free quiz and exam paper access
Enter your details to view this paper
Your access is remembered on this device.