From Real Exams Exam Paper
A Level H2 Economics Practice Paper 2
Free A Level H2 Econs Practice Paper 2, HY3 Exam version, with questions, answers, and A Level-style practice for Singapore students.
These static practice materials are generated from the site's syllabus and paper-generation workflow, with source and model context shown so students and parents can evaluate the material before use.
Questions
Free quiz and exam paper access
Enter your details to view this paper
Your access is remembered on this device.
Answers
Answer Key: TuitionGoWhere Practice Paper - Economics H2 A-Level (Version 2)
Section A: Short Structured (16 marks)
Q1 (2m): The signalling function means that changes in price send information to consumers and producers about scarcity. A rising price signals relative scarcity and encourages producers to produce more while consumers reduce consumption.
Marking: 1m for definition of signalling, 1m for example of price change conveying info.
Q2 (2m): A movement along the demand curve is caused by a change in the good's own price; a shift in demand is caused by a non-price determinant (e.g. income, tastes).
Marking: 1m each correct distinction.
Q3 (2m): Consumer surplus is the difference between what a consumer is willing to pay and what they actually pay. It measures net benefit to consumers.
Marking: 1m definition, 1m reference to willingness vs actual payment.
Q4 (2m): Example: tea and coffee are substitutes. XED is positive because as price of coffee rises, demand for tea increases.
Marking: 1m valid substitute pair, 1m correct sign (positive).
Q5 (2m): A per-unit subsidy lowers producers' costs, shifting the supply curve to the right (increase in supply).
Marking: 1m cost reduction, 1m rightward shift.
Q6 (2m): Profit max where MR = MC. Marginal cost is the additional cost of producing one more unit of output.
Marking: 1m condition, 1m MC definition.
Q7 (2m): A maximum price below equilibrium creates a shortage (excess demand) as quantity demanded exceeds quantity supplied.
Marking: 1m below eq, 1m shortage stated.
Q8 (2m): Example: externalities (e.g. cigarette smoke) – consumer choice imposes cost on third parties not reflected in price.
Marking: 1m identify, 1m explanation.
Section B: Data and Diagram (24 marks)
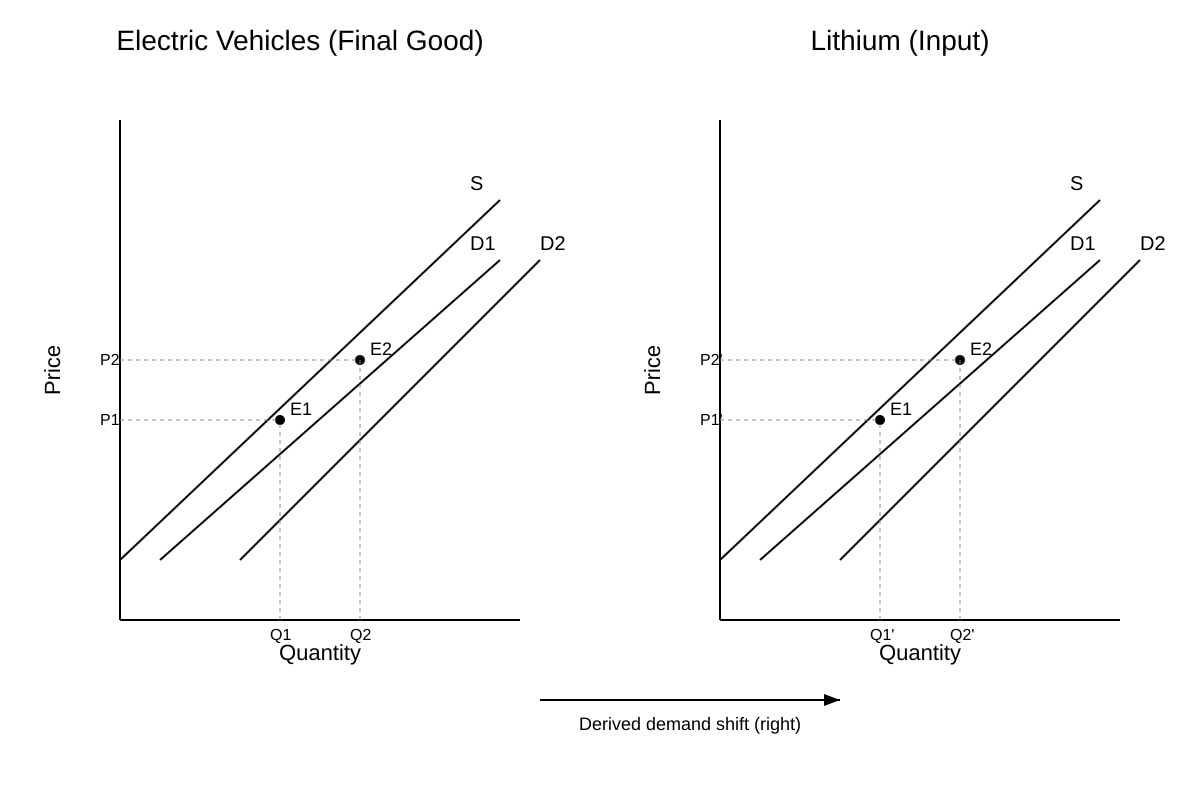
Q9 (4m): Diagram: left EV market D shifts right → higher P,Q. Right lithium market derived D shifts right → higher P,Q.
Working: EV demand ↑ → more EVs produced → derived demand for lithium ↑ → lithium eq P and Q rise.
Marking: 2m diagrams correct with labels, 2m explanation of derived demand chain.
Q10 (3m):
%ΔQ = (60−80)/80 ×100 = −25%
%ΔP = (5−4)/4 ×100 = +25%
PED = |−25/25| = 1.0 (unit elastic)
Marking: 1m for each calculation step, final answer 1.0.
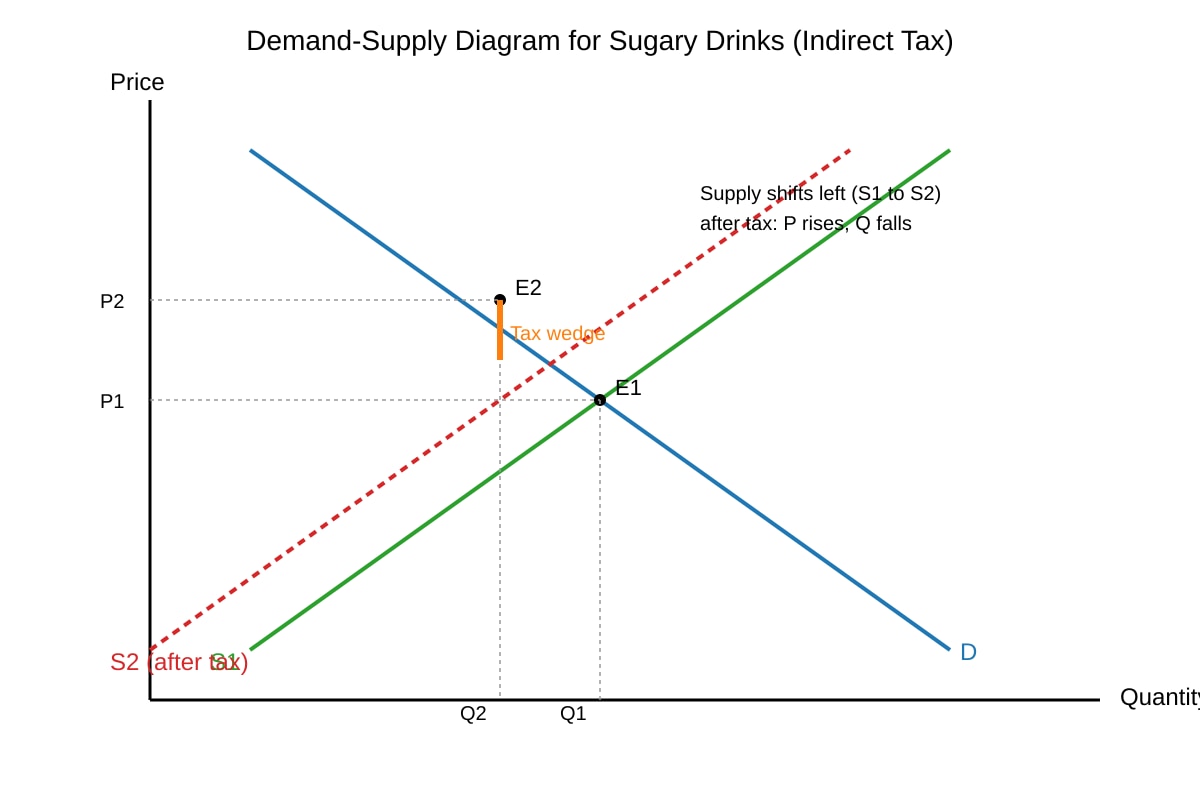
Q11 (4m): Tax shifts S left from S1 to S2. Eq P rises P1→P2, Q falls Q1→Q2. Burden shared depending on elasticities.
Marking: 2m diagram with shift and labels, 2m explanation of new eq.
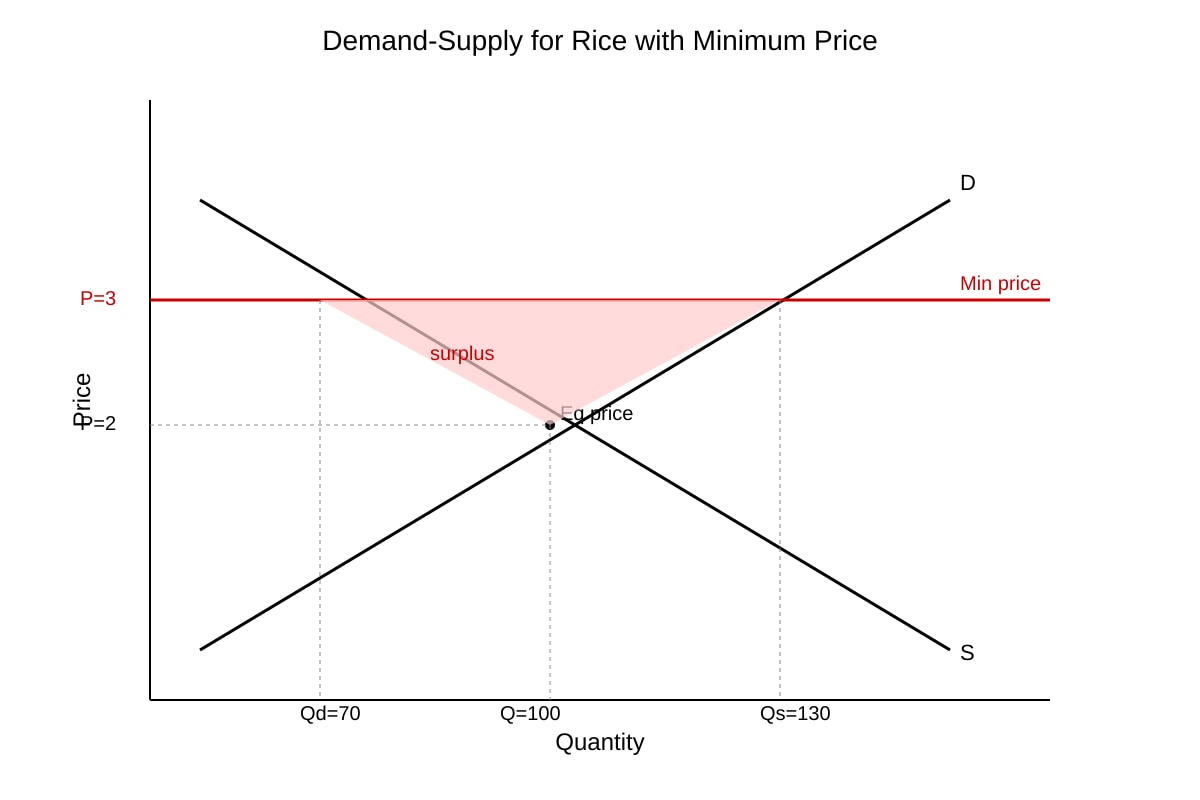
Q12 (3m): Before min price, CS is area under D above P1. After min price at P3, CS is smaller (only Qd bought) and surplus stock exists.
Marking: 1m before, 1m after, 1m diagram reference.
Q13 (4m): (1) Time to build new houses – long construction lag. (2) Land scarcity limits quick supply response.
Marking: 2m each reason with elaboration.
Q14 (6m): Info asymmetry: dealers know more → buyers risk lemons. 6/10 cannot verify → pay higher price for poor quality. Govt intervention (regulation) may be needed.
Marking: 2m identify asymmetry, 2m apply extract, 2m consequence for consumers.
Section C: Extended (20 marks)
Q15 (8m): For: economies of scale, lower prices, better tech. Against: reduced competition, higher prices, less choice. Use CS diagram. Conclusion: ambiguous, depends on regulation.
Marking: 4m for/against points, 2m diagram, 2m balanced conclusion.
Q16 (6m): Consumer role yes, but market failure (externalities, info) means solo responsibility insufficient. Need govts/ producers.
Marking: 2m consumer role, 2m limitations, 2m evaluation.
Q17 (6m): Not always: needs market power, separable groups, no resale. Other strategies (advertising) may work better.
Marking: 2m conditions for PD, 2m limitations, 2m alternative view.