From Real Exams Exam Paper
A Level H2 Economics Practice Paper 1
Free A Level H2 Econs Practice Paper 1, LongCat Exam version, with questions, answers, and A Level-style practice for Singapore students.
These static practice materials are generated from the site's syllabus and paper-generation workflow, with source and model context shown so students and parents can evaluate the material before use.
Questions
TuitionGoWhere Practice Paper - Economics H2 A-Level
TuitionGoWhere Secondary School (AI)
| Subject: | Economics H2 |
| Level: | A-Level |
| Paper: | Practice Paper 1 — Microeconomics |
| Version: | 1 of 5 |
| Duration: | 2 hours 15 minutes |
| Total Marks: | 60 |
| Name: | ________________________ |
| Class: | ________________________ |
| Date: | ________________________ |
Instructions
- Answer all questions in Section A and Section B.
- Write your answers in the spaces provided.
- The number of marks for each question or part-question is shown in brackets [ ].
- Begin each section on a fresh page.
- You are advised to spend approximately 45 minutes on Section A and 90 minutes on Section B.
- The total mark for this paper is 60.
Section A: Case Study (30 marks)
Read the following case study carefully and answer Questions 1–5.
The Singapore Ride-Hailing Market
In recent years, the ride-hailing market in Singapore has undergone significant consolidation. Grab, the dominant platform, has maintained a market share exceeding 80% following the exit of Uber from Southeast Asia in 2018. In 2023, the Competition and Consumer Commission of Singapore (CCCS) reviewed Grab's proposed acquisition of Trans-cab, a traditional taxi operator with approximately 2,600 taxis. The CCCS ultimately approved the acquisition subject to conditions, including fare caps and requirements to maintain service quality.
The ride-hailing market exhibits characteristics of a market with high barriers to entry. The network effects inherent in platform-based businesses mean that a larger user base attracts more drivers, which in turn attracts more passengers, creating a self-reinforcing cycle. New entrants such as Ryde and Tada have struggled to gain significant market share despite offering lower commission rates to drivers.
Fares on the Grab platform are determined algorithmically using dynamic pricing (commonly known as "surge pricing"). During peak hours, fares can increase by up to 2.5 times the base fare. Critics argue that this constitutes price discrimination that disadvantages lower-income commuters who have fewer transport alternatives during rush hours. Supporters counter that surge pricing efficiently allocates scarce driver supply and incentivises more drivers to be on the road during periods of high demand.
The Land Transport Authority (LTA) regulates the point-to-point transport industry through a licensing framework. All ride-hailing drivers must hold a Private Hire Car Driver's Vocational Licence (PDVL), which requires training and background checks. In 2024, the LTA introduced a new regulatory framework requiring ride-hailing platforms to contribute to a Driver Welfare Fund, which provides insurance and injury coverage for drivers.
Table 1: Singapore Ride-Hailing Market Data (2023)
| Indicator | Value |
|---|---|
| Total daily ride-hailing trips | 1.2 million |
| Grab market share (by trips) | 82% |
| Average fare per trip | $14.50 |
| Estimated price elasticity of demand for ride-hailing | −0.6 |
| Number of active ride-hailing drivers | 45,000 |
| Average driver monthly earnings | $4,200 |
| Annual growth rate of ride-hailing market | 8% |
Table 2: Comparison of Transport Modes in Singapore (2023)
| Mode | Average Trip Cost | Average Trip Time (mins) | Market Share |
|---|---|---|---|
| Ride-hailing | $14.50 | 18 | 22% |
| Traditional taxi | $13.80 | 19 | 8% |
| MRT/Bus | $1.40 | 32 | 58% |
| Private car | $8.20* | 15 | 12% |
*Includes fuel, parking, and ERP charges, excluding vehicle ownership costs.
Question 1
Using the data in Table 1, calculate the total daily revenue earned by ride-hailing drivers in Singapore in 2023. Show your working.
[3]
Question 2
(a) Using the concept of cross elasticity of demand, explain whether MRT/bus travel and ride-hailing services are likely to be substitutes or complements. Justify your answer with reference to the data in Table 2.
[4]
(b) The estimated price elasticity of demand for ride-hailing is −0.6. If Grab increases its average fare by 10%, calculate the expected percentage change in quantity demanded and explain the effect on Grab's total revenue. Show your working.
[4]
Question 3
Using a demand and supply diagram, explain how surge pricing during peak hours affects the ride-hailing market. In your answer, clearly label the equilibrium price and quantity before and after the demand increase, and the surge price.
[5]
Generated graph for Q3.
Question 4
The case study states that the ride-hailing market exhibits "high barriers to entry" and "network effects." Explain how these characteristics affect the market structure of the ride-hailing industry in Singapore. In your answer, identify the most appropriate market structure and explain two barriers to entry using evidence from the case study.
[5]
Question 5
"Grab's dominance in the ride-hailing market necessarily harms consumers."
Assess the extent to which you agree with this statement. In your answer, consider both the potential costs and benefits to consumers of Grab's market dominance, and discuss whether government intervention (such as the CCCS conditions on the Trans-cab acquisition) is justified.
[9]
Section B: Structured Response and Essay (30 marks)
Answer two questions from this section. Each question carries 15 marks.
Question 6
The Singapore government imposes a Certificate of Entitlement (COE) system to control the number of vehicles on the road. The COE grants the right to own and use a vehicle for 10 years, and COE prices have exceeded $100,000 for some vehicle categories.
(a) Using a demand and supply diagram, explain how the COE system affects the equilibrium price and quantity of new cars in Singapore.
[4]
(b) Discuss whether the COE system is the most effective policy for addressing the external costs of private car use in Singapore.
[11]
Question 7
In 2024, the global semiconductor industry experienced significant price increases due to supply chain disruptions and surging demand for AI-related chips. Singapore, as a major semiconductor manufacturing hub, saw its exports of electronic components rise by 15%.
(a) Explain the possible causes of the rise in semiconductor prices using demand and supply analysis.
[4]
(b) Discuss whether the Singapore government should intervene in the semiconductor market to protect consumers from rising prices.
[11]
Question 8
"Price discrimination is always beneficial for firms but harmful for consumers."
Evaluate this statement with reference to a real-world example of price discrimination.
**[15]]
End of Paper
Mark Summary
| Section | Question | Marks |
|---|---|---|
| A: Case Study | Q1 | 3 |
| Q2(a) | 4 | |
| Q2(b) | 4 | |
| Q3 | 5 | |
| Q4 | 5 | |
| Q5 | 9 | |
| Section A Total | 30 | |
| B: Structured/Essay | Q6 (a+b) | 15 |
| Q7 (a+b) | 15 | |
| Q8 | 15 | |
| Section B Total (best 2 of 3) | 30 | |
| Total | 60 |
Answers
TuitionGoWhere Practice Paper — Economics H2 A-Level
Answer Key — Practice Paper 1, Version 1 of 5
Section A: Case Study
Question 1 [3 marks]
Question: Using the data in Table 1, calculate the total daily revenue earned by ride-hailing drivers in Singapore in 2023.
Answer:
Total daily revenue = Total daily trips × Average fare per trip
Total daily revenue = 1,200,000 × $14.50
Total daily revenue = 17,400,000(or17.4 million)
Mark scheme:
- Correct formula/identification of data: 1 mark
- Correct substitution: 1 mark
- Correct final answer with units ($): 1 mark
Teaching note: Total revenue is calculated as price (average fare) multiplied by quantity (number of trips). This is a fundamental concept in microeconomics. Students must read the table carefully to extract the correct figures. A common mistake is to multiply by the number of drivers instead of the number of trips.
Question 2(a) [4 marks]
Question: Using the concept of cross elasticity of demand, explain whether MRT/bus travel and ride-hailing services are likely to be substitutes or complements. Justify your answer with reference to the data in Table 2.
Answer:
MRT/bus travel and ride-hailing services are likely to be substitutes.
Explanation:
The cross elasticity of demand (XED) measures the responsiveness of the demand for one good to a change in the price of another good. For substitutes, XED is positive — when the price of one good rises, demand for the other rises.
From Table 2, we can observe that:
- Ride-hailing has an average trip cost of $14.50 and a trip time of 18 minutes.
- MRT/bus has an average trip cost of $1.40 and a trip time of 32 minutes.
Both modes serve the same fundamental purpose — transporting passengers from origin to destination. They compete for the same commuters, as shown by their combined market share of 80% (22% + 58%). When ride-hailing fares increase (e.g., during surge pricing), some commuters switch to MRT/bus, and vice versa. This positive relationship between the price of one and the demand for the other confirms they are substitutes.
The relatively large price difference (14.50vs1.40) also suggests that the cross elasticity may be significant — a small percentage increase in MRT fares could cause a proportionally larger shift to ride-hailing for time-sensitive commuters.
Mark scheme:
- Correct identification as substitutes: 1 mark
- Definition/explanation of cross elasticity of demand: 1 mark
- Explanation of why XED is positive for substitutes: 1 mark
- Reference to data from Table 2 to support the argument: 1 mark
Common mistake: Students may confuse cross elasticity with price elasticity of demand. XED relates to the relationship between two goods, not the relationship between price and quantity of the same good.
Question 2(b) [4 marks]
Question: The estimated price elasticity of demand for ride-hailing is −0.6. If Grab increases its average fare by 10%, calculate the expected percentage change in quantity demanded and explain the effect on Grab's total revenue.
Answer:
Step 1: Apply the PED formula
PED=%ΔP%ΔQd
−0.6=+10%%ΔQd
%ΔQd=−0.6×10%=−6%
The quantity demanded will fall by 6%.
Step 2: Effect on total revenue
When demand is price inelastic (PED between 0 and −1), a price increase leads to a smaller proportionate fall in quantity demanded. Therefore, total revenue will increase.
- Price increases by 10%
- Quantity demanded falls by only 6%
- Since the price rise proportionally exceeds the quantity fall, total revenue rises.
Numerical illustration:
- Original revenue: 14.50×1,200,000=17,400,000
- New price: 14.50×1.10=15.95
- New quantity: 1,200,000 × 0.94 = 1,128,000
- New revenue: 15.95×1,128,000=17,991,600
Total revenue increases by approximately $591,600 (or 3.4%).
Mark scheme:
- Correct formula: 1 mark
- Correct calculation of %ΔQd = −6%: 1 mark
- Correct identification that demand is price inelastic: 1 mark
- Correct conclusion that total revenue increases, with explanation: 1 mark
Teaching note: This question tests understanding of the relationship between PED and total revenue. The key insight is that when |PED| < 1, price and total revenue move in the same direction. Students should always state the PED value range and explain the logic, not just state the answer.
Question 3 [5 marks]
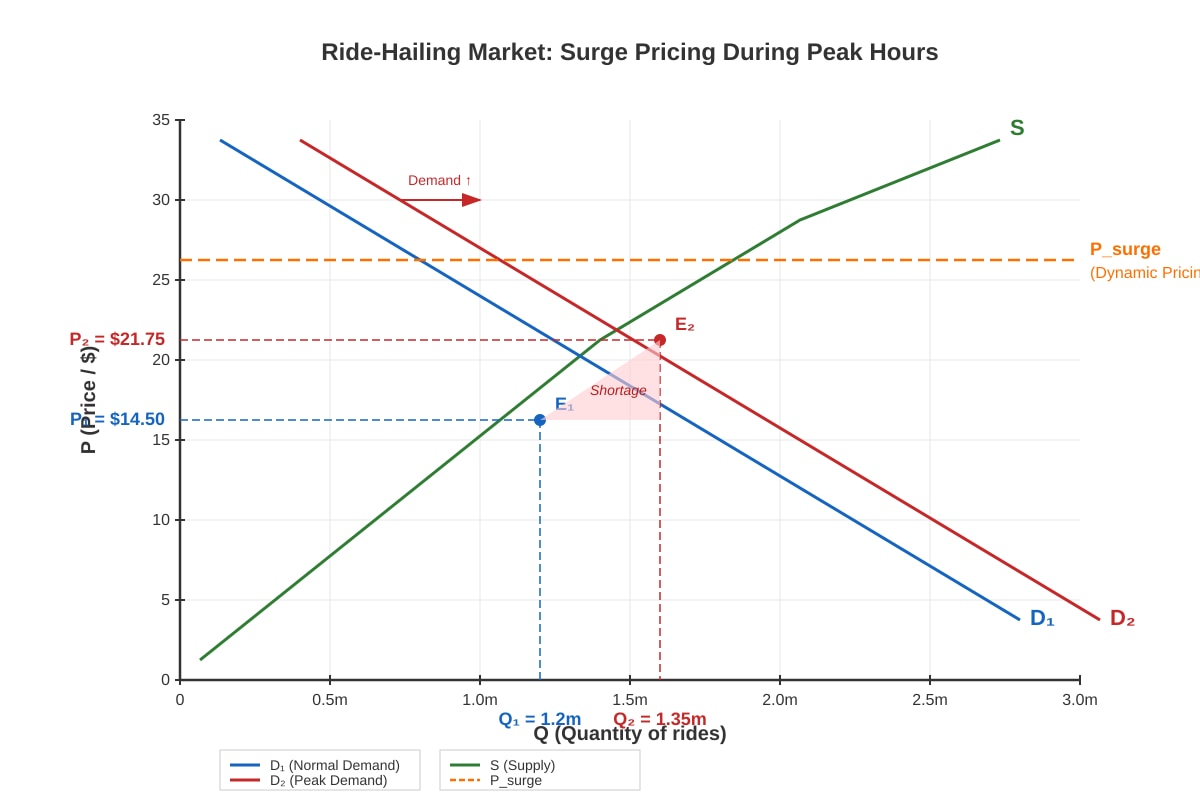
Question: Using a demand and supply diagram, explain how surge pricing during peak hours affects the ride-hailing market.
Answer:
Diagram explanation:
During peak hours (e.g., morning and evening rush hours), the demand for ride-hailing services increases as more commuters want rides. This is represented by a rightward shift of the demand curve from D1 to D2.
The supply of ride-hailing rides is relatively inelastic in the short run because the number of available drivers cannot increase instantly — drivers need time to get to high-demand areas, and there is a finite number of drivers on the platform at any given time.
As a result of the demand increase along an inelastic supply curve:
- The equilibrium price rises from P1 (14.50)toP2(surgeprice,e.g.,21.75 at 1.5× multiplier)
- The equilibrium quantity increases slightly from Q1 to Q2 (more drivers are incentivised to come online)
Surge pricing acts as the market mechanism that:
- Rations the limited supply of drivers among those willing to pay the higher price
- Incentivises more drivers to enter the market (shift along the supply curve)
- Reduces quantity demanded as some consumers switch to alternatives (MRT, bus)
Mark scheme:
- Correctly drawn and labelled demand and supply diagram: 1 mark
- Rightward shift of demand curve (D1 to D2) correctly shown: 1 mark
- New equilibrium at higher price and quantity correctly identified: 1 mark
- Explanation of surge pricing as a rationing mechanism: 1 mark
- Explanation of incentive effect on drivers / demand-side response: 1 mark
Expected diagram features (for image_placeholder Q3-fig1):
- Vertical axis: Price ($), Horizontal axis: Quantity of rides
- D1 (initial demand), D2 (peak demand), S (short-run supply — relatively steep)
- P1 = $14.50, P2 = surge price level, Q1 and Q2 labelled
- Equilibrium points E1 and E2 clearly marked
Common mistake: Students may draw a shift in supply rather than demand. The cause is increased commuter demand during peak hours, not a change in the number of drivers. Also, students should note that supply is relatively inelastic in the short run, which is why the price increase is significant.
Question 4 [5 marks]
Question: Explain how "high barriers to entry" and "network effects" affect the market structure of the ride-hailing industry in Singapore. Identify the most appropriate market structure and explain two barriers to entry.
Answer:
Market Structure: Oligopoly (tending towards monopoly)
The ride-hailing market in Singapore is best described as an oligopoly with monopolistic tendencies, or more specifically, a dominant firm market (Grab with 82% market share). It exhibits characteristics of monopoly due to Grab's overwhelming dominance, but the presence of smaller competitors (Ryde, Tada, traditional taxis) means it is not a pure monopoly.
Network effects:
Network effects occur when the value of a service increases as more people use it. In ride-hailing:
- More passengers on the platform → shorter waiting times → attracts more passengers
- More drivers on the platform → more earning opportunities → attracts more drivers
- This creates a positive feedback loop (virtuous cycle) that reinforces Grab's dominance
Network effects act as a significant barrier to entry because new entrants start with few users on both sides of the platform, making their service less attractive.
Two barriers to entry:
-
Network effects / first-mover advantage: Grab's established user base of both passengers and drivers creates a self-reinforcing advantage. New entrants like Ryde and Tada struggle to attract enough users to make their platform viable. This is an example of a natural barrier to entry arising from the platform-based business model.
-
High sunk costs and regulatory barriers: Ride-hailing platforms require significant investment in technology (app development, algorithms, data infrastructure), marketing, and driver acquisition. These are sunk costs that cannot be recovered if the firm exits. Additionally, the LTA licensing framework (PDVL requirements, Driver Welfare Fund contributions) adds regulatory compliance costs that disproportionately affect smaller new entrants.
Mark scheme:
- Correct identification of market structure (oligopoly/dominant firm): 1 mark
- Explanation of network effects with reference to the case study: 1 mark
- First barrier to entry clearly explained with case evidence: 1.5 marks
- Second barrier to entry clearly explained with case evidence: 1.5 marks
Common mistake: Students may simply state "monopoly" without justification. The market has multiple firms, so it is more accurate to describe it as an oligopoly with a dominant firm. Students should also avoid vague references to "barriers to entry" without specifying what they are and how they operate.
Question 5 [9 marks]
Question: "Grab's dominance in the ride-hailing market necessarily harms consumers." Assess the extent to which you agree with this statement.
Answer:
Introduction: Grab's 82% market share raises legitimate concerns about market power and consumer welfare. However, whether dominance "necessarily" harms consumers depends on how that market power is exercised and whether countervailing factors (competition from substitutes, regulation, efficiency gains) mitigate potential harm.
Arguments that Grab's dominance harms consumers:
-
Higher prices / allocative inefficiency: As a dominant firm, Grab may have the market power to set prices above marginal cost, leading to allocative inefficiency. Surge pricing during peak hours can result in fares 2.5 times the base fare, which may exploit consumers with limited alternatives. The price inelasticity of demand (PED = −0.6) means consumers have limited ability to switch, allowing Grab to increase revenue through price increases.
-
Reduced consumer choice: With 82% market share, Grab effectively sets the standard for service quality, commission rates, and driver terms. Smaller competitors have been unable to gain significant market share, reducing the diversity of options available to consumers.
-
Price discrimination: Dynamic pricing may disproportionately affect lower-income commuters who travel during peak hours (e.g., workers with inflexible schedules) and have fewer transport alternatives, raising equity concerns.
Arguments that Grab's dominance may not harm consumers (or may even benefit them):
-
Efficiency gains from economies of scale: Grab's large scale may enable it to achieve lower average costs through technological investment, better route optimisation, and more efficient matching of drivers to passengers. These efficiency gains could be passed on to consumers in the form of lower base fares or better service quality.
-
Network effects benefit consumers: A larger platform means shorter waiting times, better coverage, and more reliable service. Consumers benefit from the concentration of drivers and passengers on a single platform.
-
Competition from substitutes: The threat of substitution to MRT/bus (58% market share, $1.40 per trip), traditional taxis, and private car use constrains Grab's pricing power. The relatively affordable public transport system in Singapore provides a competitive check on Grab's market power.
-
Regulatory oversight: The CCCS conditions on the Trans-cab acquisition (fare caps, service quality requirements) and LTA licensing framework provide regulatory safeguards against the abuse of market power.
Evaluation / Conclusion: Grab's dominance does not "necessarily" harm consumers. While there are legitimate concerns about pricing power and consumer welfare, the presence of strong substitute competition (particularly public transport), regulatory oversight, and potential efficiency gains from scale mean that the net effect on consumers is ambiguous. The key factor is whether effective regulation ensures that Grab's market power is not abused. The CCCS's conditional approval of the Trans-cab acquisition suggests that Singapore's regulatory framework is capable of mitigating the worst outcomes of market dominance, though ongoing vigilance is required.
Mark scheme:
| Level | Marks | Descriptors |
|---|---|---|
| Level 1 | 1–3 | Superficial analysis with limited economic reasoning. May only consider one side of the argument. |
| Level 2 | 4–6 | Some analysis of costs and/or benefits with basic economic concepts. Limited evaluation or one-sided argument. |
| Level 3 | 7–9 | Balanced analysis considering both costs and benefits to consumers, with clear use of economic concepts (market power, efficiency, regulation, substitutes). Includes a reasoned evaluative judgement that directly addresses the word "necessarily." |
Indicative content for Level 3:
- Discussion of market power and allocative inefficiency (higher prices)
- Consideration of efficiency gains from economies of scale
- Analysis of network effects (both as barrier to entry and consumer benefit)
- Role of substitute competition (MRT/bus) in constraining pricing power
- Role of regulation (CCCS, LTA) in mitigating harm
- Direct evaluation of the word "necessarily" — dominance does not automatically harm consumers; context and regulation matter
- Clear conclusion with justified judgement
Section B: Structured Response and Essay
Question 6 [15 marks]
(a) Using a demand and supply diagram, explain how the COE system affects the equilibrium price and quantity of new cars in Singapore. [4 marks]
Answer:
The COE system works as a quota on the number of vehicles allowed on the road. The government issues a limited number of COEs through a bidding process, which restricts the supply of new cars.
Diagram explanation:
- The demand curve (D) for new cars is downward sloping.
- Without the COE system, supply is S1 (relatively elastic — cars can be imported freely), and equilibrium is at price P1 and quantity Q1.
- The COE system restricts supply to a fixed quantity (the quota), making the supply curve perfectly inelastic (vertical) at the quota quantity Q_quota.
- The new equilibrium price is P2, which is significantly higher than P1.
- The quantity of new cars sold falls from Q1 to Q_quota.
The COE price itself (exceeding $100,000) represents an additional cost on top of the car's purchase price, effectively increasing the total cost of car ownership.
Mark scheme:
- Correct diagram showing restricted supply (vertical/quota supply curve): 1 mark
- Correctly labelled axes, curves, and equilibrium points: 1 mark
- Explanation that COE restricts quantity supplied: 1 mark
- Explanation that equilibrium price rises and quantity falls: 1 mark
(b) Discuss whether the COE system is the most effective policy for addressing the external costs of private car use in Singapore. [11 marks]
Answer:
Introduction: Private car use in Singapore generates negative externalities including congestion, air pollution, and noise pollution. The marginal social cost (MSC) of car use exceeds the marginal private cost (MPC), leading to overconsumption of car travel. The COE system is one approach to addressing this market failure, but its effectiveness should be evaluated against alternative policies.
How the COE addresses external costs: The COE system directly limits the number of vehicles, which reduces traffic congestion and associated external costs. By restricting vehicle ownership, it addresses the source of the externality (too many cars on the road). The high COE price also internalises some of the external cost by making car ownership expensive.
Strengths of the COE system:
- Direct quantity control: The COE sets a hard cap on vehicle numbers, providing certainty about the maximum level of congestion.
- Revenue generation: COE auction revenues can be used to fund public transport improvements.
- Simplicity: The system is relatively straightforward to administer.
Weaknesses / limitations of the COE system:
- Does not address usage externalities: A COE allows car owners to drive as much as they want for 10 years. The external cost of congestion depends on how much cars are driven, not just how many cars exist. A car owner with a COE has no incentive to reduce driving.
- Regressive impact: The COE system may disproportionately affect lower-income individuals who need cars for work but cannot afford the high COE prices, while wealthy individuals can easily pay.
- Does not differentiate by usage: A car driven 5,000 km per year is treated the same as one driven 50,000 km per year, even though the latter generates far more external costs.
Alternative policies:
-
Congestion charging (ERP): Singapore already uses Electronic Road Pricing, which charges drivers for using congested roads during peak hours. This directly targets the usage externality and is more efficient than the COE because it varies by time and location of driving.
-
Pigouvian tax on fuel or vehicle usage: A tax proportional to distance driven would internalise the external cost of each kilometre driven, providing a continuous incentive to reduce driving.
-
Subsidies for public transport: Improving the quality and affordability of MRT and bus services (as shown in Table 2, MRT is 1.40vs14.50 for ride-hailing) provides a viable alternative to car use, reducing demand for private vehicles.
Evaluation: The COE system alone is not the most effective policy for addressing external costs of car use because it targets vehicle ownership rather than vehicle usage. A combination of policies — COE (to limit total vehicles), congestion charging (to manage usage), and public transport investment (to provide alternatives) — is likely to be more effective than any single policy. Singapore's actual approach of using COE alongside ERP and heavy investment in public transport reflects this understanding.
Mark scheme:
| Level | Marks | Descriptors |
|---|---|---|
| Level 1 | 1–3 | Limited understanding of external costs or the COE system. Descriptive rather than analytical. |
| Level 2 | 4–7 | Explains how COE addresses external costs with some analysis. May mention alternatives but with limited evaluation. |
| Level 3 | 8–11 | Clear explanation of external costs and how COE addresses them. Evaluates COE against at least one alternative policy with reasoned judgement about relative effectiveness. Considers both ownership vs. usage externalities. |
Question 7 [15 marks]
(a) Explain the possible causes of the rise in semiconductor prices using demand and supply analysis. [4 marks]
Answer:
The rise in semiconductor prices can be explained by simultaneous shifts in both demand and supply:
Demand-side factors:
- Surging demand for AI-related chips: The rapid growth of artificial intelligence applications (e.g., large language models, data centres) has dramatically increased demand for advanced semiconductors, particularly high-performance GPUs and specialised AI chips. This shifts the demand curve rightward (D1 → D2).
- Post-pandemic recovery: As global economies recovered from COVID-19, demand for electronics (smartphones, laptops, automotive electronics) rebounded.
Supply-side factors:
- Supply chain disruptions: The case study mentions supply chain disruptions, which could include factory shutdowns, logistics bottlenecks, or shortages of raw materials (e.g., rare earth elements). This shifts the supply curve leftward (S1 → S2).
- Long production lead times: Semiconductor fabrication plants (fabs) take years to build and are extremely capital-intensive, meaning supply cannot quickly respond to demand increases.
Combined effect: Both the rightward shift in demand and the leftward shift in supply contribute to a higher equilibrium price. The effect on quantity is ambiguous (demand increase raises quantity, supply decrease reduces quantity), but the price increase is unambiguous.
Mark scheme:
- Explanation of demand increase with correct reasoning: 2 marks
- Explanation of supply decrease with correct reasoning: 2 marks
- (Diagram would receive credit if drawn: rightward D shift, leftward S shift, higher price)
(b) Discuss whether the Singapore government should intervene in the semiconductor market to protect consumers from rising prices. [11 marks]
Answer:
Introduction: The semiconductor price increase affects both consumers (who pay more for electronics) and the broader economy. Whether government intervention is justified depends on the nature of the market failure, the effectiveness of intervention, and the potential unintended consequences.
Arguments for intervention:
-
Consumer welfare: Rising semiconductor prices increase the cost of essential goods (phones, computers, medical devices), disproportionately affecting lower-income consumers. Government intervention (e.g., subsidies, price controls) could protect vulnerable groups.
-
Strategic importance: Semiconductors are critical inputs for many industries. Singapore's economy benefits significantly from semiconductor manufacturing (15% export increase). Government support for the industry (e.g., subsidies for fab construction, R&D investment) could secure long-term supply and economic competitiveness.
-
Market failure — information asymmetry / coordination failure: Individual firms may underinvest in semiconductor production due to the high risks and long payback periods. Government coordination could overcome this coordination failure.
Arguments against intervention:
-
Price signals are efficient: Rising prices signal to producers to increase supply and to consumers to reduce demand or find substitutes. Government intervention (e.g., price caps) could distort these signals, leading to shortages or underinvestment.
-
Government failure: The government may not have the information needed to determine the "correct" price or optimal level of intervention. Subsidising semiconductor production could lead to misallocation of resources if the government picks the wrong technologies or firms.
-
Singapore is a small open economy: Singapore cannot significantly influence global semiconductor prices through domestic policy. The global market determines prices, and Singapore's intervention would have limited impact on world prices.
-
Supply-side solutions are more effective: Rather than price controls, the government could invest in supply-side measures — attracting semiconductor fabs to Singapore (as it has done with GlobalFoundries and others), investing in workforce training, and supporting R&D. These measures increase supply without distorting price signals.
Evaluation: Direct price intervention (price caps, subsidies to consumers) is likely to be ineffective and potentially harmful in the semiconductor market, given Singapore's small open economy status and the global nature of semiconductor supply chains. However, supply-side intervention — investing in production capacity, workforce development, and R&D — is justified and aligns with Singapore's strategic economic interests. The government should focus on increasing supply rather than suppressing prices.
Mark scheme:
| Level | Marks | Descriptors |
|---|---|---|
| Level 1 | 1–3 | Limited analysis. May only consider one side. Vague references to "government should intervene" without economic reasoning. |
| Level 2 | 4–7 | Some analysis of costs/benefits of intervention with basic economic concepts. Limited evaluation of alternatives. |
| Level 3 | 8–11 | Balanced analysis of arguments for and against intervention. Considers Singapore's specific context (small open economy, strategic industry). Distinguishes between price intervention and supply-side intervention. Clear evaluative conclusion. |
Question 8 [15 marks]
Question: "Price discrimination is always beneficial for firms but harmful for consumers." Evaluate this statement with reference to a real-world example of price discrimination.
Answer:
Introduction: Price discrimination occurs when a firm charges different prices to different consumers for the same product, where the price difference is not justified by cost differences. The statement claims that price discrimination is "always" good for firms and "always" bad for consumers. This is an oversimplification — the effects depend on the type of price discrimination, market conditions, and the specific consumers affected.
Conditions for price discrimination: For price discrimination to be profitable, a firm must:
- Have some degree of market power (ability to set prices)
- Be able to identify and separate different consumer groups with different price elasticities of demand
- Prevent arbitrage (resale from low-price to high-price consumers)
Example: Airline ticket pricing
Airlines are classic examples of third-degree price discrimination. They charge different prices for the same flight based on booking time, flexibility, and passenger type:
- Business travellers (price inelastic demand) pay higher fares for flexible, last-minute bookings
- Leisure travellers (price elastic demand) pay lower fares for advance bookings with restrictions
Analysis — Benefits to firms:
-
Increased total revenue and profits: By charging higher prices to consumers with inelastic demand and lower prices to those with elastic demand, firms capture more consumer surplus and convert it into producer surplus (profit). Airlines extract high willingness-to-pay from business travellers while still filling seats that would otherwise be empty.
-
Better capacity utilisation: Price discrimination allows firms to sell to additional market segments. Without price discrimination, airlines might not fill seats with leisure travellers at business-class prices. The lower fares attract price-sensitive consumers who would not otherwise fly.
Analysis — Effects on consumers:
The statement claims price discrimination is "always harmful" for consumers, but this is not necessarily true:
-
Some consumers benefit: Leisure travellers who book early and accept restrictions pay lower prices than they would under a single-price monopoly. Without price discrimination, the airline might set a single high price that excludes these consumers entirely. Price discrimination expands output and allows access to consumers who would otherwise be priced out.
-
Some consumers are harmed: Business travellers with inelastic demand pay higher prices. They lose consumer surplus to the firm. This is particularly concerning if the high-price group consists of consumers with fewer alternatives (e.g., essential workers who must travel during peak hours).
-
Output effect: Price discrimination typically leads to higher total output than a single-price monopoly. This can improve allocative efficiency because more of the good is produced and consumed, reducing deadweight loss.
-
Cross-subsidisation: In some cases, profits from price discrimination can fund service improvements that benefit all consumers. For example, airline profits from business class can subsidise the development of routes and services that benefit all passengers.
Evaluation: The statement is too absolute. Price discrimination is generally beneficial for firms (increased revenue, profits, capacity utilisation), but its effect on consumers is mixed:
- Consumers with elastic demand (typically lower-income, more price-sensitive) often benefit from lower prices and greater access
- Consumers with inelastic demand (typically higher-income, less price-sensitive) are harmed by higher prices
- Overall welfare may increase if the output expansion effect is significant
The word "always" in the statement makes it inaccurate. A more nuanced view is that price discrimination redistributes surplus from consumers to firms, but the distributional effects vary across consumer groups, and total welfare may increase.
Mark scheme:
| Level | Marks | Descriptors |
|---|---|---|
| Level 1 | 1–3 | Describes price discrimination with limited analysis. May not use a real-world example. One-sided argument. |
| Level 2 | 4–7 | Explains price discrimination with a real-world example. Analyses effects on firms and consumers but with limited evaluation. May not challenge the word "always." |
| Level 3 | 8–11 | Clear explanation of conditions for price discrimination. Detailed analysis using a real-world example. Evaluates effects on different consumer groups. Challenges the absolutist language ("always"). Considers output effects and overall welfare. Clear conclusion. |
| Level 4 | 12–15 | All of Level 3, plus sophisticated evaluation considering multiple perspectives, potential exceptions, and a well-structured argument with a nuanced final judgement. May discuss different types of price discrimination (1st, 2nd, 3rd degree) and their varying effects. |
Indicative content for top-band responses:
- Clear definition and conditions for price discrimination
- Real-world example used throughout (airlines, ride-hailing surge pricing, student discounts, etc.)
- Analysis of benefits to firms (revenue, profit, capacity utilisation)
- Analysis of effects on different consumer groups (those with elastic vs. inelastic demand)
- Discussion of output effects and welfare implications
- Direct challenge to the word "always" — the effects are context-dependent
- Nuanced conclusion that acknowledges complexity
Mark Summary
| Section | Question | Marks |
|---|---|---|
| A: Case Study | Q1 | 3 |
| Q2(a) | 4 | |
| Q2(b) | 4 | |
| Q3 | 5 | |
| Q4 | 5 | |
| Q5 | 9 | |
| Section A Total | 30 | |
| B: Structured/Essay | Q6 (a+b) | 15 |
| Q7 (a+b) | 15 | |
| Q8 | 15 | |
| Section B Total (best 2 of 3) | 30 | |
| Total | 60 |
Free quiz and exam paper access
Enter your details to view this paper
Your access is remembered on this device.