From Real Exams Exam Paper
A Level H2 Economics Practice Paper 1
Free A Level H2 Econs Practice Paper 1, HY3 Exam version, with questions, answers, and A Level-style practice for Singapore students.
These static practice materials are generated from the site's syllabus and paper-generation workflow, with source and model context shown so students and parents can evaluate the material before use.
Questions

Free quiz and exam paper access
Enter your details to view this paper
Your access is remembered on this device.
Answers
Answer Key – TuitionGoWhere Practice Paper (Microeconomics) Version 1
Total Marks: 60
Level: A-Level H2 Economics
Topic: Microeconomics
Section A (16 marks)
Q1 [2 marks] The signalling function of the price mechanism communicates information to consumers and producers. A rise in price signals scarcity and encourages producers to increase supply while discouraging consumption. Marking: 1 mark for definition, 1 mark for example of rise/fall signalling.
Q2 [2 marks] A movement along the demand curve is caused by a change in the price of the good itself; a shift in the demand curve is caused by a change in a non-price determinant (e.g. income, tastes). Marking: 1 mark each for correct distinction.
Q3 [2 marks] Consumer surplus is the difference between what consumers are willing to pay (shown by the demand curve) and what they actually pay (market price), summed over all units. Marking: 1 mark willingness, 1 mark actual payment/diagram area.
Q4 [2 marks] → inferior good (negative YED). Type: inferior good (e.g. instant noodles). Marking: 1 mark inferior, 1 mark correct type identification.
Q5 [2 marks] Diagram: price ceiling below equilibrium creates excess demand (shortage). Label Pmax below Pe, Qd > Qs. Marking: 1 mark diagram with Pmax below Pe, 1 mark shortage shown.
Q6 [2 marks] A firm may satisfice due to separation of ownership and control (managers prefer steady growth over max profit) or lack of info to maximise profit. Marking: 1 mark reason, 1 mark brief explanation.
Q7 [2 marks] → → . . Equilibrium price = $20, quantity = 60. Marking: 1 mark correct P, 1 mark correct Q.
Q8 [2 marks] Any two: income, tastes/preferences, price of related goods, expectations, number of consumers. Marking: 1 mark each.
Section B (24 marks)
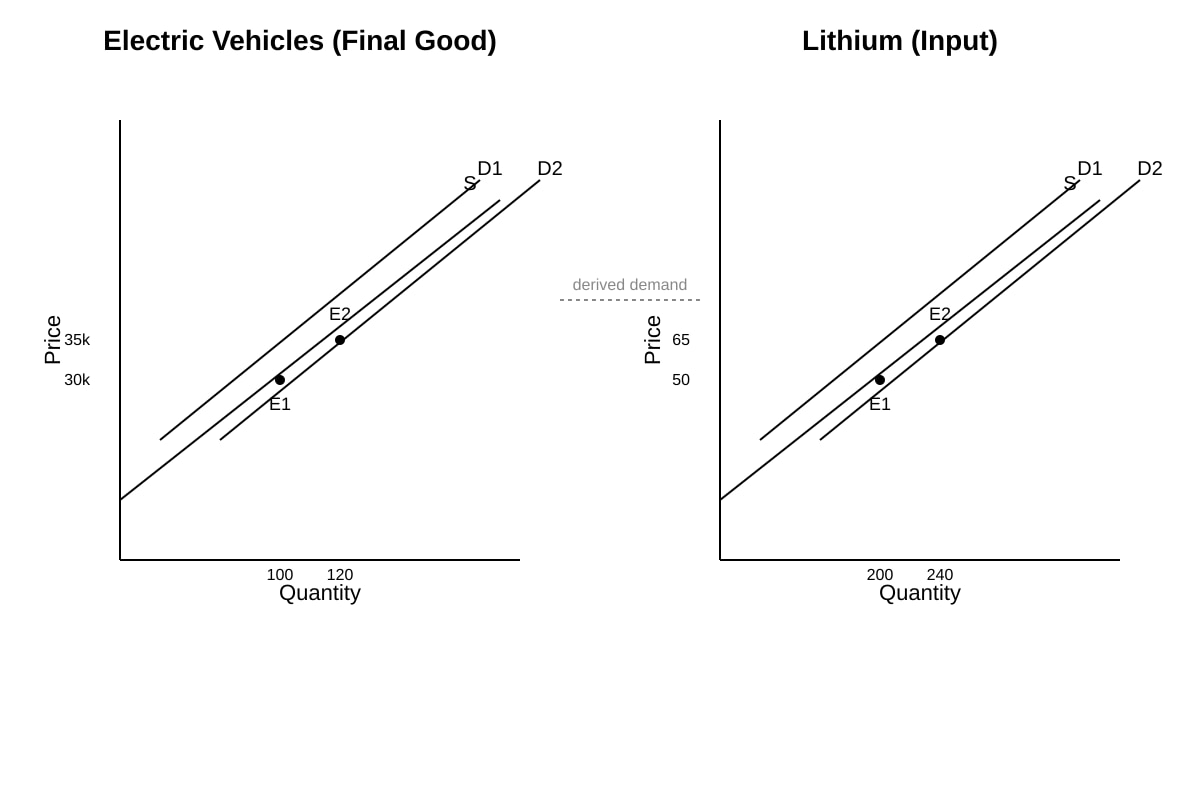
Q9 [3 marks] EV demand rises → more EVs produced → derived demand for lithium increases → lithium price and quantity rise. Diagram must show EV D shift right, lithium D shift right. Marking: 1 mark causal chain, 2 marks diagram with both markets.
Q10 [3 marks] Derived demand: demand for lithium is derived from demand for EVs. As EV demand rises (Extract 1: +35% sales), lithium demand shifts right (price +30%). Marking: 1 mark definition, 2 marks applied to extract.
Q11 [3 marks] Midpoint PED = . Absolute 1.0 (unit elastic). Marking: 1 mark formula, 1 mark substitution, 1 mark answer.
Q12 [4 marks] Subsidy shifts supply right → price falls, quantity rises. Consumer expenditure = P×Q may rise/fall depending on PED; producer revenue may rise due to higher Q. Diagram shows S2 right. Marking: 1 diagram, 1 price/qty effect, 2 expenditure/revenue explanation.
Q13 [2 marks] Oligopoly firms compete via non-price (advertising, network) and price matching to avoid price wars. Marking: 1 mark non-price, 1 mark price matching.
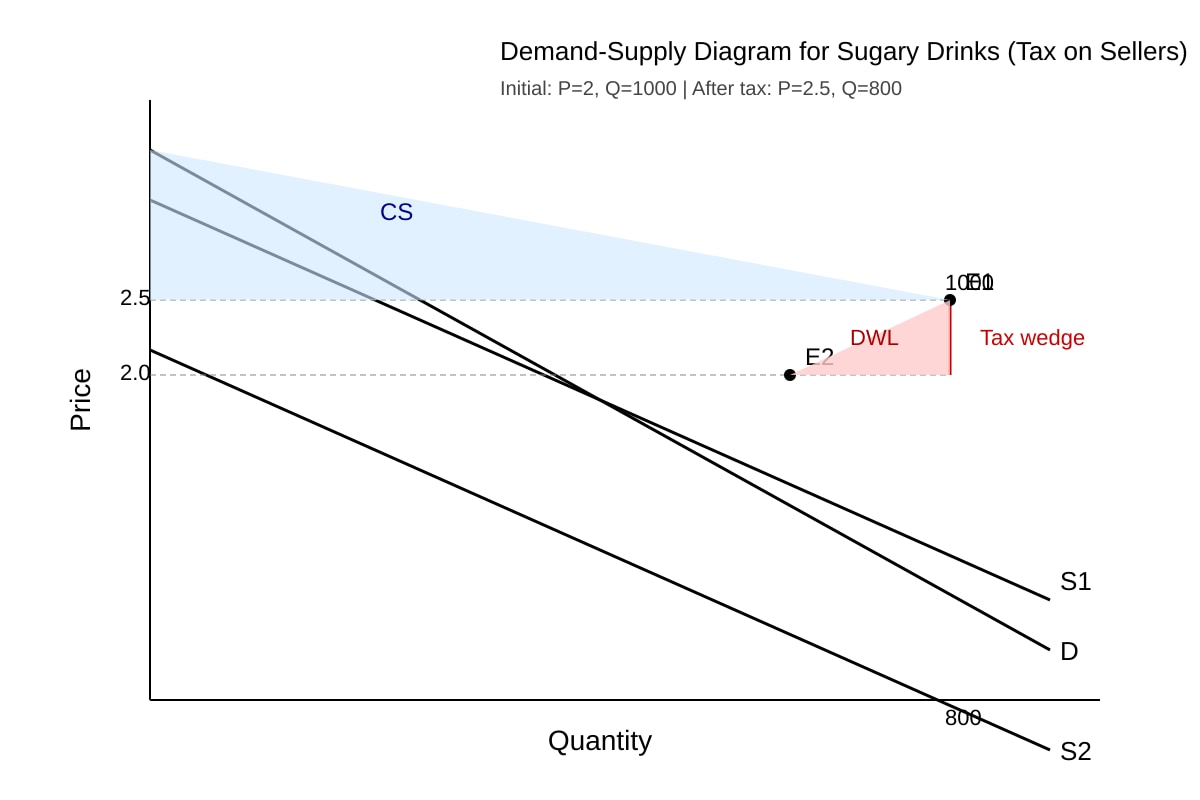
Q14 [6 marks] Tax shifts S left → price up, Q down. CS falls (less area under D above P). DWL = loss of mutually beneficial trades. Diagram with tax wedge and DWL triangle. Marking: 2 diagram, 2 CS, 2 DWL.
Section C (20 marks)
Q15 [8 marks] For: fewer firms → scale economies → lower prices; against: less competition → higher prices, reduced choice. Use CS diagram. Conclusion: ambiguous, depends on regulation. Marking: 2 for, 2 against, 2 diagram, 2 judgment.
Q16 [8 marks] Consumer role: demand shift to sustainable. Limits: info asymmetry, cost, externalities need gov. Balanced: individual + systemic. Marking: 2 consumer, 2 barriers, 2 gov need, 2 conclusion.
Q17 [4 marks] Higher wages signal labour scarcity → workers incentivised to enter; firms signal needs via pay. Marking: 2 signalling, 2 incentive.
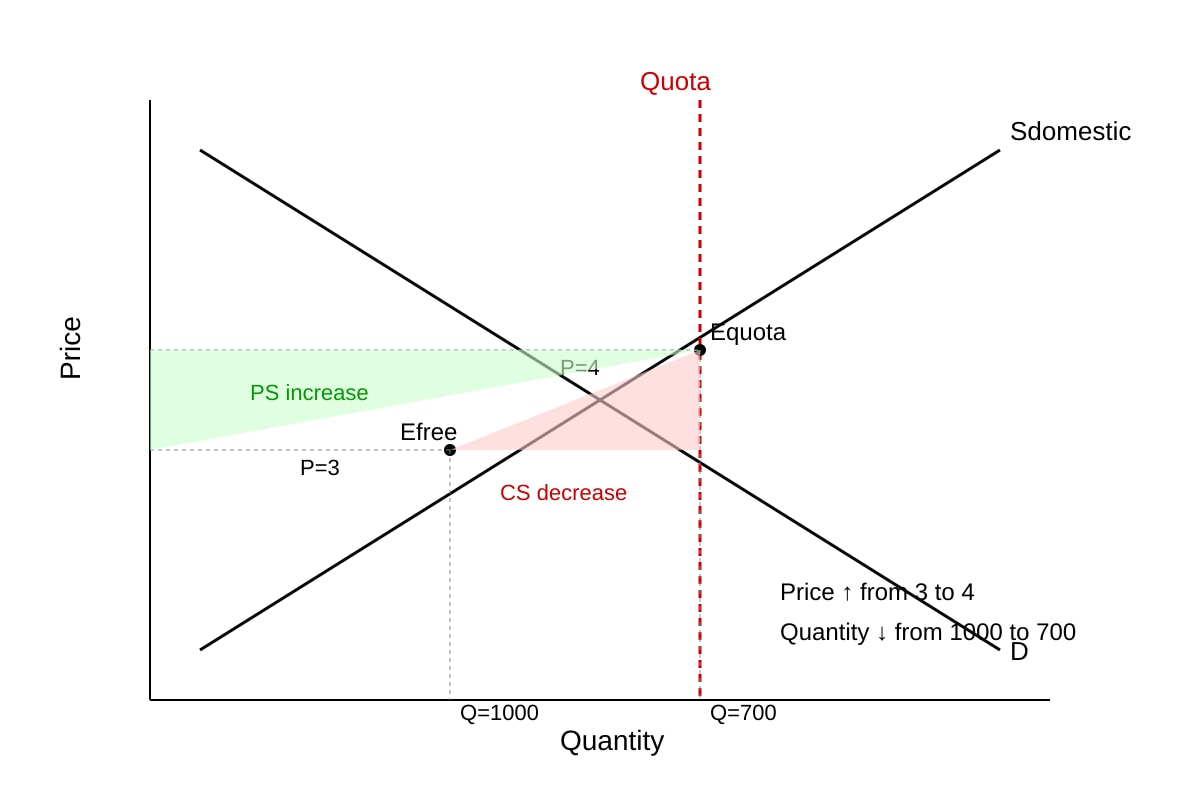
Q18 [6 marks] Quota limits import supply → domestic price up, Q down. CS falls, PS rises. Diagram with quota line. Marking: 2 diagram, 2 CS, 2 PS.
Q19 [6 marks] Price discrimination (e.g. student vs adult) raises revenue if PED differs. Not always best: needs market power, no resale. Alternatives: advertising. Marking: 2 method, 2 condition, 2 eval.
Q20 [8 marks] For: subsidy lowers bread price, aids consumers. Against: thin margins already, may not reach consumers, opportunity cost. Extract 3 rent/cost. Marking: 2 for, 2 against, 2 extract use, 2 conclusion.