From Real Exams Exam Paper
A Level H2 Economics Practice Paper 1
Free A Level H2 Econs Practice Paper 1, DeepSeek Exam version, with questions, answers, and A Level-style practice for Singapore students.
These static practice materials are generated from the site's syllabus and paper-generation workflow, with source and model context shown so students and parents can evaluate the material before use.
Questions
Free quiz and exam paper access
Enter your details to view this paper
Your access is remembered on this device.
Answers
TuitionGoWhere Practice Paper - Economics H2 A-Level
Answer Key and Marking Scheme
Paper: Practice Paper 1 (Microeconomics Case Study) Version: 1 of 5 Total Marks: 60
Section A: Case Study (40 marks)
Question 1 (2 marks)
Answer:
Global coffee prices increased from USD 1.01/lb in 2019 to a peak of USD 1.89/lb in 2022, before declining to USD 1.65/lb in 2023. Overall, prices rose significantly between 2019 and 2022, then moderated in 2023.
Marking Notes:
- 1 mark: Identifies the overall upward trend from 2019 to 2022 (or states that prices increased overall)
- 1 mark: Notes the peak in 2022 and subsequent decline in 2023 (or provides specific data points to support the trend)
- Accept: "Prices increased at an increasing rate from 2019 to 2022, then fell in 2023"
- Do not award full marks for simply stating "prices went up and down" without specific reference to the data
Question 2 (4 marks)
Answer:
The frost in Brazil destroyed a significant portion of the coffee crop, reducing the global supply of coffee. This is represented by a leftward shift of the supply curve from S1 to S2.
Diagram:
- Correctly labelled axes: Price (USD/lb) on vertical axis, Quantity (million bags) on horizontal axis
- Downward-sloping demand curve (D)
- Upward-sloping supply curves (S1 and S2), with S2 to the left of S1
- Equilibrium points labelled: E1 (original) and E2 (new)
- Price increases from P1 to P2; quantity decreases from Q1 to Q2
Explanation: The reduction in supply, with demand unchanged, creates a shortage at the original price. This exerts upward pressure on price. The new equilibrium is at a higher price and lower quantity. This explains the price spike observed in 2021–2022.
Marking Notes:
- 1 mark: Correctly drawn and labelled demand and supply diagram showing leftward shift of supply
- 1 mark: Correctly identifies the frost as a supply-side shock reducing supply
- 1 mark: Explains the mechanism: reduced supply → shortage → upward pressure on price
- 1 mark: Links to the data/context (Brazil frost, price spike)
- Award maximum 2 marks if diagram is missing or incorrectly drawn
- Accept: Reference to the specific price increase from Table 1
Question 3 (2 marks)
Answer:
Oligopsony power refers to a market situation where there are only a few buyers, giving them significant influence over the prices they pay to suppliers. In the coffee market, a small number of large multinational roasters dominate the purchasing of coffee beans, allowing them to exert downward pressure on prices paid to farmers.
Marking Notes:
- 1 mark: Defines oligopsony as market power held by a small number of buyers
- 1 mark: Applies the concept to the coffee market context (buyers can influence prices paid to farmers)
- Accept: "Market power on the buying side" or "buyer concentration leading to price-setting ability"
Question 4 (6 marks)
Answer:
Effects on coffee farmers: The concentrated market structure means farmers face a small number of powerful buyers (oligopsony). These large roasters can use their market power to negotiate lower prices for coffee beans. With limited alternative buyers, farmers may be forced to accept prices below what would prevail in a competitive market. This reduces farmer incomes and can contribute to poverty in coffee-producing regions.
Effects on consumers: On the selling side, the concentrated roasting and retail market (oligopoly) may allow firms to charge higher prices to consumers than under perfect competition. The large roasters may engage in tacit or explicit collusion, limiting price competition. Additionally, the market power of these firms may reduce consumer choice if they limit the variety of coffee products available. However, consumers may also benefit from economies of scale, brand consistency, and product innovation that large firms can provide.
Marking Notes:
- 1–2 marks: Explains the effect on farmers (lower prices received due to oligopsony power, limited alternative buyers)
- 1–2 marks: Explains the effect on consumers (higher prices paid due to oligopoly power, potential reduction in choice)
- 1–2 marks: Provides balanced analysis (e.g., acknowledges potential benefits to consumers from economies of scale, or explains the "hourglass" structure linking both effects)
- Award up to 6 marks for a well-developed answer with clear economic reasoning
- Award lower marks for generic answers without reference to the extract
Question 5 (4 marks)
Answer:
The higher equilibrium price of certified sustainable coffee can be explained by both demand-side and supply-side factors:
Supply-side: Producing certified sustainable coffee involves higher costs. Farmers must comply with certification standards, which may include investments in sustainable farming practices, auditing costs, and certification fees. This shifts the supply curve for certified coffee to the left (higher costs at each quantity) compared to conventional coffee.
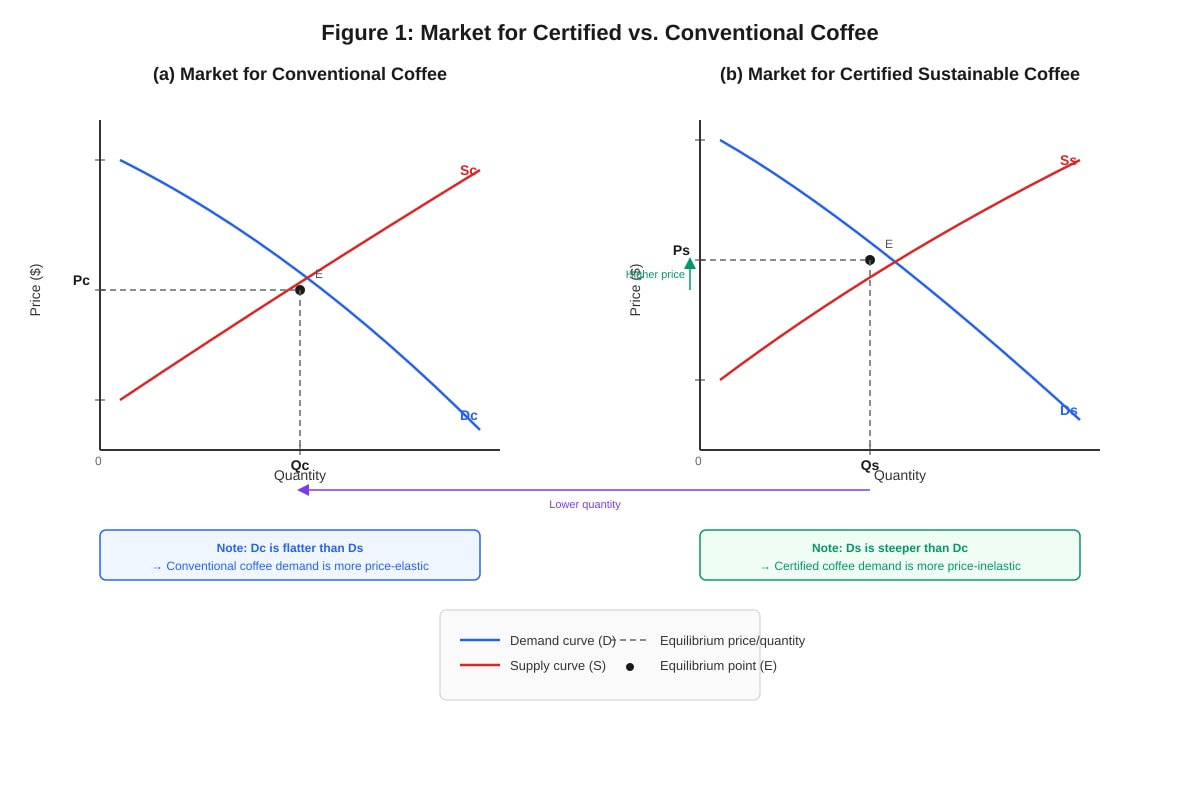
Demand-side: Consumers who value sustainability are willing to pay a premium for certified coffee. The demand curve for certified coffee reflects this higher willingness to pay. Additionally, as noted in Figure 1, the demand for certified coffee tends to be more price-inelastic, meaning consumers are less responsive to price changes, allowing firms to charge higher prices.
The combination of higher production costs (leftward supply shift) and higher willingness to pay (reflected in demand) results in a higher equilibrium price (Ps > Pc) and typically a lower equilibrium quantity (Qs < Qc).
Marking Notes:
- 1 mark: Identifies higher production costs as a supply-side factor
- 1 mark: Identifies higher willingness to pay as a demand-side factor
- 1 mark: Explains the supply shift mechanism (leftward shift due to certification costs)
- 1 mark: Explains the demand-side mechanism (premium willingness to pay, price inelasticity)
- Award maximum 3 marks if no reference to Figure 1 or the extract
Question 6 (8 marks)
Answer:
Arguments supporting the statement:
- Consumer demand signals preferences to producers. If consumers actively choose certified sustainable coffee, this increases demand for sustainable products, incentivising more farmers to adopt sustainable practices.
- The price premium for certified coffee can provide higher incomes for participating farmers, as noted in Extract 3 (15% income increase).
- Consumer choice operates through the market mechanism without requiring government intervention, which may be more efficient and avoid government failure.
- As awareness of sustainability issues grows, consumer preferences may shift, driving market-led change.
Arguments against the statement:
- Information asymmetry: Consumers may lack full information about the environmental and social impacts of different coffee products, making it difficult to make informed choices. Certification schemes attempt to address this but may be imperfect.
- Affordability constraints: Certified sustainable coffee is more expensive (as shown in Figure 1). Lower-income consumers may be unable or unwilling to pay the premium, limiting the market share of sustainable products.
- Free-rider problem: Individual consumers may choose not to pay the premium, hoping others will, leading to under-provision of sustainability.
- Structural market failures: Extract 2 highlights the concentrated market structure. Even if consumers demand sustainable coffee, the market power of large roasters may limit the extent to which benefits are passed on to farmers.
- The study in Extract 3 notes that certification schemes have only a "modest" impact on poverty reduction and cannot address structural issues like oversupply and price volatility.
- Externalities: Coffee production generates negative externalities (deforestation, water pollution). Consumer choice alone may not fully internalise these externalities; government intervention (taxes, regulations) may be necessary.
Evaluation: While consumer choice plays an important role in driving demand for sustainable coffee, relying solely on consumers is insufficient to address the full range of problems. Market failures (information asymmetry, externalities, market power) limit the effectiveness of consumer-driven solutions. A combination of consumer action, government intervention (regulation, subsidies for sustainable practices), and industry self-regulation is likely to be more effective.
Marking Notes:
- 1–2 marks: Identifies arguments supporting consumer choice (demand signals, market mechanism, price premiums)
- 1–2 marks: Identifies arguments against consumer choice (information asymmetry, affordability, free-rider problem)
- 1–2 marks: Links to market failure concepts (externalities, imperfect information, market power from Extract 2)
- 1–2 marks: Provides balanced evaluation with a reasoned conclusion
- Award up to 8 marks for a well-structured answer that uses extract evidence and economic concepts effectively
- Award lower marks for one-sided answers or answers lacking reference to the extracts
Question 7 (4 marks)
Answer:
One benefit: Minimum price schemes provide income stability for coffee farmers. By guaranteeing a floor price, farmers are protected from sharp price declines that could threaten their livelihoods. This can help reduce poverty and allow farmers to plan for the future with greater certainty. As noted in Extract 4, Colombia's price stabilisation fund purchases coffee when prices fall below a threshold, providing a safety net.
One limitation: Minimum price schemes can create market distortions. By guaranteeing prices above the market equilibrium, they may encourage overproduction. This excess supply can lead to downward pressure on prices in the long run, potentially making the problem worse. Extract 4 notes that such schemes "may encourage overproduction, leading to even lower prices in the long run." Additionally, these schemes are fiscally costly for governments and may not effectively target the poorest farmers.
Marking Notes:
- 1 mark: Identifies one valid benefit (income stability, poverty reduction, safety net)
- 1 mark: Explains the benefit with economic reasoning
- 1 mark: Identifies one valid limitation (overproduction, market distortion, fiscal cost, targeting issues)
- 1 mark: Explains the limitation with economic reasoning and/or reference to Extract 4
- Award maximum 2 marks if only benefit or only limitation is addressed
Question 8 (10 marks)
Answer:
Introduction: The coffee market exhibits several market failures that may justify government intervention. However, intervention itself can lead to government failure. A balanced assessment is required.
Arguments for government intervention:
-
Market power/oligopsony (Extract 2): The concentrated market structure means farmers face powerful buyers who can depress prices. Government intervention (e.g., competition policy, support for farmer cooperatives) can help counterbalance this market power and improve outcomes for farmers.
-
Price volatility (Extract 1): Coffee prices are highly volatile due to supply shocks (e.g., Brazil frost) and inelastic demand and supply in the short run. Price stabilisation schemes (Extract 4) can reduce uncertainty for farmers and promote long-term investment.
-
Externalities (Extract 3): Coffee production generates negative externalities (deforestation, water pollution). Without intervention, these costs are not reflected in market prices, leading to overproduction from society's perspective. Government intervention (taxes, regulations, subsidies for sustainable practices) can internalise these externalities.
-
Information asymmetry: Consumers may lack information about production conditions. Government can mandate labelling standards or support certification schemes to improve information flows.
-
Equity concerns: Smallholder farmers in developing countries may face poverty despite working in a valuable global industry. Government intervention can address distributional concerns that the market does not resolve.
Arguments against government intervention:
-
Government failure (Extract 4): Price support schemes can create market distortions, encouraging overproduction and leading to lower prices in the long run. This is an example of government failure where intervention worsens outcomes.
-
Fiscal costs: Price stabilisation schemes and subsidies are costly for governments, particularly in developing countries with limited fiscal resources. Opportunity costs must be considered.
-
Targeting problems: Extract 4 notes that price support schemes "may not target the poorest farmers effectively." Benefits may accrue to larger, wealthier farmers rather than those most in need.
-
Market-based alternatives: Consumer-driven certification schemes (Extract 3), while imperfect, may be more efficient than government intervention. Technological innovation and productivity improvements may also address some problems without government action.
-
International coordination challenges: Coffee is a global market. Unilateral intervention by one country may be ineffective or create competitive disadvantages. International coordination is difficult to achieve.
Evaluation: The case for government intervention is strongest where clear market failures exist (externalities, market power) and where intervention can be well-targeted. However, the evidence from Extract 4 suggests that poorly designed interventions can create government failure. A nuanced approach is needed:
- Competition policy to address market power may be more effective than price controls
- Direct income support to farmers may be better targeted than price support schemes
- International cooperation is essential given the global nature of the coffee market
- Complementary approaches combining government intervention, market-based solutions, and consumer action are likely to be most effective
Marking Notes:
| Level | Marks | Descriptor |
|---|---|---|
| L3 | 8–10 | Comprehensive analysis of both sides with clear evaluation. Uses extract evidence and economic concepts effectively. Well-structured with a reasoned conclusion. |
| L2 | 4–7 | Adequate analysis with some evaluation. Some use of extract evidence. May be somewhat one-sided or lack depth in evaluation. |
| L1 | 1–3 | Limited analysis. Descriptive rather than analytical. Little or no use of extract evidence. Weak or no evaluation. |
- Award within level based on quality of economic reasoning, use of extracts, and evaluation
- Answers that only address one side (for or against) cannot achieve more than Level 2
Section B: Essays (20 marks)
Question 9: Oligopolistic Competition and Consumer Welfare
Part (a): Explain how firms in an oligopolistic market structure compete with one another. [10 marks]
Answer Framework:
Introduction: Oligopoly is a market structure characterised by a small number of large firms, high barriers to entry, and mutual interdependence. Firms in oligopolistic markets compete through both price and non-price strategies.
Price Competition:
- Firms may engage in price wars, cutting prices to gain market share
- However, price competition is often limited due to mutual interdependence—firms recognise that cutting prices may trigger retaliatory price cuts, leaving all firms worse off
- The kinked demand curve model illustrates price rigidity in oligopolistic markets
- Tacit or explicit collusion may lead to prices above competitive levels
Non-Price Competition:
- Product differentiation: Firms compete through branding, quality, design, and features to create perceived differences and build brand loyalty
- Advertising and marketing: Heavy investment in advertising to influence consumer preferences and increase market share
- Research and development (R&D): Innovation to develop new products or improve existing ones, creating competitive advantage
- Customer service and after-sales support: Competing on service quality to attract and retain customers
- Loyalty programmes and exclusive agreements: Building customer lock-in and reducing switching
Collusive Behaviour:
- Tacit collusion: Firms may follow price leadership or engage in conscious parallelism without explicit agreement
- Explicit collusion (cartels): Firms may formally agree to fix prices, restrict output, or divide markets (though this is illegal in many jurisdictions)
- Collusion allows firms to act like a monopoly, maximising joint profits
Conclusion: Firms in oligopolistic markets compete through a mix of strategies, with non-price competition often being more important than price competition due to the risks of price wars.
Marking Notes:
| Level | Marks | Descriptor |
|---|---|---|
| L3 | 8–10 | Comprehensive explanation covering price and non-price competition, with clear understanding of mutual interdependence. Well-structured with relevant examples. |
| L2 | 4–7 | Adequate explanation covering some forms of competition. May lack depth on mutual interdependence or be somewhat generic. |
| L1 | 1–3 | Limited explanation. May focus only on one type of competition or be descriptive rather than analytical. |
Part (b): Discuss whether consumers necessarily benefit from greater competition in oligopolistic markets. [10 marks]
Answer Framework:
Introduction: Greater competition in oligopolistic markets can bring benefits to consumers, but the relationship is not straightforward. The extent of consumer benefit depends on the nature of competition and market characteristics.
Arguments that consumers benefit:
- Lower prices: Increased competition, particularly price competition, can drive prices down toward competitive levels, increasing consumer surplus
- Greater choice: Competition encourages product differentiation, giving consumers more variety and options
- Higher quality: Firms competing on quality may improve products and services
- Innovation: Competition can drive R&D and technological progress, leading to new and improved products (e.g., smartphone market)
- Reduced market power: Competition erodes the ability of firms to charge prices above marginal cost, reducing allocative inefficiency
Arguments that consumers may not benefit:
- Destructive competition: Intense price competition may lead to firms exiting the market, potentially reducing choice in the long run
- Wasteful duplication: Non-price competition (e.g., excessive advertising) may increase costs without adding value for consumers, potentially leading to higher prices
- Reduced economies of scale: Fragmentation of the market may prevent firms from achieving minimum efficient scale, increasing average costs and prices
- Quality deterioration: If competition focuses solely on price, firms may cut corners on quality or safety to reduce costs
- Innovation trade-offs: In some cases, large firms with market power may have greater resources and incentives to invest in R&D (Schumpeterian hypothesis). Increased competition could reduce innovation if it reduces profits available for R&D investment
- Confusion costs: Excessive product differentiation may create information overload for consumers, making it harder to make optimal choices
Evaluation:
- The net effect on consumers depends on the type of competition (price vs. non-price) and market characteristics
- Moderate competition that drives efficiency and innovation is generally beneficial, but excessive or destructive competition may harm consumers
- The nature of the product matters: for homogeneous goods, price competition is more important; for differentiated goods, quality and innovation competition may be more valuable
- Policy implications: Competition policy should aim to promote "effective competition" rather than maximum competition
Marking Notes:
| Level | Marks | Descriptor |
|---|---|---|
| L3 | 8–10 | Balanced discussion with clear evaluation. Considers both benefits and limitations. Well-structured with relevant examples and a reasoned conclusion. |
| L2 | 4–7 | Adequate discussion with some balance. May be somewhat one-sided or lack depth in evaluation. |
| L1 | 1–3 | Limited discussion. Descriptive rather than analytical. Weak or no evaluation. |
Question 10: Price Elasticity of Demand and Pricing Decisions
Part (a): Explain the concept of price elasticity of demand and discuss the factors that determine whether the demand for a good is price elastic or price inelastic. [10 marks]
Answer Framework:
Concept of Price Elasticity of Demand (PED):
- PED measures the responsiveness of quantity demanded to a change in price
- Formula: PED = % change in quantity demanded / % change in price
- PED is typically negative (law of demand) but is often expressed in absolute terms
- Elastic demand: |PED| > 1 (quantity demanded changes more than proportionately to price change)
- Inelastic demand: |PED| < 1 (quantity demanded changes less than proportionately to price change)
- Unit elastic demand: |PED| = 1
- Perfectly elastic (horizontal demand curve) and perfectly inelastic (vertical demand curve) are extreme cases
Factors Determining PED:
-
Availability of substitutes: The more and closer substitutes available, the more elastic the demand. Consumers can easily switch to alternatives if price rises. (e.g., demand for a specific brand of coffee is more elastic than demand for coffee in general)
-
Necessity vs. luxury: Necessities tend to have inelastic demand (consumers need them regardless of price), while luxuries tend to have elastic demand (consumers can more easily forgo them). (e.g., demand for basic food items is inelastic; demand for premium specialty coffee is more elastic)
-
Proportion of income spent on the good: Goods that take up a large proportion of income tend to have more elastic demand, as price changes have a significant impact on purchasing power. (e.g., demand for housing is more elastic than demand for salt)
-
Time period: Demand tends to be more elastic in the long run as consumers have more time to adjust behaviour and find substitutes. (e.g., demand for petrol is more inelastic in the short run than in the long run)
-
Habit-forming/addictive goods: Goods that are habit-forming or addictive tend to have inelastic demand. (e.g., demand for cigarettes, coffee for regular drinkers)
-
Definition of the market: Narrowly defined markets (e.g., a specific brand) have more elastic demand than broadly defined markets (e.g., the product category as a whole)
-
Durability of the good: Durable goods tend to have more elastic demand as consumers can postpone replacement when prices rise
Marking Notes:
| Level | Marks | Descriptor |
|---|---|---|
| L3 | 8–10 | Clear explanation of PED concept with formula and categories. Comprehensive discussion of factors with relevant examples. Well-structured. |
| L2 | 4–7 | Adequate explanation of PED with some factors discussed. May lack examples or depth on some factors. |
| L1 | 1–3 | Limited explanation. May define PED but not discuss factors, or discuss factors without clear understanding of PED. |
Part (b): Discuss the extent to which knowledge of price elasticity of demand is useful for firms when making pricing decisions. [10 marks]
Answer Framework:
Introduction: Knowledge of PED is valuable for firms' pricing decisions, but it is not the only consideration. Firms must also consider costs, competition, and strategic objectives.
How PED knowledge is useful:
-
Revenue optimisation: If demand is elastic, a price decrease will increase total revenue (quantity effect outweighs price effect). If demand is inelastic, a price increase will increase total revenue. Firms can use PED estimates to set revenue-maximising prices.
-
Price discrimination: Firms can segment markets based on PED. They can charge higher prices to consumers with inelastic demand and lower prices to those with elastic demand, increasing total revenue and profits. (e.g., airlines charging higher prices to business travellers with inelastic demand)
-
Tax incidence analysis: When governments impose taxes, firms can predict how much of the tax burden they can pass on to consumers. The more inelastic the demand, the greater the proportion of tax borne by consumers.
-
New product pricing: For new products, firms may initially set lower prices if demand is expected to be elastic (penetration pricing) or higher prices if demand is inelastic (price skimming).
-
Competitive strategy: Understanding PED helps firms anticipate competitor responses and consumer switching behaviour in response to price changes.
Limitations of PED knowledge:
-
Difficulty in measurement: Estimating PED accurately is challenging. It requires data on how quantity demanded responds to price changes, holding other factors constant (ceteris paribus), which is difficult in real-world markets.
-
PED changes over time: PED is not constant. It can change due to shifts in consumer preferences, introduction of new substitutes, changes in income, or advertising. Historical estimates may not be reliable for future decisions.
-
Other factors matter: Pricing decisions also depend on:
- Costs: Firms must cover costs regardless of PED. A price that maximises revenue may not maximise profit if costs are high.
- Competition: In oligopolistic markets, mutual interdependence means firms must consider competitor reactions, not just consumer responsiveness.
- Strategic objectives: Firms may prioritise market share, brand positioning, or long-term growth over short-term revenue maximisation.
- Cross-price elasticity: The effect of a price change depends on how competitors respond and how consumers substitute between products.
- Income elasticity: Changes in consumer income affect demand independently of price changes.
-
Non-price competition: In many markets, non-price factors (branding, quality, service) are more important than price in determining consumer choices. PED analysis may be less relevant in such markets.
Evaluation:
- PED knowledge is most useful in markets where price is the primary competitive dimension and where demand is relatively stable and measurable
- It is less useful in markets characterised by rapid change, strong brand differentiation, or complex competitive dynamics
- PED should be used as one input into pricing decisions alongside cost analysis, competitive analysis, and strategic considerations
- The value of PED knowledge also depends on the cost of obtaining accurate estimates relative to the benefits of improved pricing decisions
Marking Notes:
| Level | Marks | Descriptor |
|---|---|---|
| L3 | 8–10 | Balanced discussion with clear evaluation. Explains both usefulness and limitations. Well-structured with relevant examples and a reasoned conclusion. |
| L2 | 4–7 | Adequate discussion with some balance. May be somewhat one-sided or lack depth in evaluation. |
| L1 | 1–3 | Limited discussion. Descriptive rather than analytical. Weak or no evaluation. |
— END OF ANSWER KEY —