AI Generated Quiz
A Level H1 Economics Policy Evaluation Quiz
Free A Level H1 Econs Policy Evaluation quiz, HY3 AI version, with questions, answers, and A Level-style practice for Singapore students.
These static practice materials are generated from the site's syllabus and paper-generation workflow, with source and model context shown so students and parents can evaluate the material before use.
Questions
Free quiz and exam paper access
Enter your details to view this paper
Your access is remembered on this device.
Answers
A-Level Economics H1 Quiz - Policy Evaluation (Answer Key)
Total Marks: 40 (20 questions × 2 marks)
Section A: Data-Based Policy Observation
Q1. [2 marks]
Both Country X and Country Y increased healthcare spending as % of GDP from 2019 to 2022. Country Y consistently spent more (6.8%→7.9%) than Country X (4.1%→5.6%). Country X's increase was 1.5 percentage points; Country Y's was 1.1 percentage points.
Marking: 1 mark for both show increase, 1 mark for comparative levels / magnitude.
Q2. [2 marks]
Yes, the subsidy achieved its intended aim. EV registrations rose from 3% to 11% (Extract A), an increase of 8 percentage points, showing stronger adoption after policy.
Marking: 1 mark for correct interpretation of data, 1 mark for linking to aim.
Q3. [2 marks]
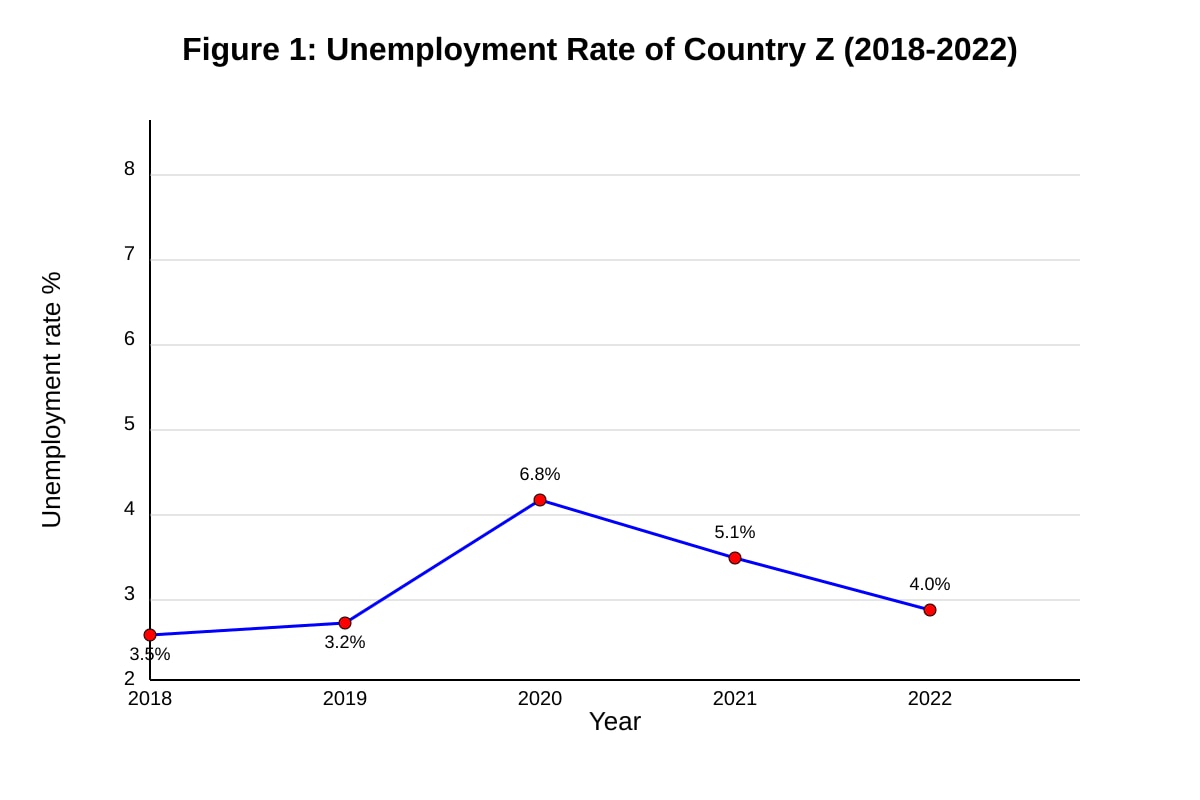
Unemployment rate fell from 3.5% (2018) to 3.2% (2019), then spiked to 6.8% (2020), before declining to 5.1% (2021) and 4.0% (2022). Overall it remained above initial level by 2022.
Marking: 1 mark for describing direction with years, 1 mark for noting turning point / net change.
Q4. [2 marks]
Revenue rose from 1.4b (2022), an increase of $0.6b (75% rise).
Marking: 1 mark for values, 1 mark for comparison / calculation of change.
Q5. [2 marks]
Unintended consequence: small firms reduced low-skilled hiring by 15% and larger firms automated, increasing unemployment among low-skilled workers.
Marking: 1 mark for identifying consequence, 1 mark for explaining from extract.
Section B: Structured Policy Evaluation
Q6. [2 marks]
One criterion: whether MSB = MSC after tax (allocative efficiency). If pollution tax internalises negative externality so that MSB = MSC at new output, it is effective.
Marking: 1 mark for criterion, 1 mark for explanation.
Q7. [2 marks]
Subsidy shifts supply right, price paid by consumers falls, quantity traded rises. (Diagram: S to S1, new equilibrium lower P, higher Q.)
Marking: 1 mark for price effect, 1 mark for quantity effect.
Q8. [2 marks]
(1) Redistribution via tax may reduce work incentive (efficiency loss). (2) Equity spending may require higher taxes distorting markets.
Marking: 1 mark each reason.
Q9. [2 marks]
Not equitable: grants targeted only manufacturing where 70% male and 60% over 40, excluding other groups (e.g., youth, services) from fair access.
Marking: 1 mark for identifying inequity, 1 mark for extract link.
Q10. [2 marks]
Short-run: may show cost or displacement; long-run: improves housing access and social stability. Evaluation needs both to avoid misleading conclusion.
Marking: 1 mark each time horizon.
Section C: Extended Evaluation
Q11. [2 marks]
Sugar tax raises price, reduces demand if elastic → less obesity (effective). But if demand inelastic, limited behaviour change; regressive impact on low income. Evaluation: partially effective depending on PED.
Marking: 1 mark for mechanism, 1 mark for caveat / evaluation.
Q12. [2 marks]
Country A more unequal (0.42→0.45) than B (0.31→0.30). Gap widened. Policy: progressive transfer or training for low-income.
Marking: 1 mark comparison, 1 mark policy suggestion.
Q13. [2 marks]
Compare marginal social benefit of road expansion vs marginal social cost; proceed if MSB > MSC. Evaluation uses marginal not total.
Marking: 1 mark principle, 1 mark application.
Q14. [2 marks]
Kept 30% firms alive (effective short-run), but arrivals 80% down (limited long-run recovery). Evaluation: mitigated collapse but not full solution.
Marking: 1 mark evidence, 1 mark evaluation.
Q15. [2 marks]
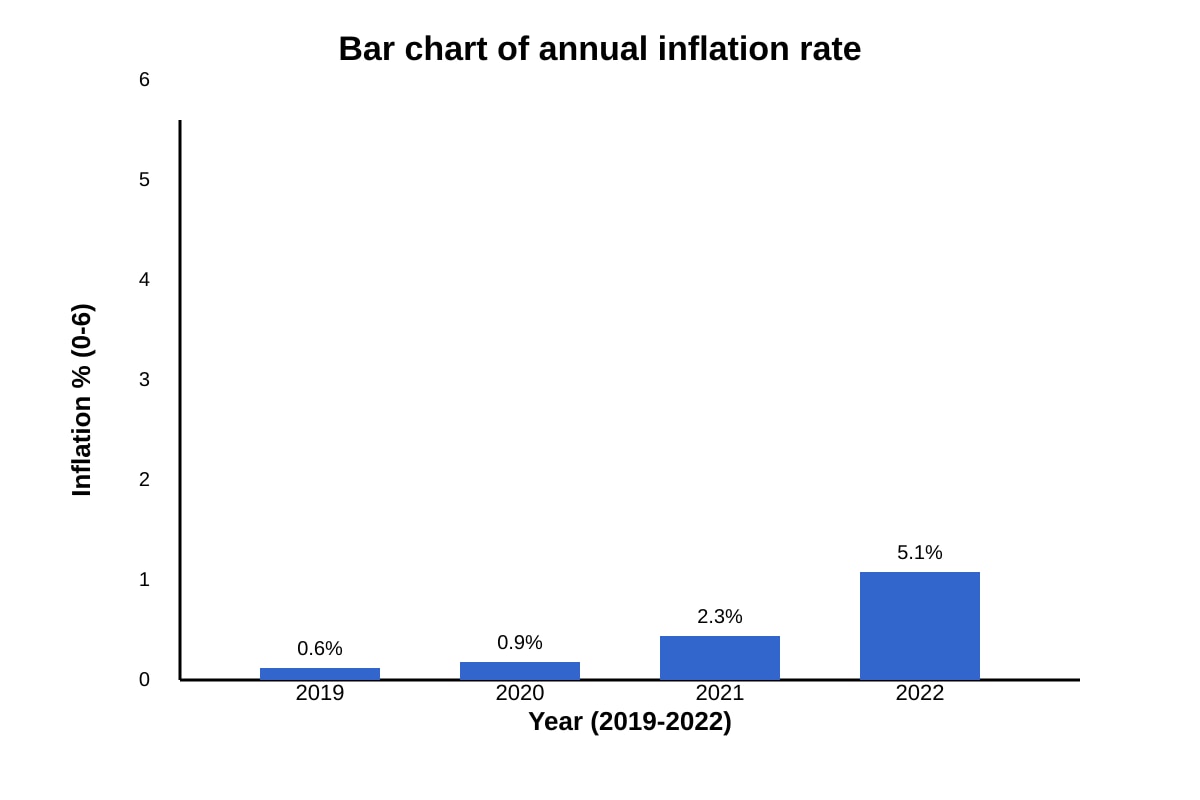
Inflation rose from 0.6% to 5.1% (accelerating post-2020). Policy: tighten monetary policy or reduce subsidies.
Marking: 1 mark trend, 1 mark policy.
Q16. [2 marks]
Free education benefits all but may favour those who use it most (e.g., urban). Equity not full if access barriers remain.
Marking: 1 mark benefit, 1 mark equity gap.
Q17. [2 marks]
Quota may protect local jobs (welfare for locals) but reduces firm efficiency and overall output (MSB<MSC). Not consistent if total welfare falls.
Marking: 1 mark point, 1 mark evaluation.
Q18. [2 marks]
(1) Pollution worsened → lower living standard despite GDP rise. (2) Inequality rose → gains not shared.
Marking: 1 mark each limitation.
Q19. [2 marks]
Subsidy shifts S right, lowers price, more solar adopted → less emissions (effective). But if grid still coal-based, environmental gain limited.
Marking: 1 mark diagram effect, 1 mark evaluation.
Q20. [2 marks]
Unintended effects (e.g., Q5 min wage cut jobs) mean policy may reduce welfare despite aim. Evaluation must include them.
Marking: 1 mark reason, 1 mark example.