AI Generated Quiz
A Level H1 Economics Market Failure Quiz
Free A Level H1 Econs Market Failure quiz, LongCat AI version, with questions, answers, and A Level-style practice for Singapore students.
These static practice materials are generated from the site's syllabus and paper-generation workflow, with source and model context shown so students and parents can evaluate the material before use.
Questions
A-Level Economics H1 Quiz - Market Failure
Name: ___________________________
Class: ___________________________
Date: ___________________________
Score: ________ / 60
Duration: 60 minutes
Total Marks: 60
Instructions
- Answer all questions in the spaces provided.
- Read each question carefully and use economic terminology where appropriate.
- For questions requiring diagrams, draw clearly and label fully.
- For evaluative questions, ensure you provide a balanced argument before reaching a conclusion.
- The number of marks for each question is shown in brackets [ ]. This indicates the depth of response expected.
Section A: Knowledge and Understanding (Questions 1–8)
Answer all questions. Each question carries 2 marks unless otherwise stated.
1. Define the term market failure. [2]
2. State two characteristics of a public good. [2]
(i) _________________________________________________________________________
(ii) ________________________________________________________________________
3. Distinguish between a merit good and a demerit good, giving one example of each. [2]
4. What is meant by a negative externality of production? Use an example in your answer. [2]
5. Explain the difference between social cost and private cost. [2]
6. State two reasons why asymmetric information leads to market failure. [2]
(i) _________________________________________________________________________
(ii) ________________________________________________________________________
7. What is a positive externality of consumption? Illustrate your answer with an example. [2]
8. Explain why the free market underprovides public goods. [2]
Section B: Application and Analysis (Questions 9–15)
Answer all questions.
9. The table below shows the estimated costs and benefits (in million dollars) of a proposed vaccination programme for a contagious disease in Singapore.
| Item | Private Benefit to Individuals | External Benefit to Society | Private Cost to Government |
|---|---|---|---|
| Vaccination Programme | $40m | $25m | $55m |
(a) Calculate the social benefit of the vaccination programme. [1]
(b) Calculate the social cost of the vaccination programme. [1]
(c) Using your answers, explain whether the vaccination programme is socially efficient. [2]
10. The diagram below represents the market for cigarettes, which generate negative externalities of consumption.
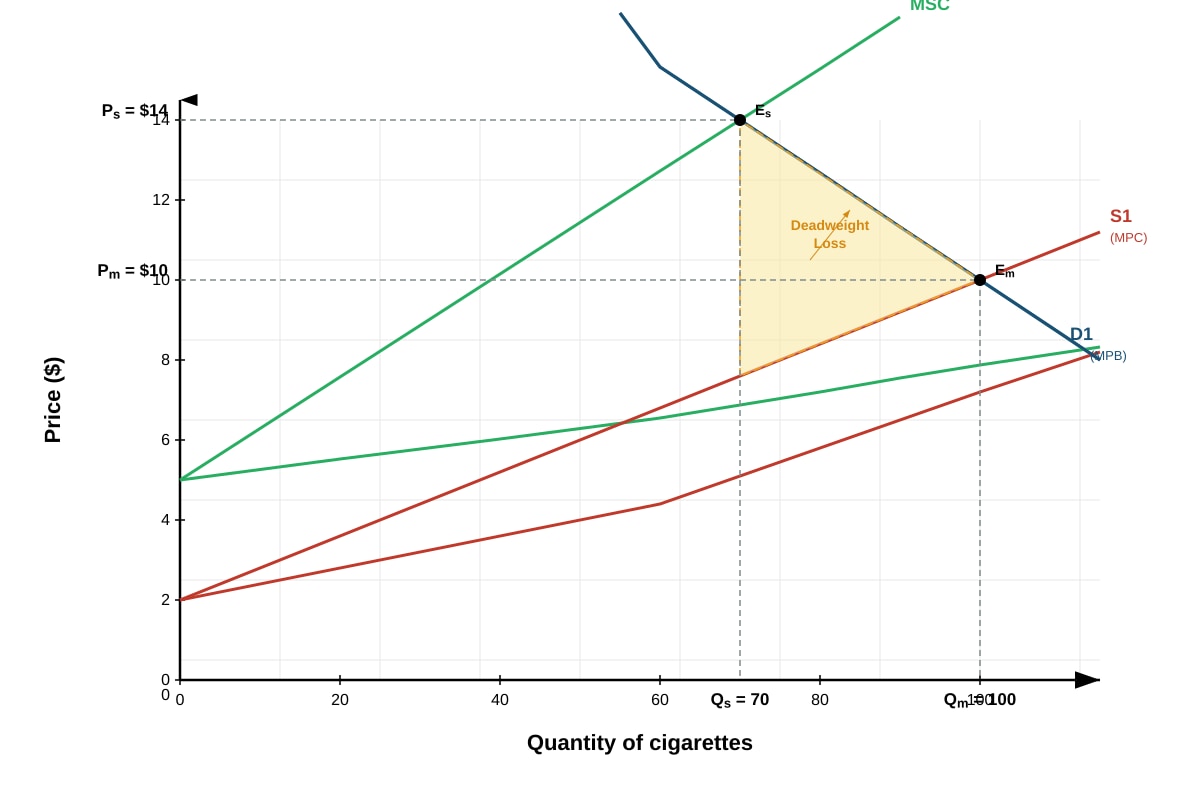
Generated graph for Q10.
(a) Using the diagram, identify the market equilibrium quantity and price. [1]
(b) Identify the socially optimal quantity and explain why it differs from the market equilibrium. [2]
(c) Shade and label the area representing deadweight loss on the diagram. [1]
(d) Explain what the deadweight loss represents in this context. [2]
11. The Singapore government imposes a tax on the producers of plastic packaging to correct for negative externalities of production.
(a) Explain how a tax on producers can reduce the output of plastic packaging to the socially optimal level. [3]
(b) Evaluate the effectiveness of taxation as a policy to correct market failure in the plastic packaging industry. [4]
12. The table below shows data on the market for education in a hypothetical country.
| Quantity of Education (thousands of students) | Marginal Private Benefit ($) | Marginal External Benefit ($) | Marginal Social Cost ($) |
|---|---|---|---|
| 10 | 5000 | 2000 | 3000 |
| 20 | 4000 | 2000 | 4000 |
| 30 | 3000 | 2000 | 5000 |
| 40 | 2000 | 2000 | 6000 |
| 50 | 1000 | 2000 | 7000 |
(a) Calculate the marginal social benefit at each quantity. Complete the table below. [2]
| Quantity | Marginal Social Benefit ($) |
|---|---|
| 10 | |
| 20 | |
| 30 | |
| 40 | |
| 50 |
(b) Determine the free market equilibrium quantity of education. Explain your reasoning. [2]
(c) Determine the socially optimal quantity of education. Explain your reasoning. [2]
(d) Explain why the free market underprovides education. [2]
13. The following extract is adapted from a news article:
"In 2023, the Singapore government announced a $1.5 billion investment in expanding the public rail network. Private operators had previously been unwilling to extend rail lines to outlying residential areas, citing insufficient fare revenue to cover construction and operating costs. The government argued that the expanded network would reduce road congestion, lower carbon emissions, and improve access to employment for residents in these areas."
(a) Identify and explain the type of market failure described in the extract. [3]
(b) Explain two external benefits of the rail expansion mentioned in the extract. [2]
(i) _________________________________________________________________________
(ii) ________________________________________________________________________
(c) Discuss whether government direct provision is the most effective way to correct this market failure. [4]
14. The diagram below shows the market for alcohol, a demerit good.
Image pending generation: graph for Q14.
(a) Explain why the marginal social benefit (MSB) curve lies below the demand curve for alcohol. [2]
(b) Using the diagram, identify the deadweight loss and explain what it represents. [3]
(c) Suggest one government policy, other than taxation, that could reduce alcohol consumption to the socially optimal level, and explain how it would work. [2]
15. Explain two reasons why the government may find it difficult to identify the exact size of the externality when designing policies to correct market failure. [4]
Reason 1:
Reason 2:
Section C: Evaluation and Synthesis (Questions 16–20)
Answer all questions.
16. The following extract is adapted from a policy report:
"The Singapore government has implemented a carbon tax of 25pertonneofgreenhousegasemissionssince2024,withplanstoraiseitto50–$80 per tonne by 2030. The tax applies to power stations and large industrial emitters producing over 25,000 tonnes of CO₂ equivalent annually. Revenue from the carbon tax is recycled through grants to help firms improve energy efficiency. Critics argue that the tax raises production costs, reduces Singapore's export competitiveness, and may lead to 'carbon leakage' — where firms relocate production to countries without carbon pricing. Supporters argue that the tax incentivises firms to adopt cleaner technologies and aligns with Singapore's commitment to net-zero emissions by 2050."
(a) Explain how a carbon tax corrects the market failure associated with carbon emissions. [4]
(b) Discuss whether a carbon tax is the most effective policy for Singapore to reduce greenhouse gas emissions. [6]
17. "Government intervention to correct market failure always leads to a more efficient allocation of resources." Evaluate this statement. [6]
18. The diagram below illustrates the market for urban road use during peak hours.
Image pending generation: graph for Q18.
(a) Using the diagram, explain why the free market leads to overuse of urban roads during peak hours. [3]
(b) Explain how a congestion tax can achieve the socially optimal level of road use. [3]
(c) Discuss the limitations of using a congestion tax to correct this market failure. [4]
19. The following extract is adapted from a report on healthcare in Singapore:
"In Singapore, the government provides subsidies for basic healthcare services and requires citizens to contribute to Medisave accounts. However, the private healthcare market also operates alongside public provision. Some economists argue that healthcare suffers from asymmetric information — patients rely on doctors to determine the treatment they need, and doctors may recommend more treatment than necessary (supplier-induced demand). Others argue that healthcare is a merit good that would be underconsumed without government intervention."
(a) Explain how asymmetric information in the healthcare market leads to market failure. [3]
(b) Discuss whether government subsidies or regulation of healthcare providers is more effective in correcting market failure in healthcare. [5]
20. "The provision of public goods should always be left to the government, not the private sector." Evaluate this statement with reference to examples. [6]
End of Quiz
Answers
A-Level Economics H1 Quiz - Market Failure
Answer Key and Marking Scheme
Section A: Knowledge and Understanding (Questions 1–8)
Question 1 [2 marks]
Answer:
Market failure occurs when the free market mechanism fails to allocate resources efficiently, resulting in a misallocation where marginal social benefit does not equal marginal social cost (MSB ≠ MSC). This leads to either overproduction or underproduction of goods and services relative to the socially optimal level.
Marking notes:
- 1 mark for defining market failure as the free market failing to allocate resources efficiently.
- 1 mark for referencing the condition MSB ≠ MSC (or equivalent explanation of divergence between private and social costs/benefits).
- Do not award full marks for only stating "the market does not work" without economic reasoning.
Question 2 [2 marks]
Answer:
(i) Non-rivalry — one person's consumption does not reduce the amount available for others.
(ii) Non-excludability — it is not possible to prevent anyone from consuming the good, even if they do not pay for it.
Marking notes:
- 1 mark for each correct characteristic.
- Examples (e.g., national defence, street lighting) are not required but may be credited if they reinforce the characteristic.
- "Non-rejectability" is not a standard characteristic and should not be credited.
Question 3 [2 marks]
Answer:
A merit good is a good that is underconsumed in a free market because individuals underestimate its private benefits (e.g., education, healthcare). A demerit good is a good that is overconsumed in a free market because individuals underestimate its private costs (e.g., cigarettes, alcohol).
Marking notes:
- 1 mark for correctly distinguishing between the two (underconsumption vs overconsumption, or underestimation of benefits vs underestimation of costs).
- 1 mark for providing a valid example of each.
- If only one example is given, award a maximum of 1 mark.
Question 4 [2 marks]
Answer:
A negative externality of production is a cost imposed on third parties (not the producer or consumer) as a result of the production of a good or service, which is not reflected in the market price. For example, a factory emitting pollution during manufacturing imposes health and environmental costs on nearby residents.
Marking notes:
- 1 mark for defining a negative externality of production (cost to third parties not reflected in market price).
- 1 mark for a valid example.
- The example must relate to production, not consumption. A consumption example (e.g., smoking) should not receive the example mark.
Question 5 [2 marks]
Answer:
Private cost is the cost of production or consumption borne directly by the individual producer or consumer. Social cost is the total cost to society, which equals private cost plus any external cost imposed on third parties. That is:
Social Cost=Private Cost+External Cost
Marking notes:
- 1 mark for defining private cost correctly.
- 1 mark for defining social cost as private cost plus external cost (or equivalent).
- Award 1 mark if the formula is given without verbal explanation, provided it is correct.
Question 6 [2 marks]
Answer:
(i) Adverse selection — one party (e.g., the seller) has more information than the other (e.g., the buyer), leading to the market being dominated by low-quality products (e.g., the market for used cars).
(ii) Moral hazard — one party changes their behaviour after a transaction takes place because the other party cannot fully monitor their actions (e.g., insured individuals taking greater risks).
Marking notes:
- 1 mark for each valid reason, up to 2 marks.
- Acceptable alternatives include: "leads to underprovision of goods," "causes misallocation of resources," or specific examples that clearly illustrate the concept.
- Both reasons must be distinct; do not award 2 marks for two examples of the same concept.
Question 7 [2 marks]
Answer:
A positive externality of consumption is a benefit enjoyed by third parties as a result of an individual's consumption of a good or service, which is not reflected in the market price. For example, when an individual receives a vaccination, they reduce the risk of disease transmission to others in the community.
Marking notes:
- 1 mark for defining a positive externality of consumption (benefit to third parties not reflected in market price).
- 1 mark for a valid example.
- The example must relate to consumption, not production.
Question 8 [2 marks]
Answer:
The free market underprovides public goods because of the free-rider problem. Since public goods are non-excludable, individuals can benefit from the good without paying for it. Therefore, private firms cannot charge a price and earn revenue, giving them no incentive to produce the good. As a result, the market either underprovides or does not provide public goods at all.
Marking notes:
- 1 mark for identifying the free-rider problem or non-excludability.
- 1 mark for explaining the consequence (no profit motive / no incentive for private firms to provide the good).
- Award a maximum of 1 mark if the answer only states "public goods are non-excludable" without explaining the underprovision.
Section B: Application and Analysis (Questions 9–15)
Question 9 [4 marks]
(a) [1 mark]
Social Benefit = Private Benefit + External Benefit = 40m+25m = $65m
(b) [1 mark]
In this case, the social cost equals the private cost to government = $55m (no external cost is mentioned).
(c) [2 marks]
Since the social benefit (65m)exceedsthesocialcost(55m), the vaccination programme is socially efficient — the net social benefit is positive ($10m). This means the programme generates more value to society than it costs, and therefore should be undertaken.
Marking notes:
- (a) and (b): 1 mark each for correct calculation.
- (c): 1 mark for comparing social benefit and social cost. 1 mark for concluding that the programme is socially efficient with justification.
- If the candidate incorrectly calculates (a) or (b) but uses their values consistently in (c), apply error carried forward (ECF) and award marks in (c) if the reasoning is correct.
Question 10 [6 marks]
(a) [1 mark]
Market equilibrium quantity = Qm = 100 units, price = Pm = $10.
(b) [2 marks]
The socially optimal quantity is Qs = 70 units (where D1 intersects MSC). It differs from the market equilibrium because the market equilibrium only considers private costs (S1), ignoring the external costs imposed on third parties. The socially optimal quantity takes into account the full social cost (MSC), which is higher than the private cost, leading to a lower optimal quantity.
(c) [1 mark]
The deadweight loss is the shaded triangle between the MSC curve and the S1 curve, from Qs (70) to Qm (100). (Candidate should shade this area on the diagram.)
(d) [2 marks]
The deadweight loss represents the welfare loss to society from overproduction of cigarettes. It is the excess of social cost over social benefit for the units produced between Qs and Qm (i.e., units 71 to 100). These units cost society more to produce than they are worth in terms of benefits to consumers, resulting in a net loss of economic welfare.
Marking notes:
- (a): 1 mark for correctly identifying both Qm and Pm.
- (b): 1 mark for identifying Qs. 1 mark for explaining the divergence (external costs not considered in market equilibrium).
- (c): 1 mark for correctly shading/identifying the deadweight loss area.
- (d): 1 mark for identifying it as a welfare loss. 1 mark for explaining it as the excess of social cost over social benefit in the overproduced range.
Question 11 [7 marks]
(a) [3 marks]
A tax on producers increases their marginal private cost of production, shifting the supply curve (or MPC curve) to the left/upward. This raises the market price and reduces the equilibrium quantity. If the tax is set equal to the marginal external cost at the socially optimal quantity, the new supply curve (MPC + tax) will intersect the demand curve at the socially optimal quantity, eliminating the overproduction and deadweight loss.
Marking scheme:
- 1 mark for explaining that the tax increases production costs / shifts supply curve leftward.
- 1 mark for explaining the resulting increase in price and decrease in quantity.
- 1 mark for stating that the tax should equal the marginal external cost to achieve the socially optimal outcome.
(b) [4 marks]
Arguments for effectiveness:
- Taxation internalises the externality by making producers pay for the external cost, leading to a more efficient allocation of resources.
- It generates government revenue that can be used to compensate affected parties or fund environmental clean-up.
- It provides a continuing incentive for firms to reduce pollution (e.g., adopt cleaner technology) to lower their tax burden.
Arguments against effectiveness:
- The government may find it difficult to accurately measure the marginal external cost, leading to a tax that is too high or too low, resulting in a new misallocation.
- Taxes may be passed on to consumers in the form of higher prices, which could disproportionately affect lower-income households (regressive effect).
- If demand is price inelastic, the tax may not significantly reduce quantity demanded, limiting its effectiveness.
- Firms may relocate production to countries without such taxes ("carbon leakage"), reducing the policy's global effectiveness.
Marking scheme:
- Up to 2 marks for explaining strengths of taxation.
- Up to 2 marks for explaining limitations.
- For full marks, the answer must present a balanced evaluation with at least one point on each side. A one-sided answer can receive a maximum of 3 marks.
Question 12 [8 marks]
(a) [2 marks]
Marginal Social Benefit = Marginal Private Benefit + Marginal External Benefit
| Quantity | Marginal Social Benefit ($) |
|---|---|
| 10 | 5000 + 2000 = 7000 |
| 20 | 4000 + 2000 = 6000 |
| 30 | 3000 + 2000 = 5000 |
| 40 | 2000 + 2000 = 4000 |
| 50 | 1000 + 2000 = 3000 |
Marking: 2 marks for all 5 correct. 1 mark for 3–4 correct. 0 marks for fewer than 3 correct.
(b) [2 marks]
The free market equilibrium occurs where Marginal Private Benefit = Marginal Social Cost. From the table, this occurs at 20 thousand students (where MPB = 4000andMSC=4000). In a free market, consumers only consider their private benefits, so they will consume up to the point where the benefit they receive equals the cost.
Marking: 1 mark for identifying the correct quantity. 1 mark for explaining the reasoning (MPB = MSC).
(c) [2 marks]
The socially optimal quantity occurs where Marginal Social Benefit = Marginal Social Cost. From the table, this occurs at 30 thousand students (where MSB = 5000andMSC=5000). This is higher than the free market equilibrium because education generates positive externalities that the free market ignores.
Marking: 1 mark for identifying the correct quantity. 1 mark for explaining the reasoning (MSB = MSC).
(d) [2 marks]
The free market underprovides education because individuals only consider their private benefits when deciding how much education to consume. They do not take into account the external benefits (e.g., a more productive workforce, lower crime rates, technological spillovers) that education provides to society. Since MSB > MPB at each quantity, the socially optimal level of education is higher than the free market level, resulting in underconsumption and a deadweight loss.
Marking: 1 mark for identifying that individuals only consider private benefits. 1 mark for explaining that external benefits are ignored, leading to underconsumption.
Question 13 [9 marks]
(a) [3 marks]
The extract describes market failure due to positive externalities and public good characteristics. The private rail operators are unwilling to extend rail lines because they cannot capture all the benefits — the fare revenue (private benefit) is insufficient to cover costs. However, the rail expansion generates significant external benefits to society, including reduced road congestion, lower carbon emissions, and improved access to employment. Since these external benefits are not reflected in the market price, the free market underprovides rail infrastructure.
Marking scheme:
- 1 mark for identifying the type of market failure (positive externalities / public good characteristics).
- 1 mark for explaining that private benefits are insufficient to cover costs.
- 1 mark for linking the external benefits to the underprovision by the free market.
(b) [2 marks]
(i) Reduced road congestion — when commuters switch from cars to rail, it reduces traffic congestion, benefiting all road users (a positive externality).
(ii) Lower carbon emissions — rail transport produces fewer emissions per passenger than private vehicles, benefiting society through improved air quality and reduced climate change impact (a positive externality).
Marking: 1 mark for each valid external benefit identified from the extract.
(c) [4 marks]
Arguments for direct provision:
- Direct provision ensures the rail network is built even when it is not profitable for the private sector, addressing the market failure directly.
- The government can take into account the full social benefits (reduced congestion, lower emissions, improved equity) when making investment decisions, leading to a more socially optimal outcome.
- Government provision can achieve economies of scale in large infrastructure projects.
Arguments against / limitations:
- Government provision may lead to government failure — inefficiency due to lack of profit motive, bureaucratic delays, and potential misallocation of resources.
- The government may not accurately assess the true social costs and benefits (information problem), leading to over- or under-investment.
- Direct provision requires significant government expenditure, which has an opportunity cost (the funds could be used elsewhere).
- Alternative policies such as subsidies to private operators or public-private partnerships might achieve the same outcome more efficiently by combining private sector efficiency with public sector objectives.
Marking scheme:
- Up to 2 marks for arguments supporting direct provision.
- Up to 2 marks for limitations or alternative approaches.
- For full marks, a balanced discussion with a reasoned conclusion is expected.
Question 14 [7 marks]
(a) [2 marks]
The MSB curve lies below the demand curve because consumers of alcohol underestimate the true costs of consumption to themselves (e.g., long-term health effects, addiction). The demand curve reflects marginal private benefit (what consumers perceive their benefit to be), while MSB reflects the true benefit to society, which is lower because the perceived private benefit overstates the actual benefit once the demerit good characteristics are accounted for.
Marking: 1 mark for stating that consumers underestimate costs / overestimate benefits. 1 mark for explaining the divergence between MPB and MSB.
(b) [3 marks]
The deadweight loss is the shaded triangle between the demand curve (MPB) and the MSB curve, from Qs (140) to Qm (200). It represents the welfare loss to society from the overconsumption of alcohol. For every unit consumed between 140 and 200, the true social benefit is less than the social cost of production, meaning society would be better off if these units were not consumed. The free market overproduces alcohol because consumers do not account for the full costs (both private and external) of their consumption.
Marking: 1 mark for identifying the deadweight loss area. 1 mark for stating it represents welfare loss. 1 mark for explaining the overconsumption due to divergence between private and social benefit.
(c) [2 marks]**
Policy: Regulation / Age restriction / Advertising ban
For example, a ban on alcohol advertising would reduce the demand for alcohol by limiting the information and social pressure that encourages consumption. This would shift the demand curve to the left, reducing the equilibrium quantity towards the socially optimal level. Alternatively, setting a minimum legal drinking age restricts access, reducing consumption among younger demographics who may be more prone to overconsumption.
Marking: 1 mark for suggesting a valid policy (not taxation). 1 mark for explaining how it reduces consumption (shifts demand left or restricts access).
Question 15 [4 marks]
Reason 1: Difficulty in measuring external costs/benefits in monetary terms
Externalities such as pollution, noise, or the social benefits of education are often intangible and do not have market prices. Placing a monetary value on, say, the health cost of air pollution or the social benefit of an educated citizen requires complex estimation methods (e.g., contingent valuation, hedonic pricing), which are inherently imprecise. This makes it difficult for the government to set the correct tax or subsidy level.
Reason 2: Externalities may be widespread and vary across time and location
The size of an externality may differ depending on the population density, time of day, or geographic area. For example, the external cost of air pollution is higher in densely populated urban areas than in rural areas. Similarly, the external benefit of education may vary depending on the state of the economy. This variability makes it difficult to design a uniform policy that accurately corrects the externality in all circumstances.
Marking: 2 marks per reason. Award 1 mark for identifying the reason and 1 mark for developing the explanation. Accept other valid reasons such as: information problems, time lags, political constraints, or the presence of multiple externalities.
Section C: Evaluation and Synthesis (Questions 16–20)
Question 16 [10 marks]
(a) [4 marks]
Carbon emissions generate a negative externality of production — the social cost of emissions (climate change, health impacts) exceeds the private cost borne by firms. In a free market, firms do not account for these external costs, leading to overproduction of carbon-intensive goods. A carbon tax increases the marginal private cost of production by the amount of the tax, effectively internalising the externality. The supply curve shifts leftward, raising the price and reducing the quantity of carbon-intensive output towards the socially optimal level where MSC = MSB. Firms are incentivised to adopt cleaner technologies to reduce their tax burden.
Marking scheme:
- 1 mark for identifying the negative externality of carbon emissions.
- 1 mark for explaining that firms do not account for external costs in a free market.
- 1 mark for explaining how the tax increases private costs / shifts supply curve.
- 1 mark for explaining the incentive to adopt cleaner technology.
(b) [6 marks]
Arguments that carbon tax is effective:
- It directly addresses the root cause (the externality) by internalising the external cost, leading to a more efficient allocation of resources.
- It provides a continuous incentive for firms to reduce emissions — the more they pollute, the more they pay.
- Revenue can be recycled to fund green technology or compensate affected groups.
- It is market-based and allows firms flexibility in how they reduce emissions (unlike command-and-control regulation).
Arguments that carbon tax may not be the most effective for Singapore:
- Singapore is a small, open economy — a carbon tax may reduce export competitiveness, especially for trade-exposed industries like petrochemicals and electronics.
- "Carbon leakage" — firms may relocate to countries without carbon pricing, leading to no net reduction in global emissions.
- The tax rate may be too low to significantly change behaviour, especially if demand for carbon-intensive goods is price inelastic.
- Alternative policies such as cap-and-trade systems, regulation of emission standards, or subsidies for renewable energy may be more effective in certain contexts.
- The government may face political resistance to raising the tax to the socially optimal level.
Conclusion:
A carbon tax is a theoretically sound policy, but its effectiveness in Singapore depends on the tax rate, the elasticity of demand for carbon-intensive goods, the availability of cleaner alternatives, and the risk of carbon leakage. A combination of policies (carbon tax + regulation + subsidies) may be more effective than relying on a single instrument.
Marking scheme:
- Up to 2 marks for explaining strengths of carbon tax.
- Up to 2 marks for discussing limitations in the Singapore context.
- Up to 2 marks for a balanced conclusion that weighs the arguments and reaches a reasoned judgement.
- A one-sided answer can receive a maximum of 4 marks.
Question 17 [6 marks]
Answer framework:
Agree — government intervention can improve efficiency:
- In the presence of negative externalities (e.g., pollution), taxation can internalise the externality, shifting output towards the socially optimal level and eliminating deadweight loss.
- In the case of positive externalities (e.g., education), subsidies can increase consumption towards the socially optimal level.
- For public goods, government provision overcomes the free-rider problem.
- Regulation can address information failures (e.g., requiring product labelling).
Disagree — government intervention may not always improve efficiency (government failure):
- Information problems: The government may not have sufficient information to accurately measure the size of the externality, leading to taxes or subsidies that are too high or too low, creating a new misallocation.
- Regulatory capture: Regulators may be influenced by the industries they regulate, leading to policies that favour producers over consumers.
- Bureaucratic inefficiency: Government provision may lack the profit motive, leading to X-inefficiency and higher costs than necessary.
- Opportunity cost: Government spending on intervention has an opportunity cost — the funds could have been used more productively elsewhere.
- Unintended consequences: Policies may create new distortions (e.g., a tax on one polluting industry may shift production to another polluting industry).
Conclusion:
Government intervention can lead to a more efficient allocation of resources if well-designed and accurately targeted. However, in practice, government failure means that intervention does not always improve outcomes. The effectiveness depends on the quality of information available, the design of the policy, and the ability of the government to implement it without creating new distortions.
Marking scheme:
- Up to 2 marks for arguments supporting the statement.
- Up to 2 marks for arguments against the statement (government failure).
- Up to 2 marks for a balanced conclusion with reasoned judgement.
- A one-sided answer can receive a maximum of 4 marks.
Question 18 [10 marks]
(a) [3 marks]
In the free market, drivers only consider their own private cost of using the road (fuel, time, vehicle wear) — represented by the MPC curve. They do not account for the additional congestion cost they impose on other drivers. As a result, the market equilibrium occurs at Qm (5000 vehicles), where demand equals MPC. However, at Qm, the marginal social cost (MSC) exceeds the marginal benefit (demand), meaning the last few drivers cost society more than they benefit. The socially optimal quantity is Qs (3500 vehicles), where demand equals MSC. The free market therefore leads to overuse of roads because drivers do not internalise the congestion externality.
Marking: 1 mark for identifying the market equilibrium at Qm. 1 mark for explaining that drivers ignore the congestion externality. 1 mark for comparing Qm to Qs and concluding overuse.
(b) [3 marks]
A congestion tax equal to the vertical distance between MSC and MPC at Qs (6pervehicle)wouldincreasethecostofroadusefordriversfrom0 to 6.ThisshiftstheeffectivecostcurvefacedbydriversfromMPCtoMPC+tax,whichintersectsthedemandcurveatQs(3500vehicles).Driversnowfacethefullsocialcostoftheirdecision,internalisingthecongestionexternality.Thosewhovalueroadusemorethan6 will continue to drive; those who value it less will switch to public transport or travel at off-peak times.
Marking: 1 mark for stating the tax amount ($6). 1 mark for explaining that it internalises the externality. 1 mark for explaining the resulting reduction in quantity to Qs.
(c) [4 marks]
Limitations:
- Measurement difficulty: The optimal congestion tax varies by time of day, location, and traffic conditions. Setting a uniform tax may be too blunt an instrument.
- Equity concerns: Congestion taxes are regressive — lower-income drivers may be priced off the road while wealthier drivers continue to drive, raising fairness issues.
- Demand elasticity: If demand for road use is price inelastic (e.g., commuters with no viable public transport alternative), the tax may not significantly reduce congestion.
- Administrative costs: Implementing and enforcing an electronic road pricing system requires significant investment in technology and administration.
- Political acceptability: Congestion taxes are often unpopular, making it difficult for governments to implement or increase them.
Marking: 2 marks for each well-explained limitation, up to 4 marks. Accept other valid limitations.
Question 19 [8 marks]
(a) [3 marks]
Asymmetric information in healthcare arises because doctors (suppliers) have far more medical knowledge than patients (consumers). Patients rely on doctors to diagnose conditions and recommend treatments. This creates the problem of supplier-induced demand — doctors may recommend more treatment, tests, or procedures than medically necessary, either to increase their income or to practise defensive medicine (avoiding malpractice lawsuits). Since patients cannot independently assess whether the treatment is necessary, they agree to it. This leads to overconsumption of healthcare services relative to the socially optimal level, resulting in market failure.
Marking: 1 mark for identifying the information asymmetry (doctor knows more than patient). 1 mark for explaining supplier-induced demand. 1 mark for linking it to overconsumption / market failure.
(b) [5 marks]
Government subsidies:
- Subsidies lower the price of healthcare, increasing consumption towards the socially optimal level (addressing underconsumption of a merit good).
- They improve access for lower-income groups, promoting equity.
- However, subsidies may lead to overconsumption if patients face a lower price and consume healthcare they do not truly need (moral hazard).
- Subsidies also have a significant opportunity cost for the government budget.
Regulation of healthcare providers:
- Regulation (e.g., licensing requirements, treatment guidelines, caps on fees) can address supplier-induced demand by limiting doctors' ability to over-treat.
- It can ensure minimum quality standards, protecting patients.
- However, regulation may be costly to enforce and may reduce innovation or flexibility in treatment.
- Regulatory capture is a risk — the medical profession may influence regulations in its own interest.
Evaluation:
In Singapore's context, a combination of both policies is used — Medisave and government subsidies ensure affordability and access, while regulation (e.g., the Ministry of Health's oversight of healthcare providers) addresses information asymmetry. Neither policy alone is sufficient. Subsidies alone would worsen moral hazard; regulation alone would not address underconsumption by low-income groups. The most effective approach is a complementary mix of both.
Marking scheme:
- Up to 2 marks for discussing subsidies (strengths and limitations).
- Up to 2 marks for discussing regulation (strengths and limitations).
- 1 mark for a reasoned conclusion that evaluates which is more effective or argues for a combination.
Question 20 [6 marks]
Answer framework:
Agree — government should provide public goods:
- Public goods are non-rival and non-excludable, meaning private firms cannot charge consumers and therefore have no incentive to produce them (free-rider problem).
- Without government provision, public goods such as national defence, street lighting, and public infrastructure would be severely underprovided or not provided at all.
- Government provision ensures universal access, which is important for equity and social welfare.
- The government can finance provision through taxation, overcoming the free-rider problem.
Disagree — private sector can play a role:
- Public-private partnerships (PPPs): The private sector can be contracted by the government to provide public goods more efficiently, leveraging private sector expertise and innovation while the government retains ownership and oversight (e.g., toll roads, public transport).
- Technology can enable excludability: Advances in technology (e.g., electronic road pricing, digital rights management) can make some goods excludable, allowing private provision (e.g., toll roads, pay-per-view broadcasting).
- Merit goods vs public goods: Some goods traditionally considered public goods may actually be merit goods (e.g., education, healthcare), which can be provided by the private sector with government subsidies or regulation.
- Government failure: Government provision may be inefficient due to lack of profit motive, bureaucratic inefficiency, and political interference. Private provision may be more cost-effective in some cases.
Conclusion:
While the government has a primary role in providing pure public goods (e.g., national defence), the private sector can complement government provision through PPPs and technological solutions. The optimal approach depends on the specific good, the feasibility of exclusion, and the relative efficiency of public vs private provision.
Marking scheme:
- Up to 2 marks for arguments supporting government provision.
- Up to 2 marks for arguments supporting a role for the private sector.
- Up to 2 marks for a balanced conclusion with examples and reasoned judgement.
- A one-sided answer can receive a maximum of 4 marks.
End of Answer Key
Total Marks: 60
| Section | Questions | Marks |
|---|---|---|
| A: Knowledge and Understanding | 1–8 | 16 |
| B: Application and Analysis | 9–15 | 30 |
| C: Evaluation and Synthesis | 16–20 | 34 |
| Total | 60 |
Note: Section totals above are approximate based on individual question marks. The exact total is 60 marks as stated on the quiz cover.
Free quiz and exam paper access
Enter your details to view this paper
Your access is remembered on this device.