AI Generated Quiz
A Level H1 Economics Market Failure Quiz
Free A Level H1 Econs Market Failure quiz, HY3 AI version, with questions, answers, and A Level-style practice for Singapore students.
These static practice materials are generated from the site's syllabus and paper-generation workflow, with source and model context shown so students and parents can evaluate the material before use.
Questions
A-Level Economics H1 Quiz - Market Failure
Name: ___________________________
Class: ___________________________
Date: ___________________________
Score: _______ / 40
Duration: 60 minutes
Total Marks: 40
Instructions:
- This quiz contains 20 questions on the topic of Market Failure.
- Section A: Multiple-choice (1 mark each). Section B: Short structured questions (2 marks each). Section C: Data-based and extended questions (3–5 marks each).
- Answer all questions. Use diagrams where requested and show working for calculation items.
- This is syllabus-first practice content generated from LLM-inferred templates; it is not derived from past-year exam papers.
Section A: Multiple-Choice (Questions 1–5, 1 mark each)
1. Which of the following is a defining characteristic of a public good?
A. It is provided only by the private sector.
B. It is both rivalrous and excludable.
C. It is non-rivalrous and non-excludable.
D. It always generates positive externalities.
2. A negative externality in production means that at the market equilibrium,
A. private cost equals social cost.
B. marginal social cost exceeds marginal private cost.
C. marginal private benefit exceeds marginal social benefit.
D. the good is under-consumed.
3. Information failure occurs when
A. firms have perfect knowledge of consumer preferences.
B. consumers or producers make decisions based on incomplete or incorrect information.
C. the government publishes too many statistics.
D. prices are set by the price mechanism efficiently.
4. A subsidy to correct a positive externality in consumption should be set equal to
A. the difference between marginal private benefit and marginal social cost.
B. the difference between marginal social benefit and marginal private benefit at the socially optimal output.
C. the total private cost of production.
D. the deadweight loss at market equilibrium.
5. Which policy is most directly aimed at reducing the quantity of a good that creates negative externalities?
A. Direct provision of the good
B. Tradeable permits
C. Public education campaigns only
D. Removing price controls
Section B: Short Structured Questions (Questions 6–10, 2 marks each)
6. Explain why a purely private market would tend to under-provide public goods such as street lighting.
7. Using the concept of marginal social cost (MSC) and marginal private cost (MPC), explain why a negative production externality leads to over-production at the free market equilibrium.
8. State two examples of positive externalities in consumption that are common in Singapore.
(i) ___________________________
(ii) ___________________________
9. Explain how information failure may lead to the consumption of a good that is harmful to health despite available alternatives.
10. A government imposes a maximum price on an essential good below the equilibrium price. Explain one unintended consequence that may arise.
Section C: Data-Based and Extended Questions (Questions 11–20)
11. [3 marks] Using the data below, calculate the deadweight loss (in $) from the negative externality shown. Show your working.
- Market equilibrium quantity: 100 units
- Socially optimal quantity: 70 units
- Gap between MSC and MPC at relevant output: $4 per unit (constant)
Working: _______________________________________________________
Answer: $__________
12. [3 marks] Explain how a tax can move the market from the free equilibrium to the socially optimal output for a negative externality in production. Use the terms MPC, MSC, and marginal private benefit (MPB) in your answer.
13. [4 marks] The table below shows daily commuter numbers and estimated external cost per trip for two transport modes in City X.
| Mode | Private car users | Public bus users |
|---|---|---|
| Trips per day | 40,000 | 120,000 |
| External cost per trip | $1.50 | $0.20 |
(a) Calculate the total daily external cost for each mode. [2]
Private car: __________
Public bus: __________
(b) Explain why the government might use a subsidy to encourage bus use. [2]
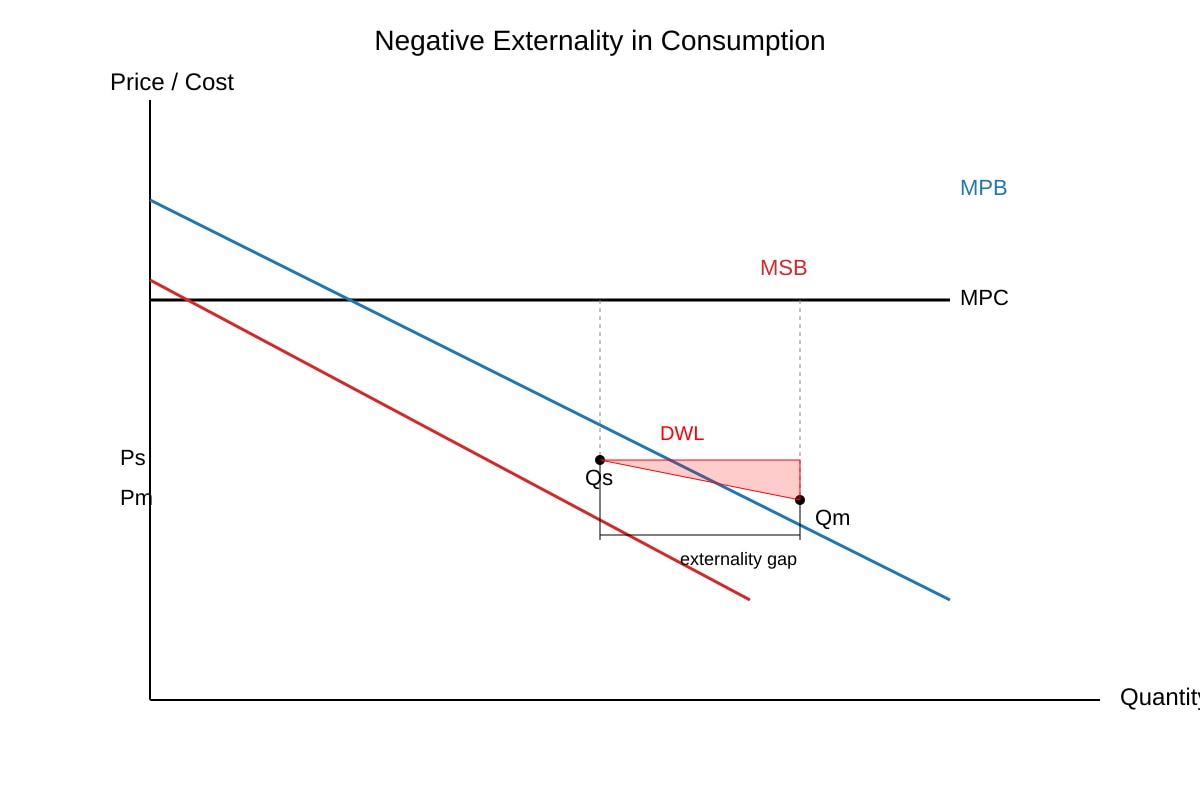
14. [3 marks] Draw a diagram showing negative externality in consumption (MPB, MSB, MPC). Label the market equilibrium and socially optimal equilibrium.
(Use the placeholder below for the required diagram details.)
Image pending generation: diagram for Q14.
Briefly state the location of the socially optimal output relative to market output.
15. [4 marks] Read the extract:
Extract A: "In Town Y, many residents do not install solar panels because they are unaware that the government gives a 30% rebate and that panels reduce long-run electricity bills. As a result, fewer panels are installed than socially desirable, and the town misses out on lower carbon emissions."
(a) Identify the type of market failure shown. [1]
(b) Explain how the lack of information leads to under-consumption. [2]
(c) Suggest one policy to correct it. [1]
16. [3 marks] A positive externality in production exists in the training of workers by firms. Explain why this may lead to under-training from a social perspective and how a subsidy helps.
17. [5 marks] Evaluate the use of tradeable permits as a policy to reduce industrial pollution (negative externality). In your answer, consider efficiency, equity, and possible limitations.
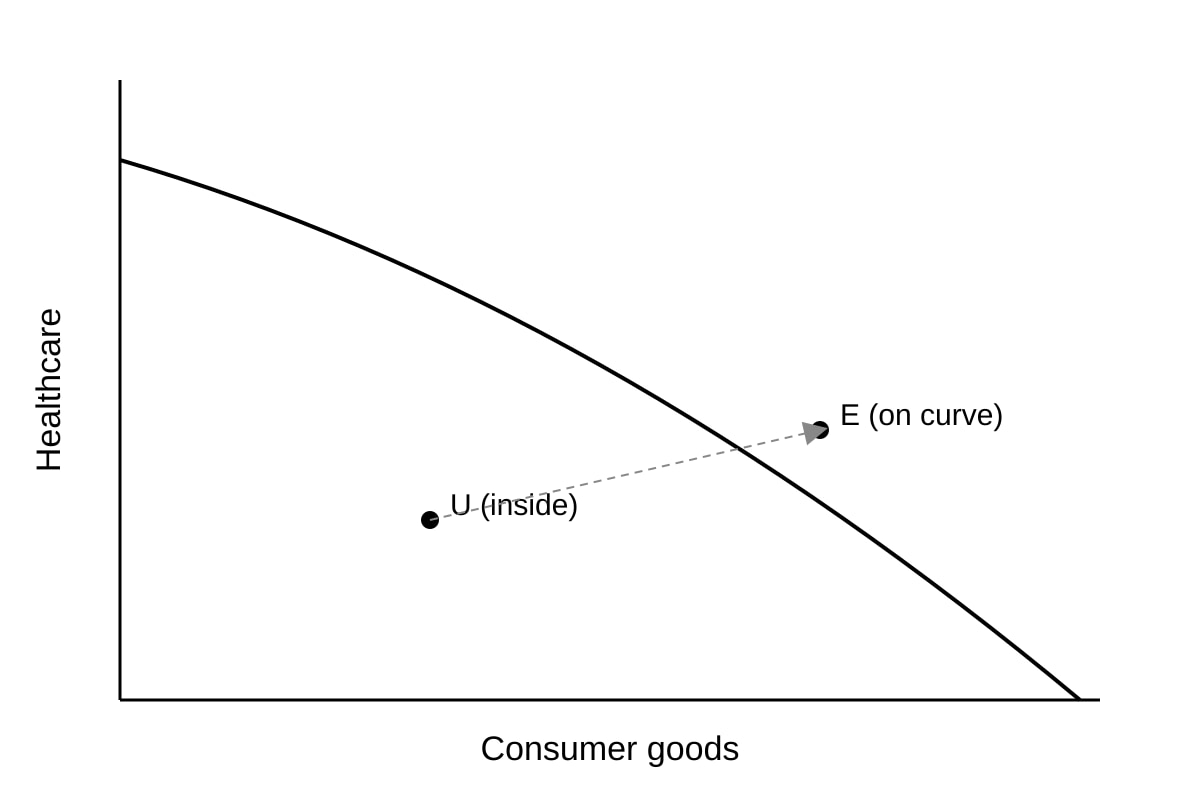
18. [3 marks] The figure shows the PPC for an economy producing healthcare (public good) and consumer goods.
Image pending generation: graph for Q18.
Explain how under-provision of public goods relates to point U on the PPC.
19. [4 marks] Compare a subsidy and a regulation as methods to correct a negative externality from plastic bag use. Use a table or bullet points to show two differences.
20. [5 marks] Using a demand-supply diagram and economic reasoning, explain how a tax on cigarettes (negative consumption externality) affects consumer expenditure and government revenue. Include in your answer the concepts of elasticity where relevant.
Answers
A-Level Economics H1 Quiz - Market Failure (Answer Key)
Total Marks: 40
Topic: Market Failure (syllabus-first, LLM-inferred templates)
Section A: Multiple-Choice (1 mark each)
1. C [1]
Teaching note: A public good is non-rivalrous (one person's use does not reduce another's) and non-excludable (cannot prevent non-payers from using). Private markets under-provide such goods because of the free-rider problem. Options A and B describe private goods; D is not defining.
2. B [1]
Teaching note: Negative externality in production → MSC > MPC at any output. Market equates MPC with MPB, ignoring external cost, so output is too high. A is false; C describes consumption externality; D is wrong (over-consumed).
3. B [1]
Teaching note: Information failure = agents lack correct info, leading to suboptimal decisions. A and D describe efficient outcomes; C is irrelevant.
4. B [1]
Teaching note: For positive consumption externality, MSB > MPB. Subsidy = MSB – MPB at optimal Q to internalise benefit. A mixes cost/benefit; C and D incorrect.
5. B [1]
Teaching note: Tradeable permits cap total quantity and reduce output of polluting good. A increases provision; C alone may not change quantity; D unrelated.
Section B: Short Structured (2 marks each)
6. [2]
- Non-excludability means people can free-ride (1 mark).
- Firms cannot charge, so no profit incentive to provide; market supplies less than efficient amount (1 mark).
Teaching: Street lighting benefits all; private firm cannot exclude non-payers, so under-provision.
7. [2]
- MPC is cost to producer; MSC = MPC + external cost, so MSC > MPC (1 mark).
- Market uses MPC=MPB, giving Qm > Qs where MSC=MSB; over-production (1 mark).
8. [2]
Any two: vaccination (herd immunity), education (skilled workforce), tree planting (clean air), public transport use (less congestion). (1 mark each)
9. [2]
- Consumers unaware of harm or alternatives (1 mark).
- They base choice on wrong info, consuming more than socially optimal (1 mark).
10. [2]
- Shortage as Qd > Qs at low price (1 mark).
- Black market or reduced quality/supply may result (1 mark).
Section C: Data-Based and Extended
11. [3]
Working: DWL = ½ × base × height = ½ × (100–70) × 4=½×30×4 = 60.Answer:60 (3 marks: 1 for formula, 2 for correct calc).
Teaching: Triangle between Qs and Qm under MSC–MPC gap.
12. [3]
- Tax shifts MPC up to MPC+tax, now equal MSC (1).
- New equilibrium where MPC+tax = MPB gives Qs (1).
- Aligns private cost with social cost, correcting over-production (1).
13. [4]
(a) Car: 40,000 × 1.50=60,000 [1]; Bus: 120,000 × 0.20=24,000 [1].
(b) Bus has lower external cost; subsidy lowers fares, raises Q, improves efficiency/equity (2).
14. [3]
Diagram per placeholder: MPB above MSB, MPC vertical; Qm right of Qs.
Socially optimal output is lower than market output (Qs < Qm) (3: 1 diagram labels, 2 explanation).
Visual must show deadweight loss shaded.
15. [4]
(a) Information failure (1).
(b) Residents unaware of rebate/benefit → perceive MPB lower than true MSB → install less (2).
(c) Public education or rebate info campaign (1).
16. [3]
- Firm training gives spillover skills to other firms (MSB>MPB) (1).
- Market trains where MPB=MPC, below Qs (1).
- Subsidy = MSB–MPB raises training to optimal (1).
17. [5]
Mark descriptors:
- Efficiency: cap ensures total pollution at target, firms with low abatement cost sell permits (2).
- Equity: critics say permits let rich pollute; initial allocation may favour incumbents (1).
- Limitations: monitoring cost, price volatility, may not reduce if cap loose (2).
Teaching: Evaluate via Decision-Making Approach trade-offs.
18. [3]
- Point U = under-utilisation of resources (1).
- If public goods under-provided, economy inside PPC (1).
- Moving to E requires better resource use incl. public goods (1).
19. [4]
Differences (2 pairs):
- Subsidy: financial incentive, keeps market role; Regulation: command, may ban (2).
- Subsidy: cost to gov; Regulation: compliance cost to firms (2).
20. [5]
- Diagram: tax shifts MPB down (or MPC up) to MSB, Q falls (2).
- If demand inelastic, consumer expenditure may rise; gov revenue = tax×new Q (2).
- Elasticity determines burden (1).
Teaching: Show tax incidence and total rev.
Free quiz and exam paper access
Enter your details to view this paper
Your access is remembered on this device.