AI Generated Quiz
A Level H1 Economics Macroeconomics Quiz
Free A Level H1 Econs Macroeconomics quiz, HY3 AI version, with questions, answers, and A Level-style practice for Singapore students.
These static practice materials are generated from the site's syllabus and paper-generation workflow, with source and model context shown so students and parents can evaluate the material before use.
Questions
Free quiz and exam paper access
Enter your details to view this paper
Your access is remembered on this device.
Answers
A-Level Economics H1 Quiz - Macroeconomics (Answer Key)
Total Marks: 40
Level: A-Level H1
Topic: Macroeconomics
Note: Content generated from LLM-inferred templates (Stage 4/5) using syllabus-first design. Not claimed as past-year exam derived.
Q1. [2 marks]
Aggregate Demand (AD) is the total spending on domestic goods and services in an economy.
Components: Consumption (C), Investment (I), Government spending (G), Net exports (X – M).
Marking: 1 mark for definition, 1 mark for listing C, I, G, X–M.
Q2. [2 marks]
Country A and B both fell in 2020 (A: -4.5%, B: -2.0%) and recovered after. Country A was more volatile, with sharper fall and higher rebound (2021: 6.0% vs 4.3%). By 2022, A (3.8%) > B (3.0%).
Marking: 1 mark for comparing direction/magnitude, 1 mark for noting relative volatility.
Q3. [2 marks]
Higher consumer confidence increases expected future income security, leading to higher consumption (C), which is a component of AD, shifting AD right.
Marking: 1 mark for link to C, 1 mark for AD shift explanation.
Q4. [2 marks]
(a) Investment = injection
(b) Savings = leakage
Marking: 1 mark each.
Q5. [2 marks]
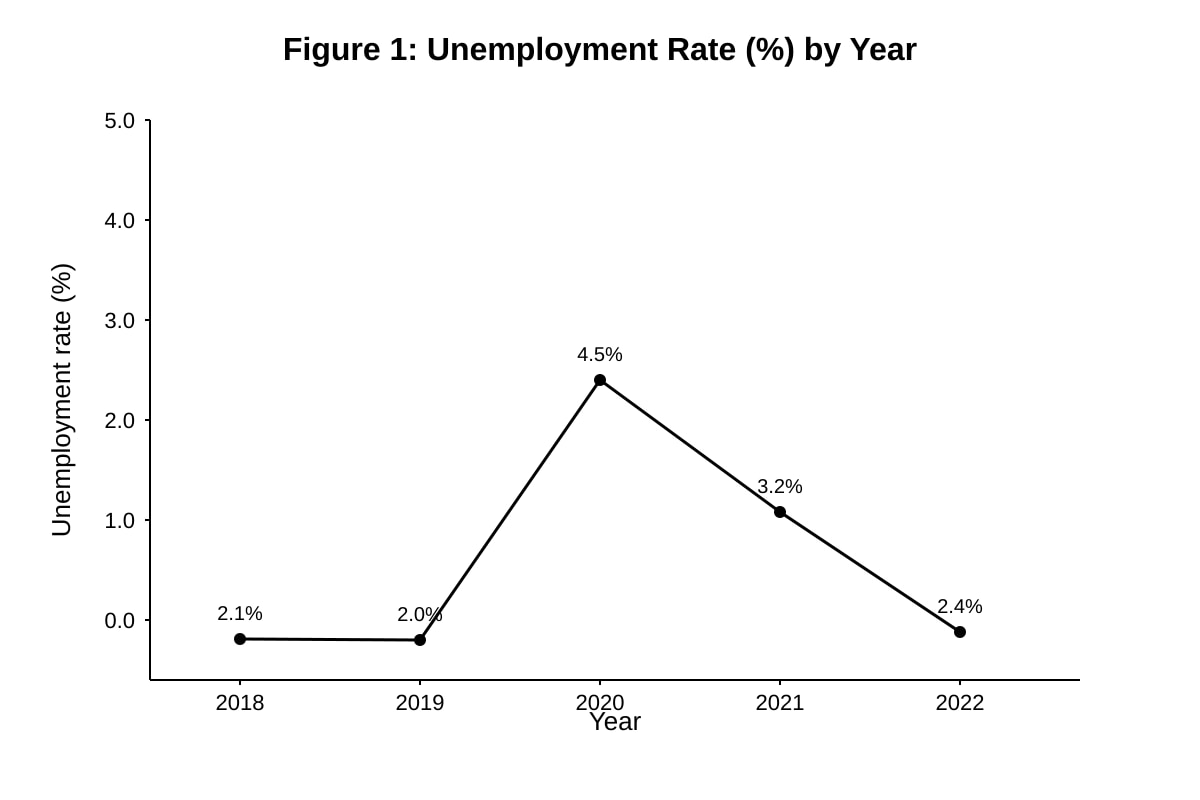
Unemployment rate was stable in 2018–19 (~2%), rose sharply to 4.5% in 2020, then fell to 2.4% by 2022.
Marking: 1 mark for describing rise, 1 mark for describing fall/recovery. Based on fig1 values.
Q6. [2 marks]
Any two: low unemployment, low inflation, economic growth, stable balance of payments, equitable income distribution.
Marking: 1 mark each.
Q7. [2 marks]
G is a component of AD. Increase in G raises total spending → AD curve shifts right (increase in AD).
Marking: 1 mark for component link, 1 mark for shift.
Q8. [2 marks]
Trade balance = X – M = 620 – 580 = S$40 billion.
Marking: 1 mark for formula, 1 mark for correct value.
Q9. [2 marks]
Stronger exchange rate lowers import prices in local currency → cheaper raw materials and goods → reduces cost-push inflation pressure.
Marking: 1 mark for cheaper imports, 1 mark for inflation link.
Q10. [4 marks]
Comparison: C inflation rose from 0.5% to 4.0% (2020–22), D rose to 3.0% then fell to 2.5%. C ended higher.
Reason: C may have experienced stronger demand-pull inflation from rapid recovery.
Marking: 2 marks comparison, 2 marks reason.
Q11. [4 marks]
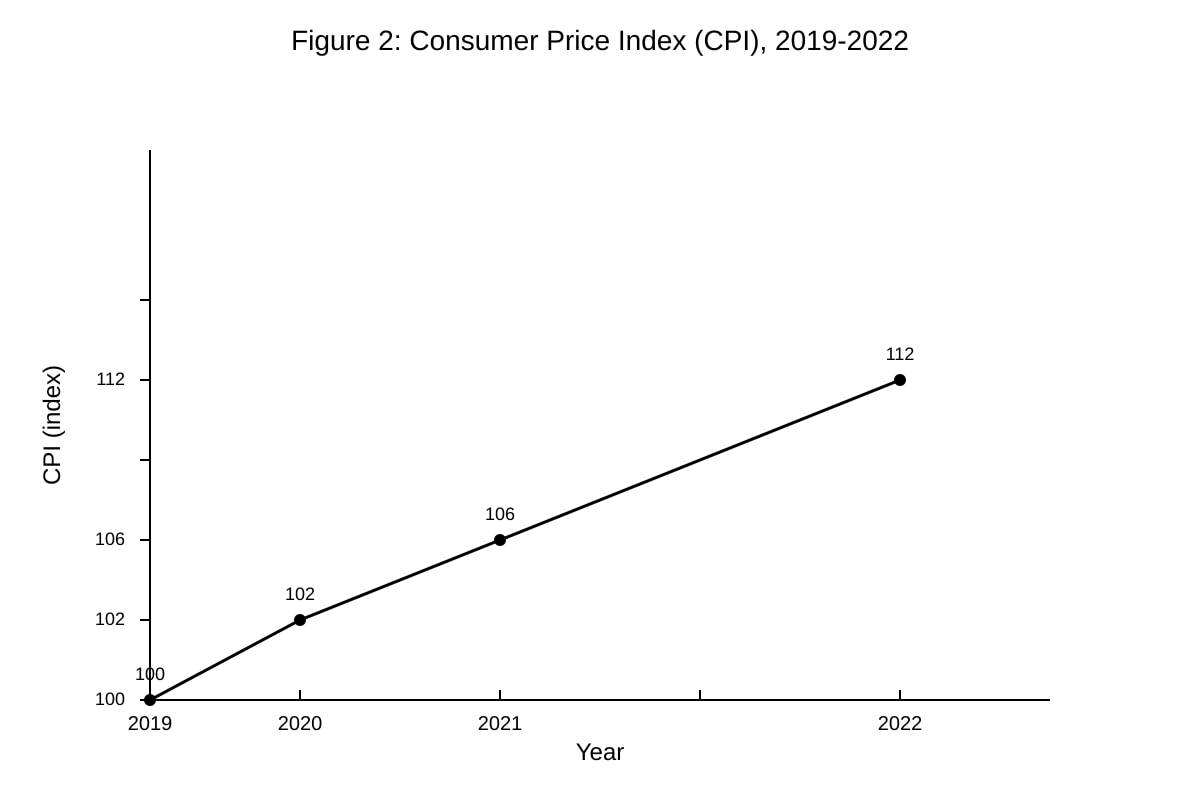
Trend: CPI rose from 100 (2019) to 112 (2022), with accelerating increase after 2020.
Implication: Rising prices reduce real purchasing power of consumers.
Marking: 2 marks trend, 2 marks implication. Based on fig2.
Q12. [2 marks]
Lower interest rates reduce cost of borrowing → firms more likely to invest in capital → I increases.
Marking: 1 mark cost, 1 mark investment rise.
Q13. [2 marks]
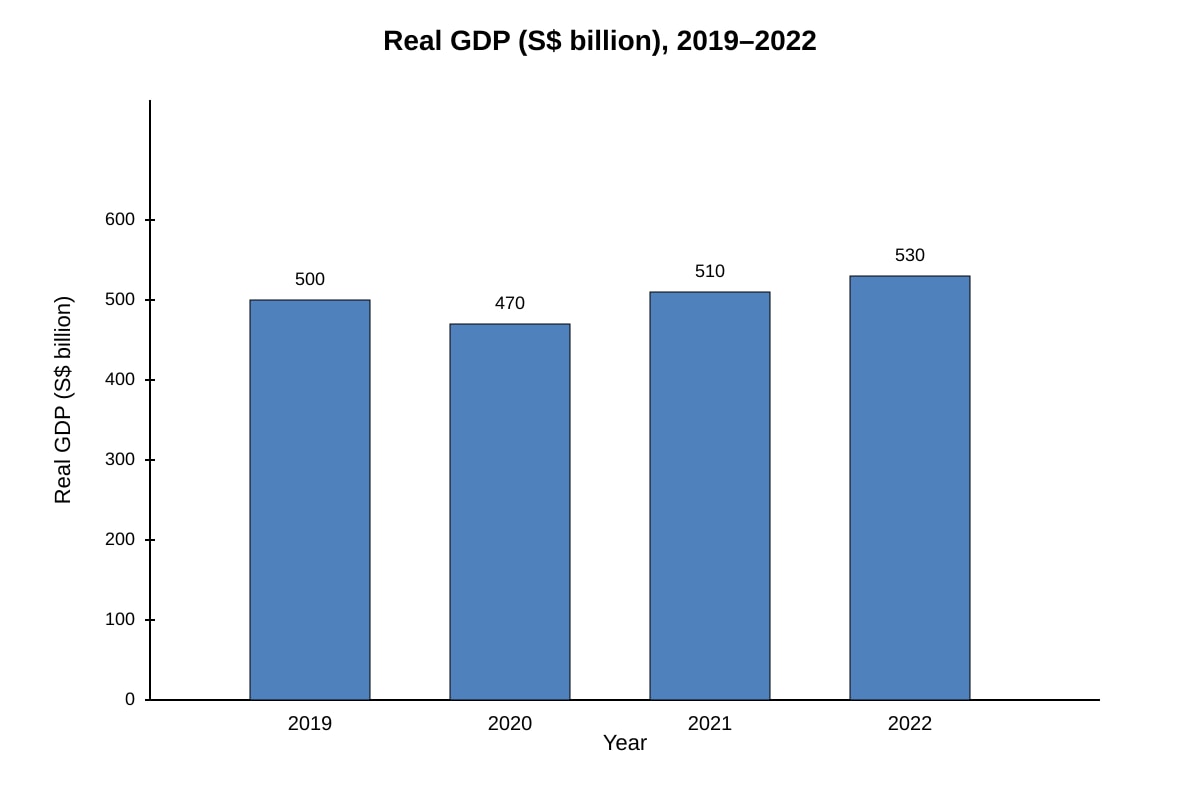
Real GDP fell in 2020 (500→470), then rose to 530 by 2022, exceeding 2019 level.
Marking: 1 mark fall, 1 mark rise. Based on fig3.
Q14. [2 marks]
Any two: environmental degradation, inflation, income inequality, resource depletion.
Marking: 1 mark each.
Q15. [2 marks]
Diagram: AD and AS curves crossing at P1,Y1. Shift AD right to AD2, new equilibrium P2,Y2 (P2>P1, Y2>Y1).
Marking: 1 mark initial, 1 mark shift+label.
Q16. [2 marks]
Rightward AD shift increases both equilibrium price (from P1 to P2) and output (Y1 to Y2) assuming SRAS upward sloping.
Marking: 1 mark price, 1 mark output.
Q17. [2 marks]
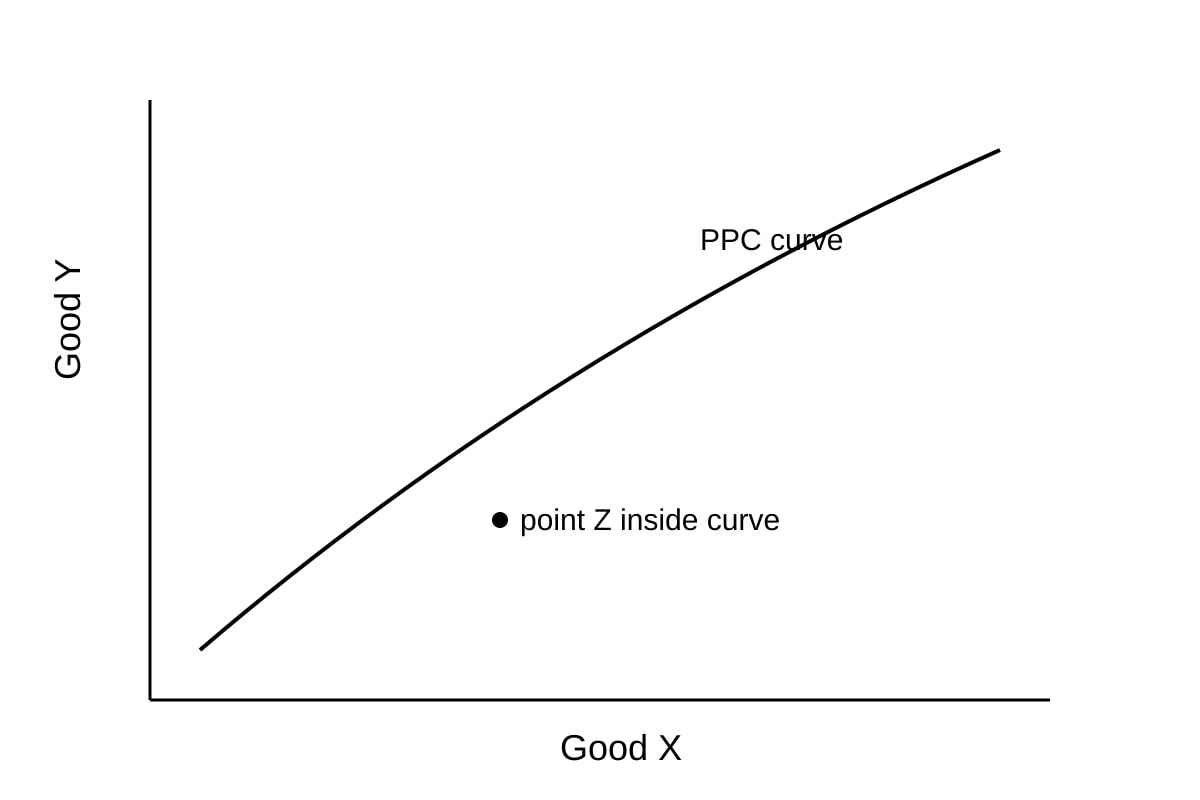
Point Z inside PPC means economy produces less than potential → resources under-utilised (e.g., unemployment).
Marking: 1 mark inside, 1 mark under-utilisation. Based on fig4.
Q18. [2 marks]
Adv: easy to compare across countries. Disadv: ignores income distribution and non-market welfare.
Marking: 1 mark each.
Q19. [2 marks]
Higher income tax reduces disposable income → lowers C → AD left → reduces demand-pull inflation. But may slow growth.
Marking: 1 mark mechanism, 1 mark trade-off.
Q20. [2 marks]
Unemployment fell (5.0→3.8), GDP growth fell (3.5→2.0). Trade-off: lower unemployment came with slower growth.
Marking: 1 mark compare, 1 mark trade-off.