AI Generated Quiz
A Level H1 Economics International Economics Quiz
Free A Level H1 Econs International Economics quiz, HY3 AI version, with questions, answers, and A Level-style practice for Singapore students.
These static practice materials are generated from the site's syllabus and paper-generation workflow, with source and model context shown so students and parents can evaluate the material before use.
Questions
Free quiz and exam paper access
Enter your details to view this paper
Your access is remembered on this device.
Answers
A-Level Economics H1 Quiz - International Economics (Answer Key)
Total Marks: 40
Topic: International Economics
Level: A-Level H1
Section A: Data and Concept Interpretation
Q1. [2 marks]
Definition: The balance of trade is the difference between the value of a country's exports of goods and the value of its imports of goods (merchandise only).
Teaching note: It is a component of the current account. Do not include services.
Marking: 1 mark for exports minus imports; 1 mark for "goods/merchandise only".
Q2. [2 marks]
Both countries had trade imbalances throughout. Country A ran a growing deficit: from -12.4 to -18.7 (worsened by 2.8b).
Marking: 1 mark for correct description of A; 1 mark for B. Must compare both.
Q3. [2 marks]
Tariff = a tax on imports that raises price and generates government revenue. Quota = a physical limit on import quantity that restricts volume but not necessarily via price tax.
Marking: 1 mark each.
Q4. [2 marks]
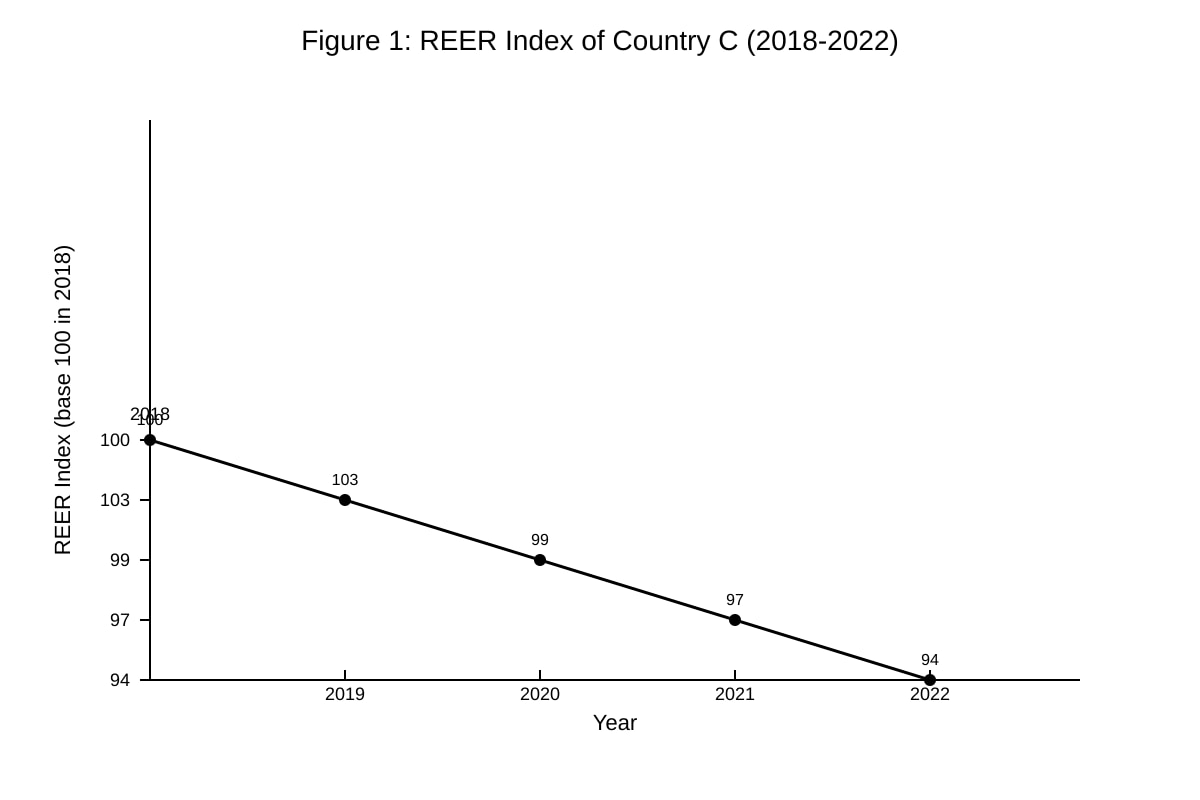
REER was 100 in 2018, rose to 103 in 2019, then fell each year to 94 by 2022. Overall, after a slight initial appreciation, the currency lost competitiveness (depreciation in real terms).
Marking: 1 mark for trend (rise then fall / net fall); 1 mark for referencing values/years.
Q5. [1 mark]
Any one: low savings rate, high import propensity, lack of export competitiveness, persistent fiscal deficit.
Marking: 1 mark for valid reason.
Q6. [2 marks]
Export competitiveness means the ability of domestic producers to sell abroad, influenced by relative prices. A weaker currency lowers foreign price of exports, raising competitiveness (per extract).
Marking: 1 mark definition; 1 mark link to extract.
Q7. [3 marks]
Both D and E saw inflation rise 2020–22. D lower (0.5→2.8), E higher (2.1→4.0). E consistently above D. Reason: E may import more energy/food, exposing it to global price shocks.
Marking: 1 mark compare levels; 1 mark compare trend; 1 mark reason.
Q8. [2 marks]
Terms of trade = (export price index / import price index) × 100 = (120/100)×100 = 120.
Marking: 1 mark definition; 1 mark calculation.
Section B: Policies and Diagrams
Q9. [3 marks]
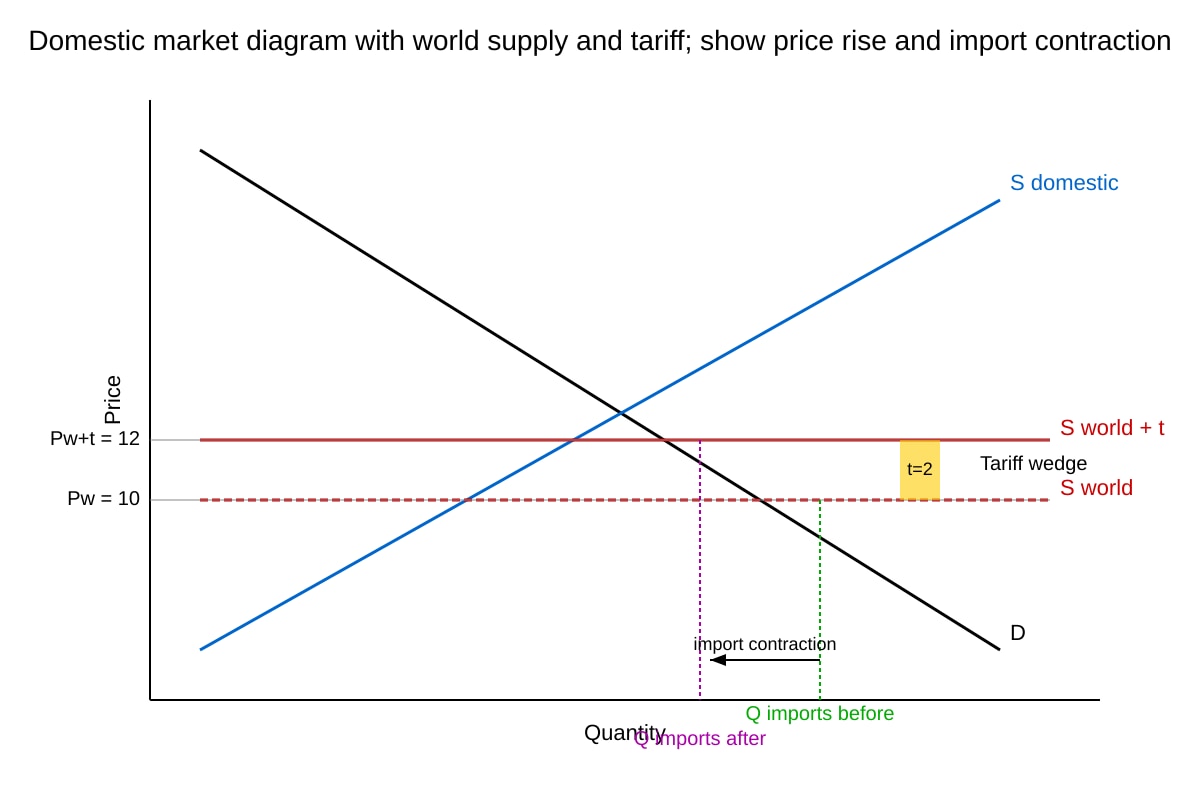
Diagram: world supply at Pw=10; tariff shifts supply to Pw+t=12; domestic price rises; import quantity falls.
Marking: 1 mark price line; 1 mark reduced imports; 1 mark tariff wedge shown.
Q10. [2 marks]
Appreciation makes exports dearer (X falls) and imports cheaper (M rises), so net exports (X–M) decrease.
Marking: 1 mark X effect; 1 mark M effect.
Q11. [3 marks]
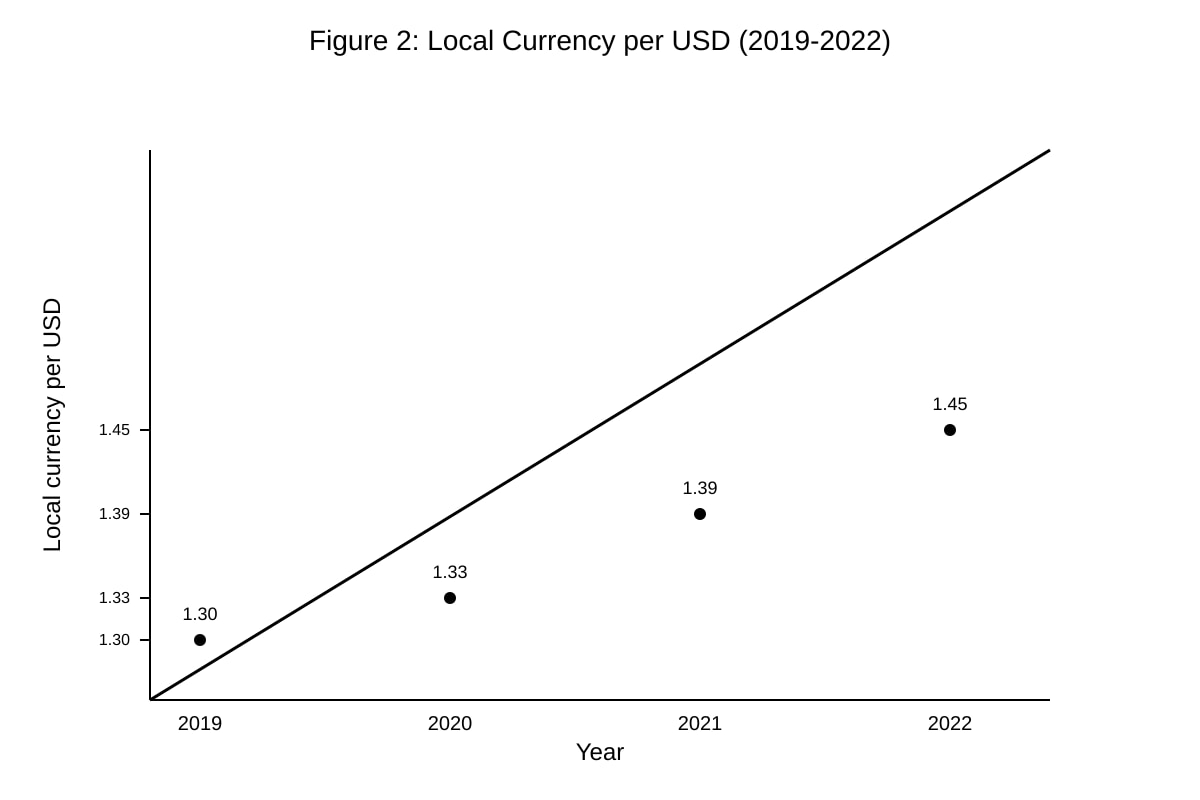
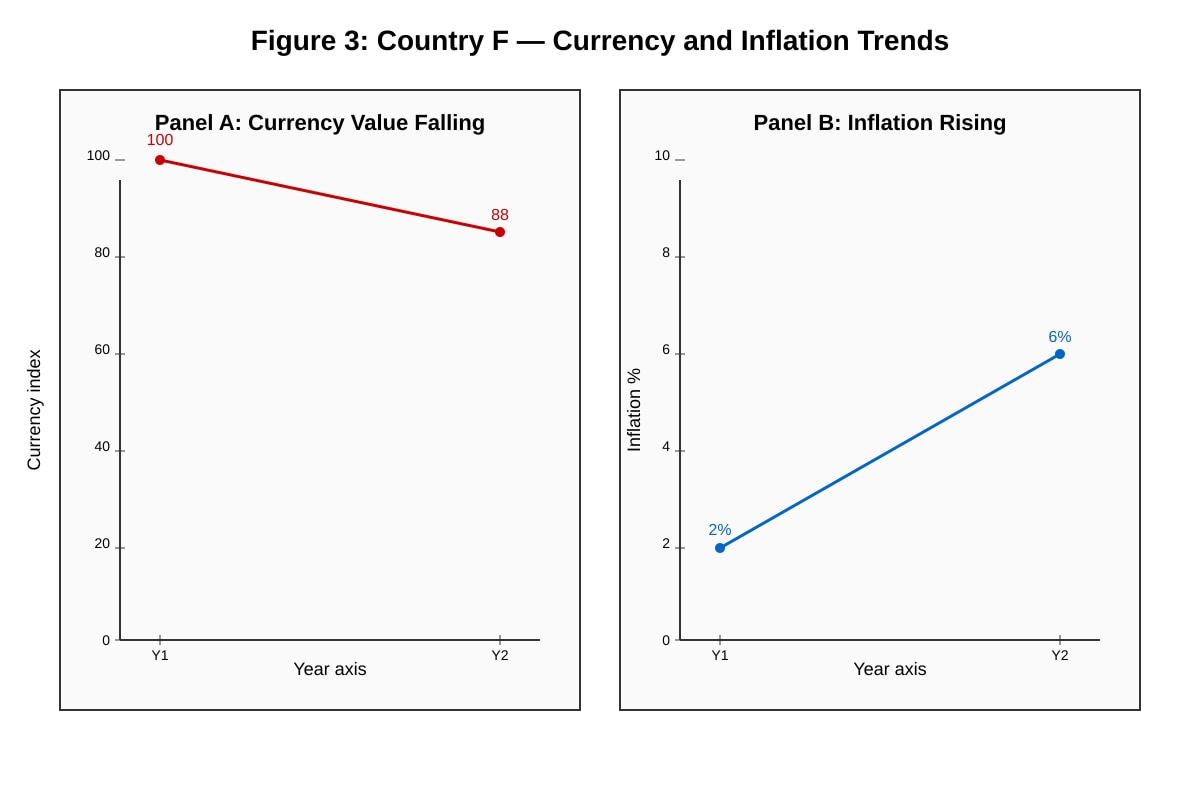
Currency depreciated (1.30→1.45). Implication 1: exports more competitive, may raise X. Implication 2: imports costlier, may raise inflation and reduce real income.
Marking: 1 mark trend; 2 marks implications (1 each).
Q12. [2 marks]
Fixed: central bank pegs value, intervenes in forex. Floating: value set by market demand/supply, no intervention.
Marking: 1 mark each.
Q13. [2 marks]
Subsidy lowers export cost, raises exports; but less domestic supply → local prices rise (extract). Unintended: food inflation, hurt poor.
Marking: 1 mark intended; 1 mark unintended.
Q14. [2 marks]
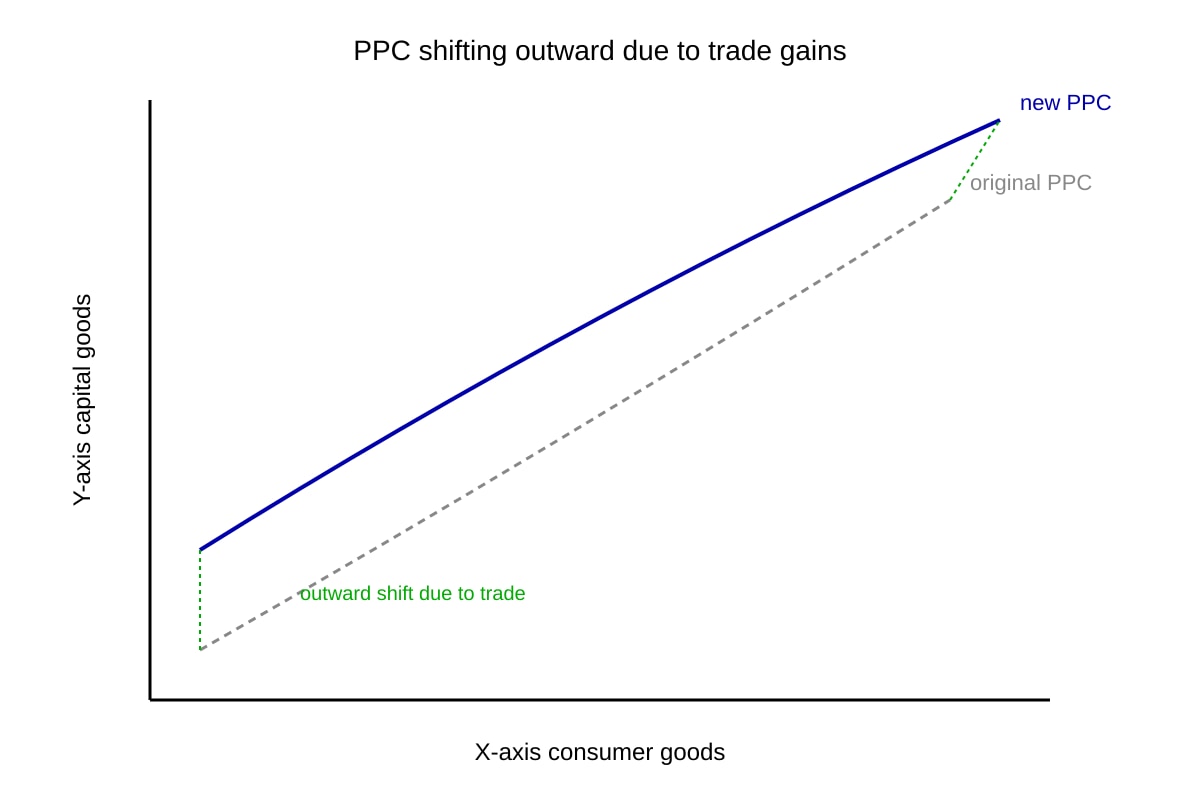
PPC shifts outward with trade (specialisation gains). Show new curve outside old.
Marking: 1 mark outward shift; 1 mark link to trade.
Section C: Evaluation and Synthesis
Q15. [4 marks]
For: protects infants, jobs. Against: higher prices, retaliation, inefficiency. Eval: net effect depends on scale and trading partners.
Marking: 2 marks for two valid points; 2 marks evaluation (trade-offs).
Q16. [4 marks]
Members grew faster post-2018 (3.0→5.2→4.0) vs non (2.8→3.1→2.9). Suggests agreement boosted growth. But other factors possible.
Marking: 2 marks data; 2 marks eval/caution.
Q17. [2 marks]
Surplus means lending abroad; capital outflow = deficit on capital account (mirror).
Marking: 1 mark link; 1 mark explanation.
Q18. [4 marks]
Tighter policy may raise rates, attract capital, support currency. But inflation already high? Actually currency falling, inflation rising – tightening could curb both. Risk: growth slowdown.
Marking: 2 marks for policy link; 2 marks eval of trade-off.
Q19. [2 marks]
Adv: market access. Disadv: structural adjustment, job losses in unprotected sectors.
Marking: 1 mark each.
Q20. [4 marks]
For: tech transfer, growth. Against: inequality, vulnerability. Eval: not always; depends on institutions.
Marking: 2 marks points; 2 marks evaluation.