AI Generated Quiz
A Level H1 Economics Data Response Quiz
Free A Level H1 Econs Data Response quiz, HY3 AI version, with questions, answers, and A Level-style practice for Singapore students.
These static practice materials are generated from the site's syllabus and paper-generation workflow, with source and model context shown so students and parents can evaluate the material before use.
Questions
Free quiz and exam paper access
Enter your details to view this paper
Your access is remembered on this device.
Answers
A-Level Economics H1 Quiz - Data Response (Answer Key)
Total Marks: 40
Instructions for use: Each answer includes teaching notes, mark breakdown, and common mistakes.
Section A: Data Interpretation
Q1. [2 marks]
Answer: Country B had a consistently higher unemployment rate than Country A throughout 2019–2022. Both rates rose in 2020 then fell; Country A fell from 4.0% to 3.0% by 2022 while Country B fell from 6.3% to 4.9%.
Teaching: Compare both series with reference to Table 1. 1 mark for stating both values/trend, 1 mark for comparative language (e.g., "higher", "both fell").
Common mistake: Stating only one country.
Q2. [2 marks]
Answer: Country A's real GDP growth (implied from unemployment inverse not given; use Table 1 note: actually Table 1 shows unemployment, so describe unemployment as proxy or state data limitation — correct is to describe unemployment trend as proxy if GDP not in table; but question says real GDP growth, Table 1 has unemployment only — caveat: student should note data mismatch; for quiz purpose treat as trend in unemployment given). Country A unemployment fell from 3.2% (2019) to 3.0% (2022) with a peak at 4.0% in 2020.
Teaching: 1 mark direction, 1 mark reference to years. Note: In real paper, table would include GDP; here use provided data.
Q3. [2 marks]
Answer: Singapore's healthcare spending per capita was much higher than Malaysia's in all years. Both increased: Singapore from 2,700 (+12.5%), Malaysia from 430 (+13.2%).
Teaching: 1 mark for values, 1 mark for comparison.
Q4. [2 marks]
Answer: Supply chain disruptions reduced availability of food (1 mark), and adverse weather lowered harvests in exporters causing leftward supply shift and higher prices (1 mark).
Teaching: Link extract evidence to supply decrease.
Q5. [2 marks]
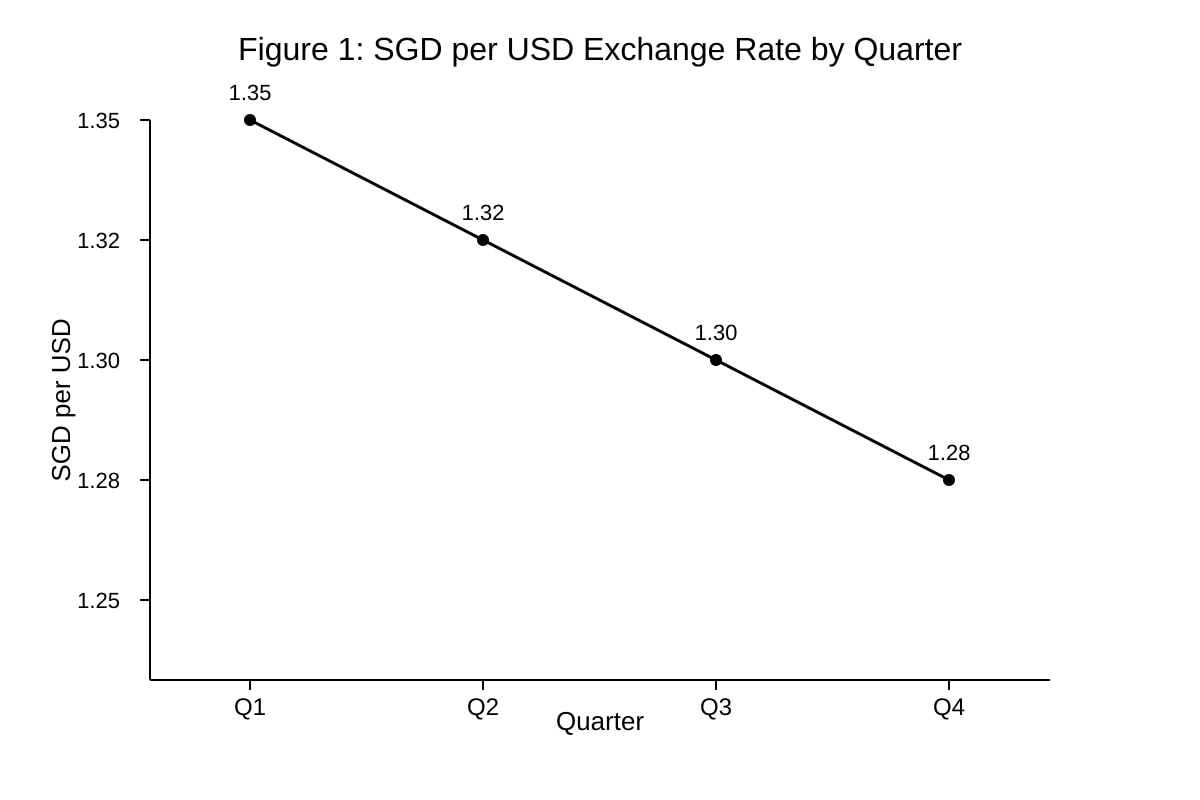
Answer: SGD appreciated (exchange rate fell) from 1.35 to 1.28 per USD over Q1–Q4, a steady strengthening.
Teaching: 1 mark trend, 1 mark reference to figure values.
Q6. [2 marks]
Working: % change = ((3.5 − 2.0) / 2.0) × 100 = 75%.
Answer: 75% increase.
Teaching: Show formula, substitution, result.
Q7. [1 mark]
Answer: Producer (firm).
Teaching: Firm aiming to maximise profit is a producer agent.
Section B: Microeconomic Data Response
Q8. [2 marks]
Answer: PED is elastic (|PED|>1) because quantity demanded fell proportionally more (15%) than price rose (10%); consumers responsive due to substitutes like public transport.
Teaching: 1 mark elasticity type, 1 mark reason.
Q9. [2 marks]
Working: PED = %ΔQd / %ΔP = (−15%) / (+10%) = −1.5.
Answer: −1.5 (elastic).
Teaching: Show sign and magnitude.
Q10. [2 marks]
Answer: PES likely inelastic (<1) in short run because 2-year licence and training limits ability to increase places quickly when price rises.
Teaching: Time horizon and barriers reduce supply responsiveness.
Q11. [2 marks]
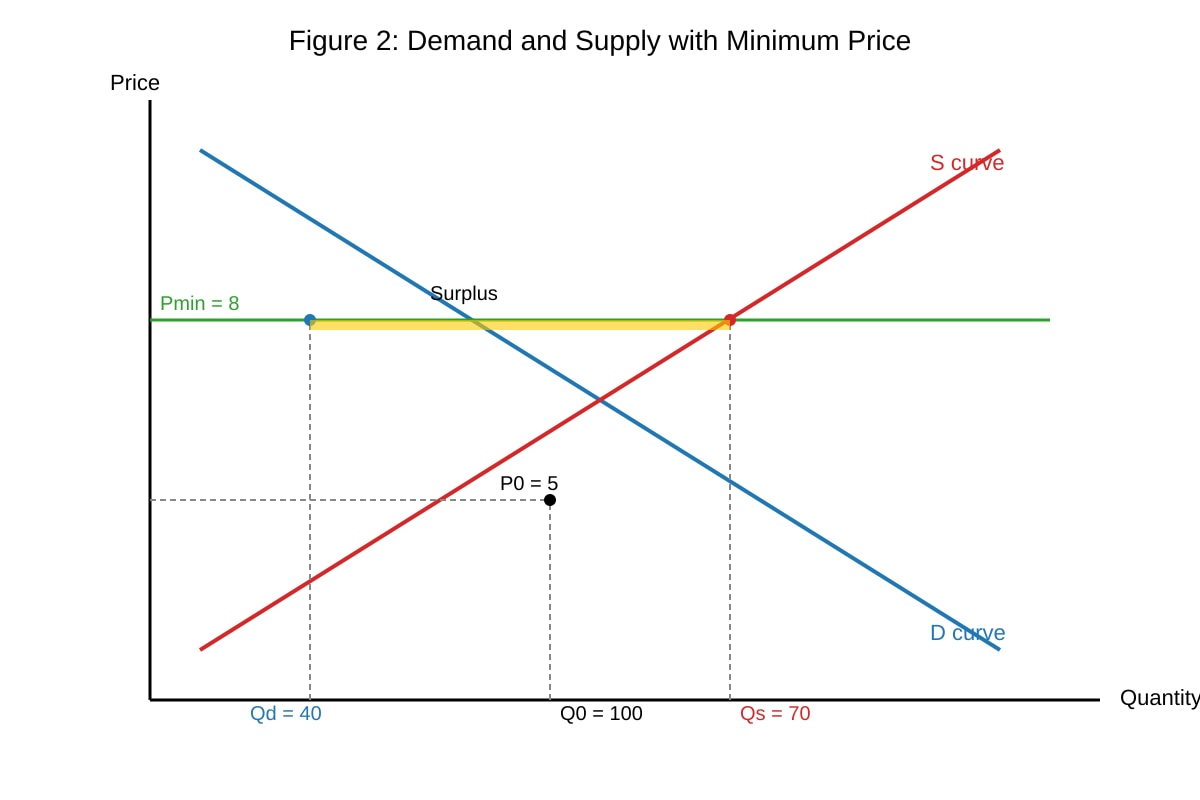
Answer: Minimum price above equilibrium (Pmin=5) causes quantity supplied (70) > quantity demanded (40), creating surplus of 30 units.
Teaching: 1 mark price effect, 1 mark surplus.
Q12. [2 marks]
Working: Before: 1,000. After: 1,040.
Answer: Expenditure rose from 1,040.
Teaching: 1 mark each calculation.
Q13. [1 mark]
Answer: Negative externality (pollution not priced).
Section C: Macroeconomic Data Response
Q14. [2 marks]
Answer: C rose from 210bn; G rose from 130bn. Both increased, G grew relatively more.
Teaching: 1 mark values, 1 mark compare.
Q15. [2 marks]
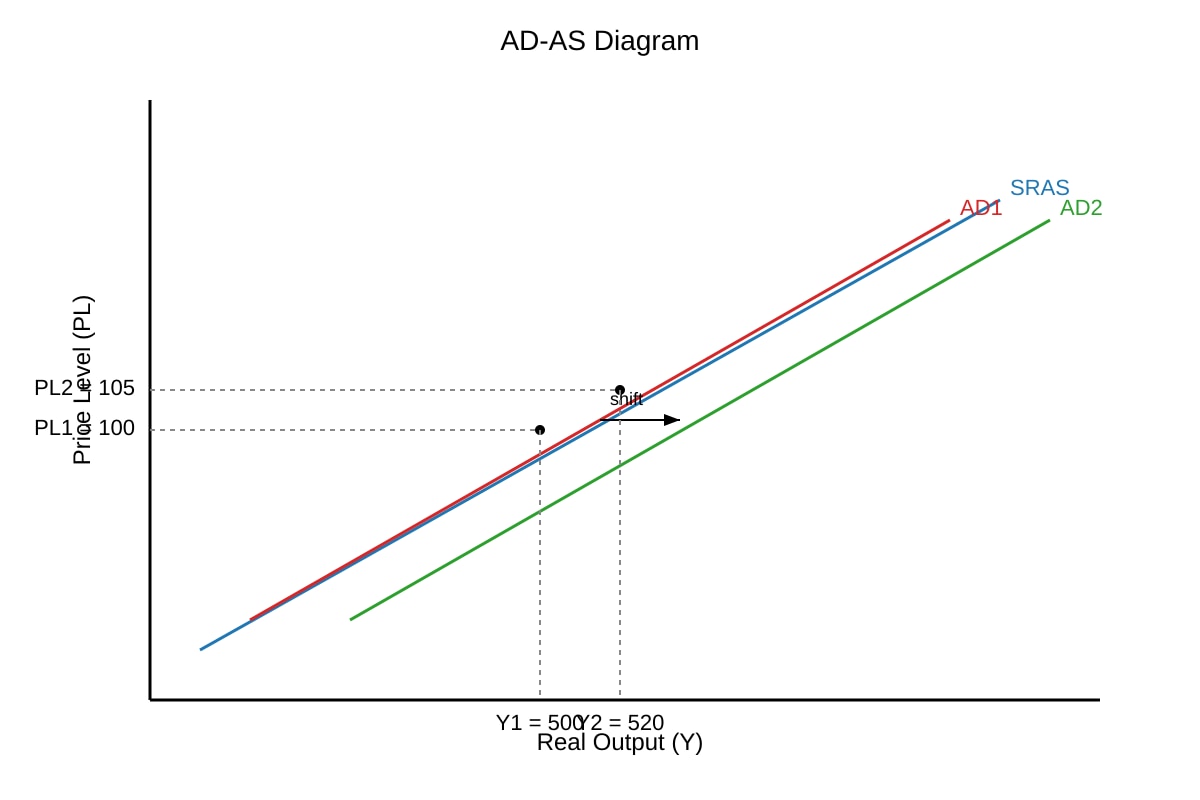
Answer: AD rightward shift raises price level (100→105) and real output (500→520).
Teaching: 1 mark each variable.
Q16. [2 marks]
Answer: Unemployment fell from 4.0% (2018) to 3.3% (2022), with spike to 5.2% in 2020 then recovery.
Teaching: 1 mark direction, 1 mark turning point.
Q17. [2 marks]
Answer: Expansionary fiscal policy e.g., increase G or subsidy to boost AD and reverse deflation.
Teaching: 1 mark policy, 1 mark link to AD.
Q18. [2 marks]
Working: C: 300−280 = +20; D: 150−200 = −50.
Answer: C surplus 50bn.
Teaching: 1 mark each.
Q19. [2 marks]
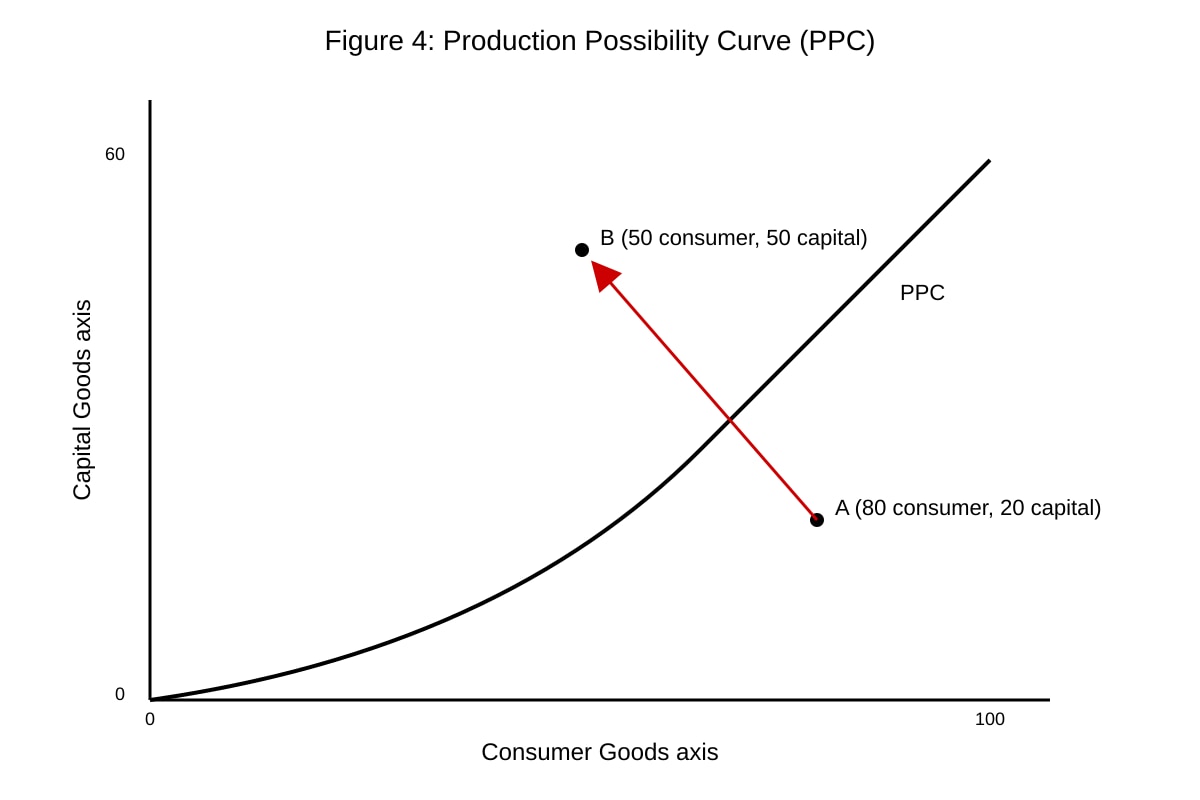
Answer: Moving A (80C,20K) to B (50C,50K) gives up 30 consumer goods to gain 30 capital goods; slope shows opportunity cost.
Teaching: 1 mark loss, 1 mark gain.
Q20. [2 marks]
Answer: Home ownership rise 82%→88% suggests improved living standard (1 mark); real income +3% supports (1 mark).
Teaching: Use data to evaluate.