From Real Exams Quiz
A Level H1 Economics Microeconomics Quiz
Free A Level H1 Econs Microeconomics quiz, LongCat Exam version, with questions, answers, and A Level-style practice for Singapore students.
These static practice materials are generated from the site's syllabus and paper-generation workflow, with source and model context shown so students and parents can evaluate the material before use.
Questions
A-Level Economics H1 Quiz - Microeconomics
Name: ______________________________
Class: ______________________________
Date: ______________________________
Score: ________ / 60
Duration: 90 minutes
Total Marks: 60
Instructions
- Answer ALL questions.
- Write your answers in the spaces provided.
- Show all working for calculation questions.
- Use economic terminology where appropriate.
- For diagram questions, draw clearly and label all axes, curves, and equilibrium points.
- Marks are indicated in brackets [ ] at the end of each question or part-question.
Section A: Multiple Choice & Short Answer (Questions 1–10)
Answer ALL questions. Each question carries 2 marks.
1. A country can produce either 80 units of consumer goods or 40 units of capital goods, or any linear combination along its production possibility curve (PPC). What is the opportunity cost of producing one additional unit of capital goods?
A. 0.5 units of consumer goods
B. 1 unit of consumer goods
C. 2 units of consumer goods
D. 40 units of consumer goods
[2]
2. The price of Good X increases from 10to12. As a result, the quantity demanded falls from 200 units to 160 units. Calculate the price elasticity of demand (PED) for Good X using the midpoint (arc elasticity) method. Show your working.
[2]
3. Distinguish between a movement along the demand curve and a shift of the demand curve. Give one example of a factor that would cause each.
[2]
4. A firm operating in a perfectly competitive market is currently producing at a price equal to its marginal cost but below its average total cost. In the short run, should the firm continue to produce or shut down? Explain your reasoning.
[2]
5. Define allocative efficiency. State the condition under which allocative efficiency is achieved in a perfectly competitive market.
[2]
6. The cross-price elasticity of demand between Good A and Good B is calculated to be +1.5. What does this tell you about the relationship between Good A and Good B? Explain briefly.
[2]
7. Explain why public goods are typically underprovided by the free market. Refer to the concepts of non-excludability and non-rivalry in your answer.
[2]
8. A government imposes a specific tax of 3perunitonagood.Theoriginalequilibriumpricewas15 and equilibrium quantity was 500 units. After the tax, the price paid by consumers rises to $17. Calculate the tax burden borne by consumers and producers respectively.
[2]
9. What is meant by asymmetric information? Give one example of a market where asymmetric information leads to market failure.
[2]
10. A monopolist faces a downward-sloping demand curve. Explain why the monopolist's marginal revenue curve lies below the demand curve.
[2]
Section B: Structured Response (Questions 11–16)
Answer ALL questions.
11. The table below shows the demand and supply schedules for electric scooters in Singapore.
| Price ($) | Quantity Demanded (thousands) | Quantity Supplied (thousands) |
|---|---|---|
| 400 | 80 | 20 |
| 500 | 70 | 35 |
| 600 | 60 | 60 |
| 700 | 50 | 85 |
| 800 | 40 | 110 |
(a) Identify the equilibrium price and equilibrium quantity. [1]
(b) Suppose the government introduces a subsidy of $100 per electric scooter to encourage green transport. Calculate the new quantity traded and the total cost of the subsidy to the government. Show your working. [3]
(c) Using a fully labelled demand and supply diagram, illustrate the effect of the subsidy on the market for electric scooters. Show the original and new equilibria, the subsidy amount, and the areas representing the cost to the government. [4]
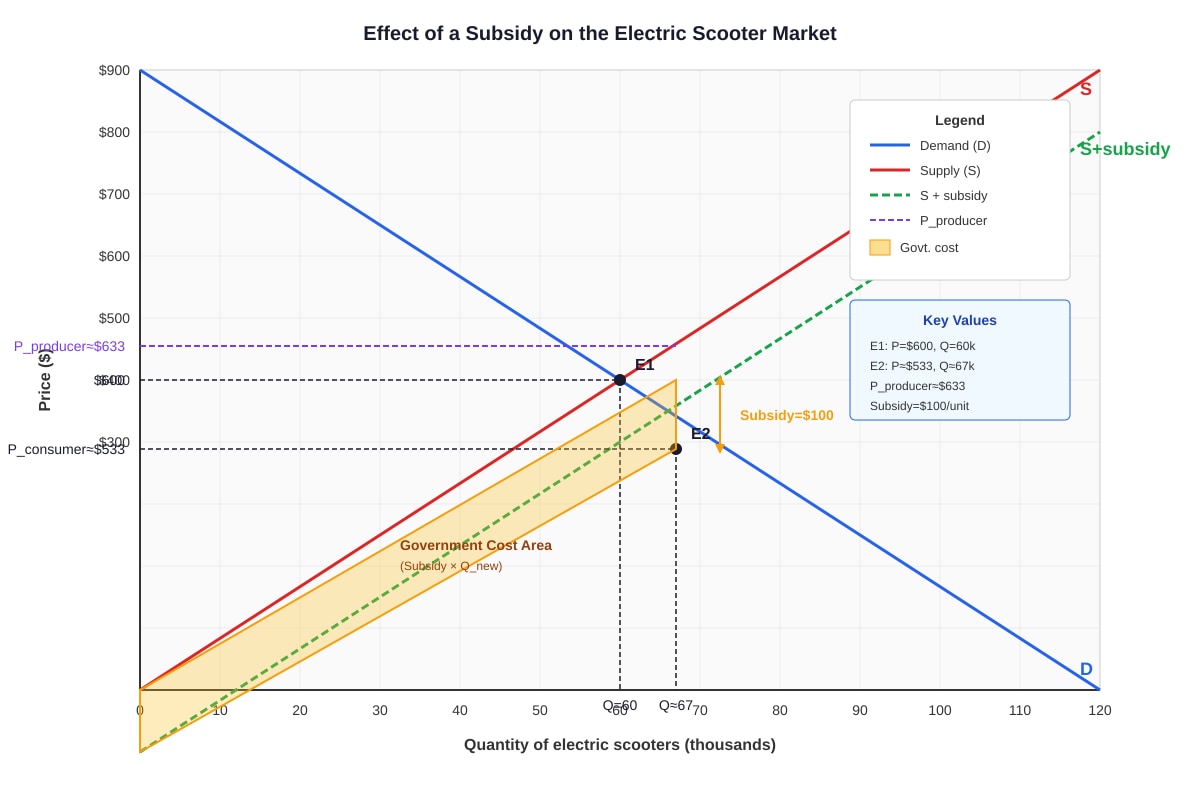
Generated image for this question.
id: Q11-fig1 type: diagram linked_question: Q11(c) description: A standard demand and supply diagram for the electric scooter market. The vertical axis is labelled "Price ()"rangingfrom300to900.Thehorizontalaxisislabelled"Quantityofelectricscooters(thousands)"rangingfrom0to120.Thedemandcurve(D)isdownwardslopingandthesupplycurve(S)isupwardsloping.TheoriginalequilibriumisatP=600, Q=60 thousand. After the subsidy, the supply curve shifts downward (or to the right) by 100ateveryquantity.ThenewsupplycurveislabelledS+subsidy.Thenewequilibriumisatalowerconsumerprice(approximately533) and higher quantity (approximately 67 thousand). The price received by producers is approximately 633.Theverticaldistancebetweenthetwosupplycurvesis100 (the subsidy per unit). The government cost of the subsidy is the rectangle bounded by the old and new supply curves between quantity 0 and the new quantity (67 thousand), with height 100.Label:D,S,S+subsidy,originalequilibriumE1,newconsumerequilibriumE2,Pconsumer,Pproducer,Qoriginal=60,Qnew≈67,subsidyperunit=100, government cost area shaded. labels: D, S, S+subsidy, E1, E2, P=600,Pconsumer≈533, P_producer≈633,Q=60,Q≈67,subsidy=100 values: Original equilibrium: P=600, Q=60. New equilibrium after 100subsidy:consumerprice≈533,producerprice≈633,quantity≈67.Governmentcost≈100 × 67,000 = $6,700,000. must_show: Both supply curves, demand curve, both equilibria, subsidy gap, government cost area clearly shaded and labelled.
[8]
12. Read the following extract and answer the questions that follow.
"In 2023, the Singapore government announced an increase in the Additional Buyer's Stamp Duty (ABSD) for residential property purchases. The ABSD for Singapore citizens buying their second residential property was raised from 17% to 20%, while the rate for foreigners remained at 60%. The government stated that the measure was intended to cool the property market and ensure housing affordability for Singaporeans. Data from the Urban Redevelopment Authority (URA) showed that private residential property prices had risen by 8.6% in 2022, while transaction volumes fell by 12% in the first quarter of 2023 compared to the same period in 2022."
(a) Using a demand and supply diagram, explain how the increase in ABSD is expected to affect the equilibrium price and quantity in the Singapore private residential property market. [4]
(b) The PED for private residential property in Singapore is estimated to be −0.4. Explain what this value implies about consumer responsiveness to price changes, and discuss one reason why demand for housing may be price inelastic. [3]
(c) Evaluate whether the increase in ABSD is likely to be effective in achieving housing affordability for Singaporeans. Consider at least one limitation of the policy. [4]
[11]
13. (a) Explain the difference between a positive externality and a negative externality. Give one example of each. [3]
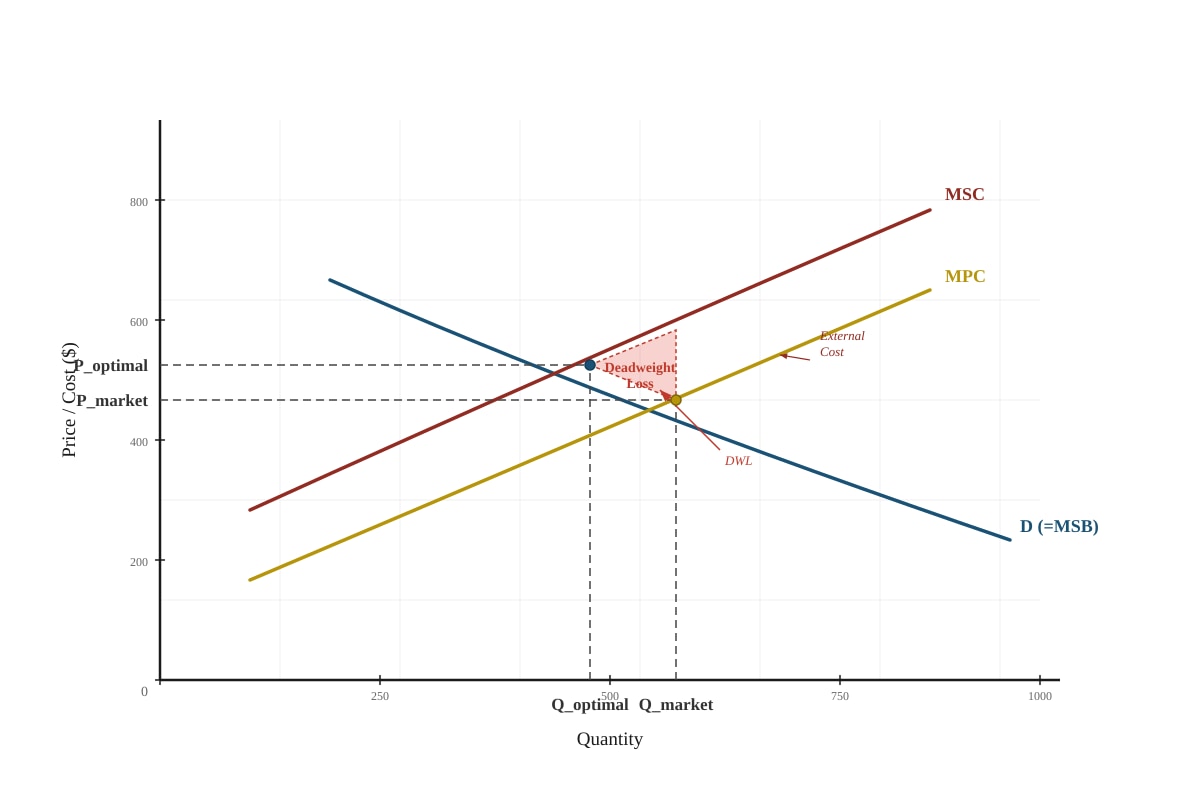
(b) Using a diagram, show how a negative externality of production leads to overproduction relative to the socially optimal level. Clearly label the marginal private cost (MPC), marginal social cost (MSC), and the deadweight loss. [4]
Generated image for this question.
id: Q13-fig1 type: diagram linked_question: Q13(b) description: A diagram showing a negative externality of production. The vertical axis is labelled "Price/Cost ($)" and the horizontal axis is labelled "Quantity". The demand curve (D) represents marginal social benefit (MSB) and is downward sloping. The marginal private cost curve (MPC) is upward sloping. The marginal social cost curve (MSC) lies above the MPC curve, parallel or diverging, reflecting the external cost. The market equilibrium is at the intersection of D and MPC, giving quantity Q_market and price P_market. The socially optimal equilibrium is at the intersection of D and MSC, giving quantity Q_optimal (to the left of Q_market) and price P_optimal (above P_market). The deadweight loss is the triangular area between MSC and D, from Q_optimal to Q_market. Label: D (=MSB), MPC, MSC, Q_market, Q_optimal, P_market, P_optimal, deadweight loss triangle shaded. labels: D (MSB), MPC, MSC, Q_market, Q_optimal, P_market, P_optimal, deadweight loss values: Q_market > Q_optimal. P_optimal > P_market. Deadweight loss = area of triangle between MSC and D from Q_optimal to Q_market. must_show: All three curves (D/MSB, MPC, MSC), both equilibria, deadweight loss triangle clearly shaded and labelled, axes labelled.
[7]
14. A firm in a perfectly competitive industry has the following cost structure at its current level of output:
- Total Revenue: $10,000
- Total Variable Cost: $8,000
- Total Fixed Cost: $3,000
(a) Calculate the firm's profit or loss. Show your working. [2]
(b) Should the firm continue to operate in the short run? Explain your answer with reference to the shutdown condition. [3]
(c) Explain what will happen to the number of firms in this industry in the long run. Illustrate your answer with a diagram. [4]
[9]
15. (a) Define price discrimination. State three conditions necessary for a firm to successfully practise price discrimination. [4]
(b) Explain how third-degree price discrimination can increase a firm's total revenue. Use a diagram to support your answer. [4]
[8]
16. The following data relates to the market for ride-hailing services in Singapore.
| Month | Average Fare ($/trip) | Number of Trips (millions) | Average Income of Consumers ($/month) |
|---|---|---|---|
| Jan | 12.00 | 8.5 | 5,200 |
| Feb | 11.00 | 9.2 | 5,200 |
| Mar | 11.00 | 9.5 | 5,400 |
(a) Using the data from January to February, calculate the PED for ride-hailing trips. Use the midpoint method. Comment on the value. [3]
(b) Using the data from February to March, calculate the YED for ride-hailing trips. Use the midpoint method. Comment on what this suggests about ride-hailing services. [3]
(c) Explain two determinants of PED that might affect the price elasticity of demand for ride-hailing services. [3]
[9]
Section C: Essay / Extended Response (Questions 17–20)
Answer ALL questions. Plan your answers before writing.
17. "Government intervention in markets always leads to a more efficient allocation of resources than the free market."
Evaluate this statement with reference to a specific example of government intervention in Singapore. In your answer, consider both the potential benefits and limitations of the intervention. [10]
18. A pharmaceutical company holds a patent on a life-saving drug, giving it monopoly power in the market.
(a) Using a diagram, explain how a profit-maximising monopolist determines its price and output. Compare this outcome with that of a perfectly competitive market. [6]
(b) Discuss whether the government should regulate the price of this drug. Consider the interests of consumers, the pharmaceutical firm, and society as a whole. [6]
[12]
19. Singapore's Certificate of Entitlement (COE) system limits the number of new vehicles that can be registered each year. The COE is obtained through a bidding process.
(a) Explain how the COE system affects the market for cars in Singapore. Use a diagram to illustrate your answer. [5]
(b) Evaluate the effectiveness of the COE system as a policy to manage traffic congestion in Singapore. Consider at least one alternative policy. [7]
[12]
20. "The market mechanism is the most efficient way to allocate scarce resources in an economy."
To what extent do you agree with this statement? In your answer, consider the role of market failure and the case for government intervention. Use examples to support your argument. [10]
Answers
A-Level Economics H1 Quiz - Microeconomics
Answer Key
Section A: Multiple Choice & Short Answer (Questions 1–10)
1. Answer: C
Explanation: The PPC shows the trade-off between consumer goods and capital goods. Moving from 0 capital goods to 40 capital goods requires giving up 80 consumer goods. Therefore, the opportunity cost of 1 unit of capital goods = 80 ÷ 40 = 2 units of consumer goods. This reflects the concept of opportunity cost — the next best alternative forgone when making a choice. The slope of the PPC represents this trade-off.
[2 marks]
2. Answer: PED = −1.22 (or approximately −1.2)
Working (Midpoint/Arc Elasticity Method):
PED=%ΔP%ΔQd
%ΔQd=(Q2+Q1)/2Q2−Q1×100=(160+200)/2160−200×100=180−40×100=−22.22%
%ΔP=(P2+P1)/2P2−P1×100=(12+10)/212−10×100=112×100=18.18%
PED=18.18%−22.22%=−1.22
Comment: Since |PED| > 1, demand is price elastic — consumers are relatively responsive to the price change. The midpoint method is used because it gives a consistent elasticity value regardless of the direction of change, avoiding the asymmetry problem of the simple percentage method.
[2 marks] — 1 mark for correct formula/method, 1 mark for correct answer.
3. Answer:
A movement along the demand curve (also called a change in quantity demanded) occurs when the price of the good itself changes, causing movement from one point to another on the same demand curve. Example: A fall in the price of smartphones leads to an increase in quantity demanded — a movement down along the demand curve.
A shift of the demand curve (also called a change in demand) occurs when a non-price determinant of demand changes, causing the entire curve to shift left (decrease) or right (increase). Example: An increase in consumer income leads to higher demand for restaurant meals at every price — the demand curve shifts rightward.
Key distinction: Only a change in the good's own price causes movement along the curve. All other factors (income, tastes, prices of related goods, expectations, number of buyers) cause shifts.
[2 marks] — 1 mark for correct distinction, 1 mark for valid example of each.
4. Answer: The firm should continue to produce in the short run.
Explanation: In the short run, a firm should continue to produce as long as price (P) is greater than or equal to average variable cost (AVC) — the shutdown condition. The question states that P = MC and P < ATC. This means the firm is making a loss (since P < ATC), but we need to check whether P > AVC.
Since the firm is in perfect competition and producing where P = MC, and the MC curve cuts the AVC curve at its minimum, if the firm is producing at a point where P = MC and P < ATC, it is possible that P > AVC (the loss is less than total fixed cost). As long as the firm can cover its variable costs, it should continue operating in the short run because it can contribute toward covering some of its fixed costs. Shutting down would mean losing the entire fixed cost.
Common mistake: Students often confuse the shutdown condition (P < AVC) with the loss condition (P < ATC). A firm can make a loss but still continue operating if it covers its variable costs.
[2 marks] — 1 mark for correct decision, 1 mark for correct explanation referencing the shutdown condition.
5. Answer:
Allocative efficiency occurs when resources are allocated in a way that maximises society's welfare — that is, the goods and services produced are those most desired by consumers. It is achieved when the value consumers place on a good (reflected by the price they are willing to pay, i.e., marginal benefit) equals the cost of producing the last unit (marginal cost).
Condition: Allocative efficiency is achieved where P = MC (price equals marginal cost). In a perfectly competitive market, firms produce where P = MC in equilibrium, so the market achieves allocative efficiency. This is because the demand curve represents marginal social benefit (MSB) and the supply curve represents marginal social cost (MSC) in the absence of externalities, so the equilibrium where D = S ensures MSB = MSC.
[2 marks] — 1 mark for definition, 1 mark for condition (P = MC).
6. Answer:
A cross-price elasticity of demand (XED) of +1.5 indicates that Good A and Good B are substitutes. The positive sign means that as the price of one good rises, the demand for the other good increases (they move in the same direction). The magnitude of 1.5 indicates that they are relatively strong substitutes — a 1% increase in the price of Good B leads to a 1.5% increase in the demand for Good A.
Example: If Good A is bus travel and Good B is taxi rides, a rise in taxi fares would cause a more than proportional increase in bus travel demand, suggesting they are close substitutes.
Key concept: XED > 0 → substitutes; XED < 0 → complements; XED = 0 → unrelated goods.
[2 marks] — 1 mark for identifying substitutes, 1 mark for explanation of the +1.5 value.
7. Answer:
Public goods are underprovided by the free market due to the free-rider problem, which arises from two key characteristics:
-
Non-excludability: Once the good is provided, it is impossible (or very costly) to prevent anyone from consuming it, even if they have not paid for it. Example: National defence — everyone benefits regardless of whether they contribute financially.
-
Non-rivalry: One person's consumption of the good does not reduce the amount available for others. Example: A street light — one person using it does not diminish its availability to others.
Because of non-excludability, individuals have an incentive to free ride — enjoying the benefits without paying. Since no one can be excluded, private firms cannot charge a price and therefore have no profit incentive to provide the good. The market fails because the good will be underprovided (or not provided at all) despite being socially desirable. Government provision, funded through taxation, is typically required.
[2 marks] — 1 mark for explaining the free-rider problem, 1 mark for linking to non-excludability and non-rivalry.
8. Answer:
- Total tax per unit = $3
- Price paid by consumers rises from 15to17 → Consumer burden = $2 per unit
- Therefore, Producer burden = 3−2 = $1 per unit
Explanation: When a specific tax is imposed, the tax burden is shared between consumers and producers depending on the relative elasticities of demand and supply. The more inelastic side of the market bears a greater share of the tax. In this case, consumers bear 2ofthe3 tax (2/3 of the burden) and producers bear $1 (1/3 of the burden), suggesting that demand is relatively more inelastic than supply.
[2 marks] — 1 mark for consumer burden (2),1markforproducerburden(1).
9. Answer:
Asymmetric information occurs when one party in a market transaction has more or better information than the other party, leading to an imbalance in the transaction. This can result in market failure because the party with less information makes suboptimal decisions.
Example: In the market for used cars (the "lemons" problem, Akerlof, 1970), sellers know more about the quality of the car than buyers. Buyers, unable to distinguish between high-quality and low-quality cars, are only willing to pay an average price. This drives high-quality sellers out of the market, leaving mostly low-quality cars — a situation known as adverse selection. The market fails to allocate resources efficiently.
Other valid examples: Insurance markets (moral hazard), financial markets, healthcare.
[2 marks] — 1 mark for definition, 1 mark for valid example with brief explanation.
10. Answer:
A monopolist faces the entire market demand curve, which is downward sloping. To sell an additional unit, the monopolist must lower the price not just on the marginal unit but on all previous units as well. This means that the additional revenue gained from selling one more unit (marginal revenue) is less than the price of that unit, because the price reduction on all previous units reduces total revenue.
Example: If a monopolist sells 10 units at 10each(TR=100) and must lower the price to 9tosellthe11thunit,thetotalrevenuebecomes99 (11 × 9).Themarginalrevenueofthe11thunitis99 − 100=−1, which is less than the price of $9.
Mathematically, if the demand curve is linear (P = a − bQ), then MR = a − 2bQ, which has twice the slope and lies below the demand curve.
[2 marks] — 1 mark for explanation, 1 mark for clear reasoning (numerical example or mathematical explanation).
Section B: Structured Response (Questions 11–16)
11.
(a) Answer: Equilibrium price = $600, Equilibrium quantity = 60,000 units.
This is where quantity demanded equals quantity supplied (both 60,000).
[1 mark]
(b) Working:
A subsidy of 100peruniteffectivelyreducesthecostofproduction,shiftingthesupplycurvetotheright(ordownward)by100 at every quantity. The new supply schedule (price received by producers = consumer price + $100):
At the new equilibrium, the price consumers pay is lower. We need to find where the quantity demanded at a given consumer price equals the quantity supplied at (consumer price + $100).
Testing values:
- If consumer price = 500:Qd=70,Qsat600 = 60 → Qd > Qs (shortage)
- If consumer price = 533(approx):Qd≈67,Qsat633 ≈ 67 → equilibrium
More precisely, using linear interpolation:
- New quantity traded ≈ 66,667 units (or approximately 67,000)
Total cost of subsidy to government = subsidy per unit × new quantity = 100×66,667=∗∗6,666,700** (or approximately $6.67 million)
[3 marks] — 1 mark for correct method, 1 mark for correct new quantity, 1 mark for correct total subsidy cost.
(c) Diagram:
<image_placeholder> id: Q11-fig1-answer type: diagram linked_question: Q11(c) description: Refer to Q11-fig1 for the required diagram. The diagram should show: D curve downward sloping, S curve upward sloping, S+subsidy curve shifted right/down by 100.OriginalequilibriumE1atP=600, Q=60. New equilibrium E2 at consumer price≈533,Q≈67.Pricereceivedbyproducers≈633. Government cost = rectangle with height 100andwidth≈67,area=6.7 million. labels: D, S, S+subsidy, E1, E2, P_consumer, P_producer, Q_original, Q_new, subsidy, government cost values: E1: P=600, Q=60. E2: P_consumer≈533, P_producer≈633, Q≈67. Government cost ≈ $6.7m. must_show: All curves labelled, both equilibria marked, subsidy gap shown, government cost area shaded.
Marking guide:
- Correctly drawn and labelled D and S curves [1]
- Correct shift of supply curve (S+subsidy) [1]
- Correct original and new equilibria identified [1]
- Government cost area correctly shaded and labelled [1]
[4 marks]
12.
(a) Explanation and Diagram:
The increase in ABSD acts as an additional cost of purchasing property, which reduces demand for residential property (or increases the cost to buyers). The demand curve shifts leftward from D1 to D2. The supply curve remains unchanged (at least in the short run). The new equilibrium shows a lower equilibrium price and a lower equilibrium quantity.
<image_placeholder> id: Q12-fig1 type: diagram linked_question: Q12(a) description: A demand and supply diagram for the Singapore private residential property market. Vertical axis: "Price of property ($)". Horizontal axis: "Quantity of properties". D1 is the original downward-sloping demand curve. D2 is the new demand curve, shifted left from D1. S is the upward-sloping supply curve. E1 is the original equilibrium at higher price P1 and quantity Q1. E2 is the new equilibrium at lower price P2 and lower quantity Q2. The leftward shift of demand is labelled "Increase in ABSD". labels: D1, D2, S, E1, E2, P1, P2, Q1, Q2, "Increase in ABSD" values: P2 < P1, Q2 < Q1. The shift represents a decrease in demand due to the tax. must_show: Both demand curves, supply curve, both equilibria, direction of shift clearly shown and labelled.
[4 marks] — 1 mark for correct shift direction, 1 mark for correct new equilibrium, 1 mark for explanation, 1 mark for correctly labelled diagram.
(b) Answer:
A PED of −0.4 means that demand is price inelastic (|PED| < 1). A 1% increase in price leads to only a 0.4% decrease in quantity demanded. Consumers are relatively unresponsive to price changes.
Reason for inelastic demand for housing:
- Housing is a necessity — people need shelter regardless of price changes, so demand does not fall significantly when prices rise.
- Other valid reasons: Lack of close substitutes, housing represents a large proportion of income (though this could also make it elastic in some contexts), time period (short-run demand is more inelastic), speculative demand (buyers expect prices to rise further).
[3 marks] — 1 mark for identifying inelastic, 1 mark for correct interpretation of −0.4, 1 mark for valid reason.
(c) Evaluation:
Arguments that ABSD is effective:
- It directly increases the cost of purchasing additional properties, discouraging speculative and investment demand.
- The data shows transaction volumes fell by 12% in Q1 2023, suggesting the policy is having an impact on demand.
- By targeting second-property buyers and foreigners more heavily, it prioritises owner-occupiers.
Limitations:
- PED is inelastic (−0.4), meaning that even significant price increases (via the tax) lead to relatively small reductions in quantity demanded. The policy may not significantly reduce demand.
- The policy may reduce supply if developers respond to lower demand by building fewer units, potentially worsening affordability in the long run.
- It does not address the root causes of rising property prices, such as land scarcity, population growth, or low interest rates.
- The tax may be regressive for genuine upgraders (e.g., families needing a larger home).
- Alternative policies such as increasing housing supply (more HDB flats, releasing more land) or rental market interventions might be more effective at improving affordability.
Conclusion: The ABSD may have a limited effect on affordability given the inelastic demand for housing. It is more effective as a demand-management tool to curb speculation rather than a solution to housing affordability. A combination of demand-side and supply-side policies is likely needed.
[4 marks] — 2 marks for analysis of effectiveness, 2 marks for evaluation of limitations (at least one well-developed limitation).
13.
(a) Answer:
A positive externality occurs when the production or consumption of a good confers benefits on third parties who are not involved in the market transaction. The marginal social benefit (MSB) exceeds the marginal private benefit (MPB). Example: Education — society benefits from a more educated workforce (higher productivity, lower crime) beyond the private benefits to the individual.
A negative externality occurs when the production or consumption of a good imposes costs on third parties. The marginal social cost (MSC) exceeds the marginal private cost (MPC). Example: Air pollution from factories — society bears health and environmental costs not reflected in the market price.
[3 marks] — 1 mark for definition of positive externality + example, 1 mark for definition of negative externality + example, 1 mark for clear distinction.
(b) Diagram:
<image_placeholder> id: Q13-fig1-answer type: diagram linked_question: Q13(b) description: Refer to Q13-fig1. The diagram shows MPC (lower upward-sloping curve), MSC (upper upward-sloping curve above MPC), and D=MSB (downward-sloping curve). Market equilibrium at intersection of D and MPC gives Q_market. Socially optimal at intersection of D and MSC gives Q_optimal (to the left). Deadweight loss is the triangle between MSC and D from Q_optimal to Q_market. labels: D (MSB), MPC, MSC, Q_market, Q_optimal, P_market, P_optimal, deadweight loss values: Q_market > Q_optimal. Deadweight loss = area of triangle between MSC and D, from Q_optimal to Q_market. must_show: All three curves, both equilibria, deadweight loss triangle shaded.
Explanation: Because the firm only considers its private costs (MPC) and ignores the external costs imposed on society, it produces at Q_market where MPC = D. The socially optimal output is at Q_optimal where MSC = D. The difference (Q_market − Q_optimal) represents overproduction. The deadweight loss triangle represents the welfare loss to society from this overproduction — the external costs of the additional units exceed the benefits.
[4 marks] — 1 mark for correct curves (MPC, MSC, D), 1 mark for correct market equilibrium, 1 mark for correct social optimum, 1 mark for deadweight loss correctly identified and shaded.
14.
(a) Working:
Profit/Loss=Total Revenue−Total Cost =TR−(TVC+TFC) =$10,000−($8,000+$3,000) =$10,000−$11,000 =−$1,000
The firm is making a loss of $1,000.
[2 marks] — 1 mark for correct formula, 1 mark for correct answer.
(b) Answer: The firm should continue to operate in the short run.
Explanation: The shutdown condition states that a firm should shut down if P < AVC (or equivalently, if TR < TVC). Here:
- TR = $10,000
- TVC = $8,000
- Since TR (10,000)>TVC(8,000), the firm is covering all its variable costs and has $2,000 left over to contribute toward fixed costs.
If the firm shuts down, it would lose its entire fixed cost of 3,000.Bycontinuingtooperate,itlosesonly1,000 (compared to $3,000 if shut down). Therefore, it is rational to continue operating in the short run.
[3 marks] — 1 mark for correct decision, 1 mark for referencing shutdown condition (TR vs TVC or P vs AVC), 1 mark for clear explanation.
(c) Answer:
In the long run, firms in a perfectly competitive industry making losses will exit the industry. As firms exit, the market supply curve shifts leftward, causing the market price to rise. This process continues until the price rises to the minimum of the average total cost curve, at which point remaining firms earn normal profit (zero economic profit) and there is no further incentive to exit.
Diagram: A long-run adjustment diagram showing the market (left panel) and a representative firm (right panel). The market supply curve shifts left (S1 to S2), raising the market price from P1 to P2. On the firm diagram, P2 is tangent to the minimum of the ATC curve, showing zero economic profit in the long-run equilibrium.
[4 marks] — 1 mark for explaining firm exit, 1 mark for explaining supply shift and price rise, 1 mark for explaining long-run equilibrium (normal profit), 1 mark for correct diagram.
15.
(a) Answer:
Price discrimination is the practice of charging different prices to different consumers for the same good or service, where the price difference is not due to differences in cost of production.
Three conditions necessary:
- Market power: The firm must have some degree of monopoly power (face a downward-sloping demand curve) to set prices rather than being a price taker.
- Different price elasticities of demand: Different consumer groups must have different PEDs, so the firm can charge higher prices to consumers with more inelastic demand.
- Ability to prevent resale (separation of markets): Consumers who buy at the lower price must not be able to resell the good to consumers in the higher-price market (no arbitrage).
[4 marks] — 1 mark for definition, 1 mark each for three conditions.
(b) Explanation:
Third-degree price discrimination involves dividing consumers into separate markets (e.g., students vs. adults, peak vs. off-peak) and charging different prices in each market. The firm sets output in each market where MR = MC. The market with more inelastic demand is charged a higher price, and the market with more elastic demand is charged a lower price.
By price discriminating, the firm captures more consumer surplus and converts it into additional revenue compared to charging a single uniform price. This is because the firm can extract more willingness-to-pay from consumers who are less price-sensitive while still serving price-sensitive consumers at a lower price.
Diagram: Two side-by-side diagrams showing Market A (inelastic demand, higher price P_A) and Market B (elastic demand, lower price P_B). In each market, MR = MC determines the quantity, and the price is found on the demand curve above that quantity.
[4 marks] — 2 marks for explanation of how price discrimination increases revenue, 2 marks for correct diagram.
16.
(a) Working (Jan to Feb):
%ΔQd=(9.2+8.5)/29.2−8.5×100=8.850.7×100=7.91%
%ΔP=(11.00+12.00)/211.00−12.00×100=11.50−1.00×100=−8.70%
PED=−8.70%7.91%=−0.91
Comment: The PED is approximately −0.91, which means demand is price inelastic (|PED| < 1). A 1% decrease in fare leads to a 0.91% increase in trips. Consumers are relatively unresponsive to fare changes, possibly because ride-hailing is a convenient mode of transport with limited short-term alternatives for many trips.
[3 marks] — 1 mark for correct method, 1 mark for correct answer, 1 mark for comment.
(b) Working (Feb to Mar):
Price is constant ($11.00), so the change in demand is due to the change in income.
%ΔQd=(9.5+9.2)/29.5−9.2×100=9.350.3×100=3.21%
%ΔY=(5400+5200)/25400−5200×100=5300200×100=3.77%
YED=3.77%3.21%=+0.85
Comment: The YED is +0.85, which is positive and less than 1. This indicates that ride-hiking is a normal good (demand increases with income) and is income inelastic — demand rises proportionally less than income. This suggests ride-hailing is somewhat of a necessity rather than a luxury for Singapore consumers.
[3 marks] — 1 mark for correct method, 1 mark for correct answer, 1 mark for comment.
(c) Two determinants of PED:
-
Availability of substitutes: If there are many close substitutes (e.g., public transport, taxis, private cars), demand for ride-hailing will be more price elastic because consumers can easily switch. In Singapore, the availability of MRT and buses may make demand relatively elastic for some trips.
-
Proportion of income: If ride-hailing fares represent a large proportion of a consumer's income, demand will tend to be more price elastic. For lower-income consumers, ride-hailing may be more elastic as they are more price-sensitive.
Other valid determinants: Time period (demand becomes more elastic over time as consumers adjust), necessity vs. luxury, habit/addiction, definition of the market (broader categories tend to be more inelastic).
[3 marks] — 1 mark each for two valid determinants with explanation.
Section C: Essay / Extended Response (Questions 17–20)
17. Marking Scheme:
"Government intervention in markets always leads to a more efficient allocation of resources than the free market." Evaluate with reference to Singapore.
Knowledge and Understanding (AO1) — up to 3 marks:
- Clear understanding of government intervention (e.g., taxes, subsidies, regulation, price controls, direct provision)
- Understanding of allocative efficiency (P = MC, MSB = MSC)
- Relevant Singapore example (e.g., COE system, ABSD, GST, public housing, carbon tax)
Analysis (AO2) — up to 4 marks:
- Explanation of how government intervention can correct market failure and improve efficiency
- E.g., taxing negative externalities (carbon tax) to internalise external costs
- E.g., subsidising merit goods (education subsidies) to increase consumption to socially optimal level
- Explanation of how government intervention can lead to government failure and reduce efficiency
- E.g., deadweight loss from taxation, misallocation of resources, unintended consequences
- E.g., information problems — government may not know the optimal level of intervention
- E.g., regulatory capture, bureaucracy, time lags
Evaluation (AO3) — up to 3 marks:
- Judgement on whether intervention "always" leads to more efficient allocation — the word "always" is absolute and likely too strong
- Consideration of the type of intervention, the specific market context, and the magnitude of market failure
- Recognition that the effectiveness depends on the government's ability to accurately identify and measure the externality/market failure
- Conclusion: Government intervention can improve efficiency when market failure is significant and the intervention is well-designed, but it is not "always" more efficient. Government failure can sometimes make outcomes worse than the free market.
Indicative content for Singapore example (Carbon Tax):
- Singapore introduced a carbon tax in 2019 at 5pertonneofCO2equivalent,raisedto25 in 2024
- This internalises the negative externality of carbon emissions, encouraging firms to reduce pollution
- However, the tax may increase costs for businesses, potentially reducing competitiveness
- The effectiveness depends on whether the tax rate reflects the true marginal external cost
- Revenue can be recycled to support green initiatives
[10 marks total]
18.
(a) Diagram and Explanation:
<image_placeholder> id: Q18-fig1 type: diagram linked_question: Q18(a) description: A monopoly diagram. Vertical axis: "Price/Cost ($)". Horizontal axis: "Quantity". Downward-sloping demand curve (D) and marginal revenue curve (MR) below it. MC curve is upward sloping (or U-shaped). ATC curve is U-shaped. The profit-maximising quantity (Q_m) is where MC = MR. The price (P_m) is found on the D curve directly above Q_m. The profit per unit is P_m minus ATC at Q_m. Total profit is the rectangle with height (P_m - ATC) and width Q_m. For comparison, the perfectly competitive outcome is where P = MC (D intersects MC), giving quantity Q_c and price P_c, where Q_c > Q_m and P_c < P_m. labels: D, MR, MC, ATC, Q_m, P_m, Q_c, P_c, profit rectangle, "Monopoly outcome", "Perfect competition outcome" values: Q_m < Q_c. P_m > P_c. Profit = (P_m - ATC) × Q_m. must_show: D, MR, MC, ATC curves. MR = MC determines Q_m. P_m on D above Q_m. Profit rectangle shaded. Competitive equilibrium at P=MC shown for comparison.
Explanation:
- The monopolist produces where MC = MR (profit-maximising condition) at quantity Q_m.
- The price is found on the demand curve at P_m (above MR).
- The monopolist earns supernormal profit = (P_m − ATC) × Q_m.
- Compared to perfect competition (where P = MC at Q_c, P_c), the monopolist produces less output at a higher price, resulting in a deadweight loss (allocative inefficiency) and a loss of consumer surplus.
[6 marks] — 2 marks for diagram, 2 marks for explaining monopoly equilibrium, 2 marks for comparison with perfect competition.
(b) Evaluation of price regulation:
Arguments for regulation (in favour of consumers and society):
- Without regulation, the monopolist charges P_m, which may make the life-saving drug unaffordable for many consumers, leading to equity concerns.
- Price regulation (e.g., setting a price ceiling at P_c or at ATC) can increase output and reduce price, improving allocative efficiency and reducing deadweight loss.
- As a life-saving drug, it may be considered a merit good — society values universal access.
Arguments against regulation (in favour of the firm):
- If the price is regulated below the firm's ATC, the firm may make losses and exit the market, reducing supply entirely.
- Monopoly profits provide the incentive for innovation and R&D. Pharmaceutical firms argue that high prices fund the development of new drugs. Price regulation could reduce future innovation.
- The patent system is designed to reward innovation — undermining it could have long-term dynamic efficiency costs.
Balanced view:
- A compromise might be to regulate the price to allow the firm to earn a normal profit (P = ATC) rather than forcing marginal cost pricing, balancing consumer access with innovation incentives.
- The government could also provide subsidies to the firm or directly to consumers to improve access without distorting the price signal.
[6 marks] — 2 marks for arguments for regulation, 2 marks for arguments against, 2 marks for balanced evaluation/judgement.
19.
(a) Explanation and Diagram:
The COE system imposes a quota (quantity restriction) on the number of new vehicles. This is equivalent to a perfectly inelastic supply curve at the quota quantity. The supply curve becomes vertical at the COE quota level.
<image_placeholder> id: Q19-fig1 type: diagram linked_question: Q19(a) description: A demand and supply diagram for the car market in Singapore. Vertical axis: "Price of cars ($)". Horizontal axis: "Quantity of cars". D is downward sloping. S is a vertical line at the COE quota quantity (Q_quota). The equilibrium is at the intersection of D and the vertical S, giving price P1. Without the COE, the supply curve would be upward sloping (S_normal), giving a lower price P0 and higher quantity Q0. The COE premium is effectively the difference between P1 and the original supply price at Q_quota. labels: D, S_quota (vertical), S_normal (upward sloping), Q_quota, Q0, P1, P0, "COE quota" values: Q_quota < Q0. P1 > P0. The vertical supply curve represents the fixed number of COEs. must_show: Vertical supply curve at quota, demand curve, equilibrium price and quantity, comparison with unrestricted supply.
Explanation: The COE system restricts the quantity of new cars to the quota. This raises the effective price of car ownership (car price + COE premium), reducing the quantity of cars on the road. The COE premium acts like a market-determined tax — when demand is high, the COE price rises, further discouraging car ownership.
[5 marks] — 2 marks for diagram, 3 marks for explanation.
(b) Evaluation:
Effectiveness of COE:
- Directly limits the growth of the vehicle fleet, which is a key determinant of congestion.
- The bidding mechanism ensures that those who value car ownership most (highest willingness to pay) obtain COEs, which is allocatively efficient in one sense.
- Revenue from COE auctions can be used to fund public transport improvements.
- Singapore's vehicle population growth rate has been kept very low (0% growth rate since 2018), suggesting the policy has been effective in limiting car numbers.
Limitations:
- The COE does not directly address usage — car owners may drive more once they have a car (moral hazard), as the marginal cost of driving is low.
- The COE system may be regressive — wealthier individuals can afford high COE prices, while lower-income aspiring car owners are priced out.
- It does not address congestion from existing vehicles or from foreign vehicles.
- As incomes rise, demand for cars increases, pushing COE prices higher (COE prices have exceeded $100,000 in recent years), which may become politically unsustainable.
Alternative policies:
- Electronic Road Pricing (ERP) / congestion charging: Directly charges for road usage, addressing the externality at the point of consumption. More efficient than restricting ownership because it targets usage.
- Investment in public transport: Improving MRT and bus services provides alternatives to car ownership, reducing demand.
- Parking restrictions and higher fuel taxes: Increase the cost of driving.
Conclusion: The COE system has been effective in limiting vehicle population growth but is a blunt instrument. It restricts ownership rather than usage. A combination of COE with congestion charging (ERP) and public transport investment is likely more effective than COE alone.
[7 marks] — 2 marks for explaining effectiveness, 3 marks for evaluation of limitations, 2 marks for alternative policy discussion.
20. Marking Scheme:
"The market mechanism is the most efficient way to allocate scarce resources in an economy." To what extent do you agree?
Knowledge and Understanding (AO1) — up to 3 marks:
- Understanding of the market mechanism: price system, demand and supply, the "invisible hand"
- Understanding of allocative efficiency (P = MC, MSB = MSC)
- Understanding of market failure: externalities, public goods, information asymmetry, monopoly power
Analysis (AO2) — up to 4 marks:
-
Case for the market mechanism:
- Prices act as signals and incentives, coordinating millions of decisions efficiently
- Consumer sovereignty — resources are allocated according to consumer preferences
- Competition drives productive efficiency (lowest cost) and dynamic efficiency (innovation)
- Adam Smith's "invisible hand" — self-interested behaviour leads to socially optimal outcomes under certain conditions
- Example: Singapore's relatively free market has led to high economic growth and efficient resource allocation
-
Case against (market failure):
- Externalities: Markets overproduce goods with negative externalities (pollution) and underproduce goods with positive externalities (education, healthcare)
- Public goods: Non-excludability and non-rivalry lead to free-rider problem; markets underprovide
- Information asymmetry: Adverse selection and moral hazard lead to inefficient outcomes (used cars, insurance)
- Monopoly power: Restricts output, raises price, creates deadweight loss
- Equity concerns: Markets may allocate resources efficiently but not equitably (income inequality)
- Merit/demerit goods: Consumers may not make optimal decisions due to imperfect information or irrationality
Evaluation (AO3) — up to 3 marks:
- The market mechanism is efficient under certain conditions (perfect competition, no externalities, perfect information, rational consumers). These conditions rarely hold perfectly in reality.
- The word "most" in the statement is important — compared to central planning, the market mechanism is generally more efficient, but it is not perfect.
- Government intervention can improve efficiency when market failure exists, but government failure can also occur.
- The optimal approach is likely a mixed economy — using the market mechanism as the primary allocation mechanism, with government intervention to correct market failures.
- Singapore is a good example of a mixed economy: largely free market with strategic government intervention (public housing, CPF, industrial policy).
Conclusion: The market mechanism is a powerful and generally efficient way to allocate resources, but it is not universally the most efficient. Market failures provide a case for government intervention. The most effective economies combine market mechanisms with well-designed government policies.
[10 marks total]
Free quiz and exam paper access
Enter your details to view this paper
Your access is remembered on this device.