A-Level Economics H1 Quiz - Microeconomics
Name: ___________________________
Class: ___________________________
Date: ___________________________
Score: ___________________________
Duration: 60 minutes
Total Marks: 40
Instructions: Answer all 20 questions. Section A consists of data-based short responses. Section B consists of diagram and concept application. Section C consists of policy evaluation. Use diagrams where requested and show reasoning. Approved calculator permitted.
Section A: Data Response and Interpretation (Questions 1–7)
1. With reference to Table 1 below, compare the average monthly household expenditure on private transport and public transport in Sengkang from 2019 to 2023. [2]
| Year | Private transport ($) | Public transport ($) |
|---|
| 2019 | 420 | 110 |
| 2023 | 510 | 145 |
2. Describe the trend in the price of hawker meals in Singapore from 2020 to 2024 with reference to Extract A. [2]
Extract A: Average hawker meal price rose from 3.20in2020to3.80 in 2022, then to $4.50 in 2024, with the steepest increase observed between 2022 and 2024.
3. Using Table 2, compare the price elasticity of demand for petrol and for tap water in Country X. [2]
| Good | % change in price | % change in quantity demanded | PED |
|---|
| Petrol | +10% | -2% | -0.2 |
| Tap water | +10% | -1% | -0.1 |
4. With reference to Extract B, explain the estimated PED value of -1.4 for cinema tickets. [2]
Extract B: Cinema ticket prices rose by 10% and attendance fell by 14% after streaming services became widely available.
5. Explain the likely value of price elasticity of supply for tuition centres in the short run. [2]
6. Using Table 3, compare the consumer expenditure on rice and on beef in 2022 and 2023. [2]
| Good | 2022 Expenditure ($m) | 2023 Expenditure ($m) |
|---|
| Rice | 80 | 84 |
| Beef | 120 | 110 |
7. With reference to Extract C, identify whether the good described is a public good. Explain. [2]
Extract C: Street lighting is available to all residents regardless of payment and one person's use does not reduce another's ability to use it.
Section B: Diagram and Concept Application (Questions 8–14)
8. Using a demand and supply diagram, explain how a fall in the price of chicken feed affects the equilibrium price and quantity of chicken meat. [4]
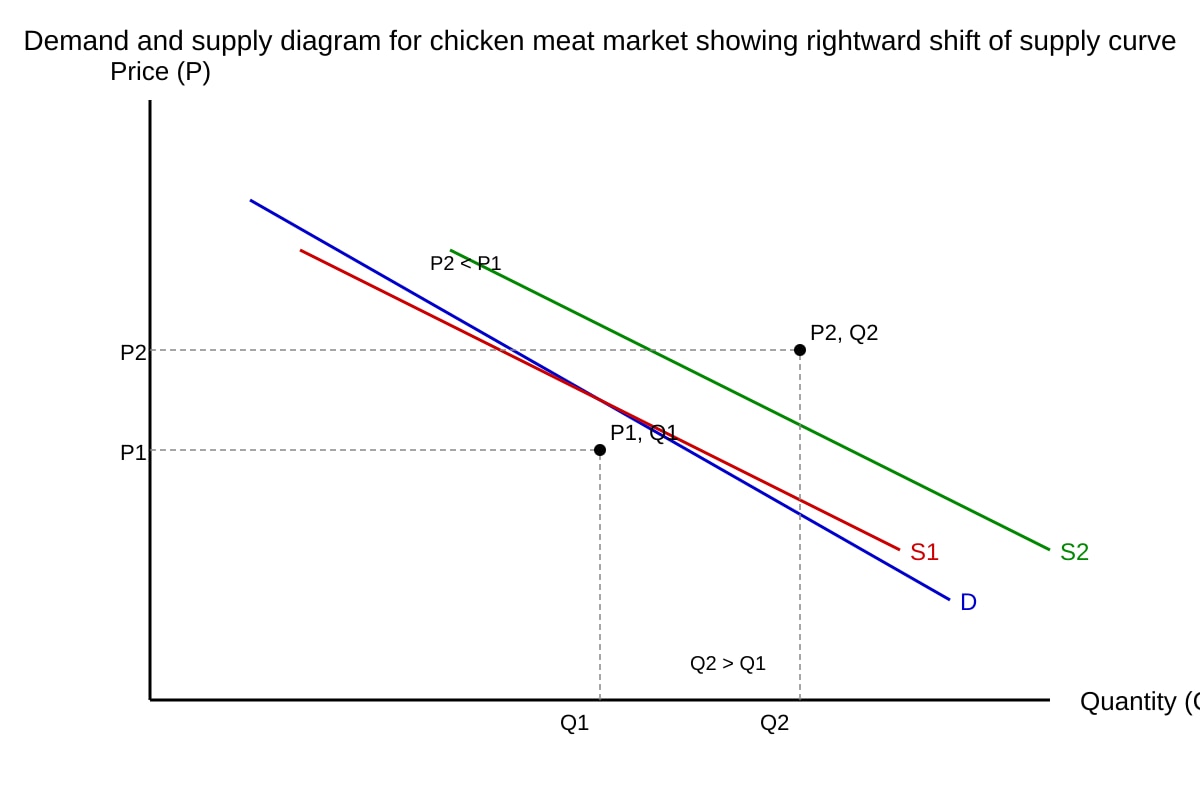
Generated graph for Q8.
9. Draw a production possibility curve (PPC) and use it to explain opportunity cost when an economy moves from producing only consumer goods to more capital goods. [3]
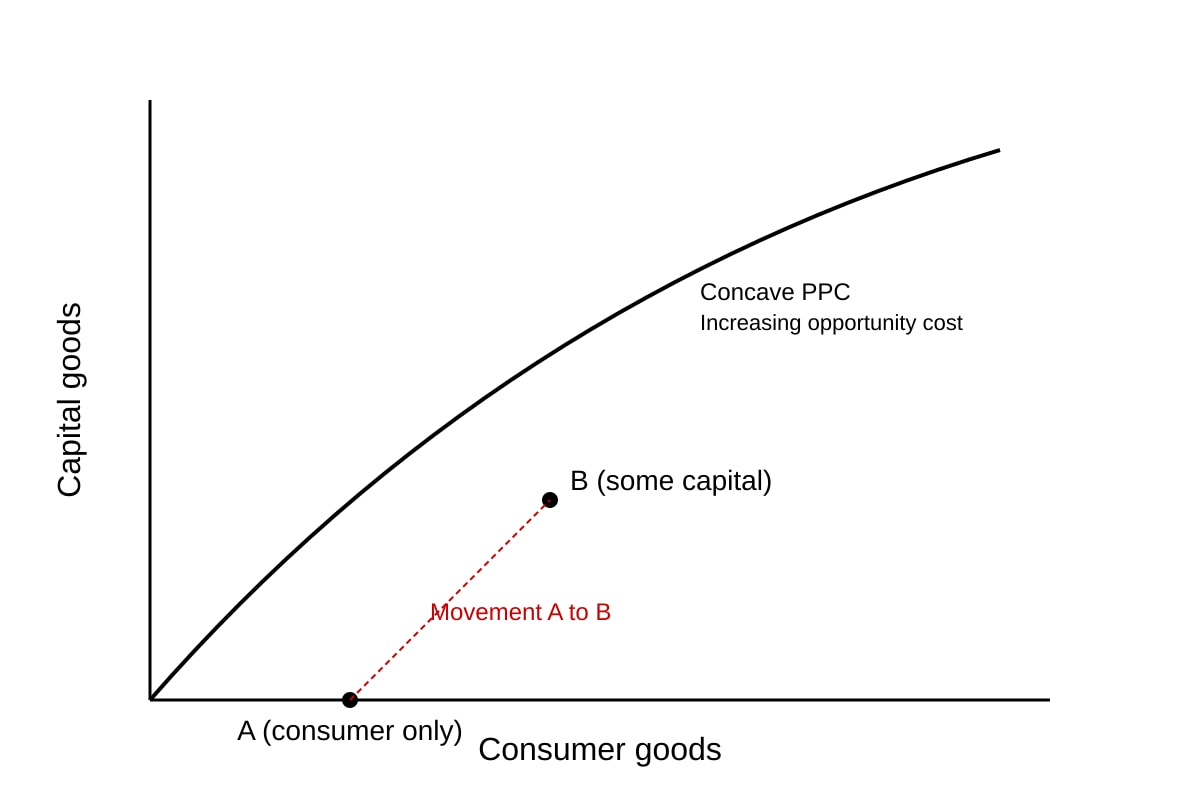
Generated diagram for Q9.
10. With reference to Extract D, explain how a negative externality arises in the market for electronic waste. [3]
Extract D: Improper disposal of e-waste releases toxic chemicals into soil, affecting nearby farms' output without compensation.
11. Using a demand and supply diagram, show the effect of a maximum price set below equilibrium on the rental housing market. [3]
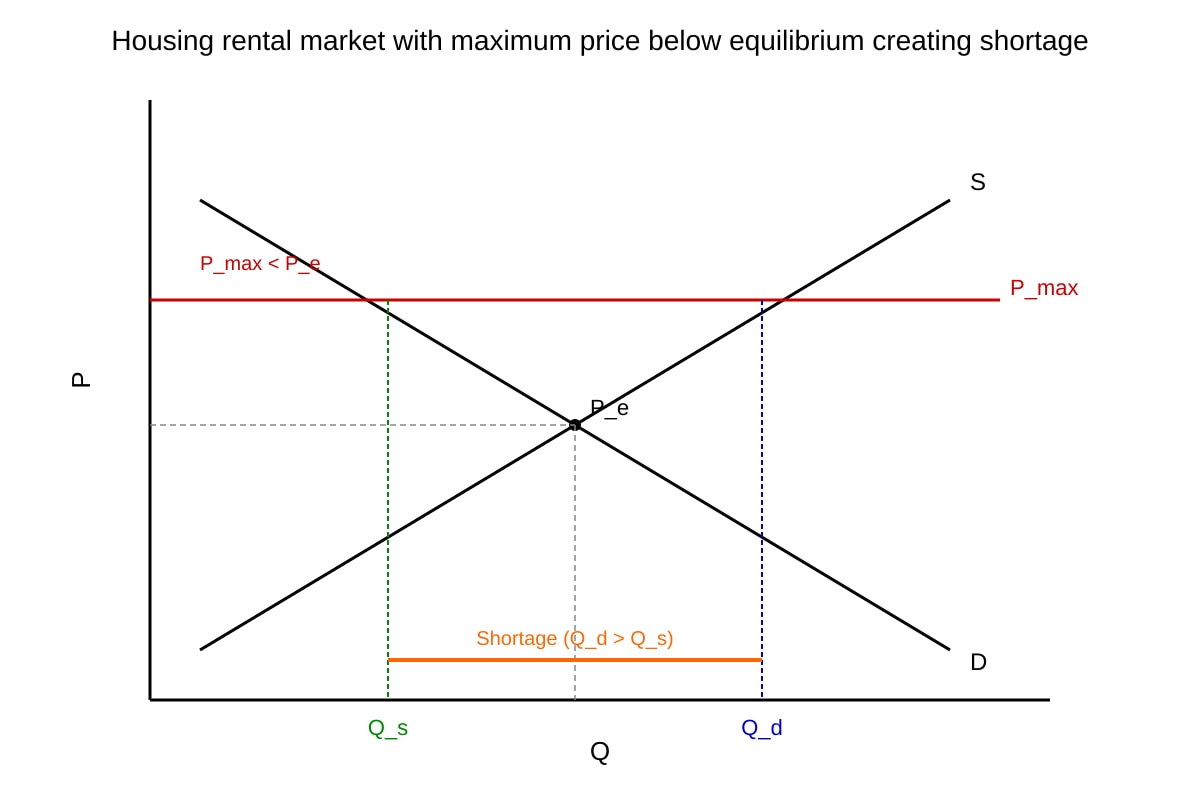
Generated graph for Q11.
12. Explain two non-price determinants that could shift the demand curve for electric cars to the right. [2]
13. Using a diagram, explain how a subsidy on solar panels affects producer revenue and quantity. [3]
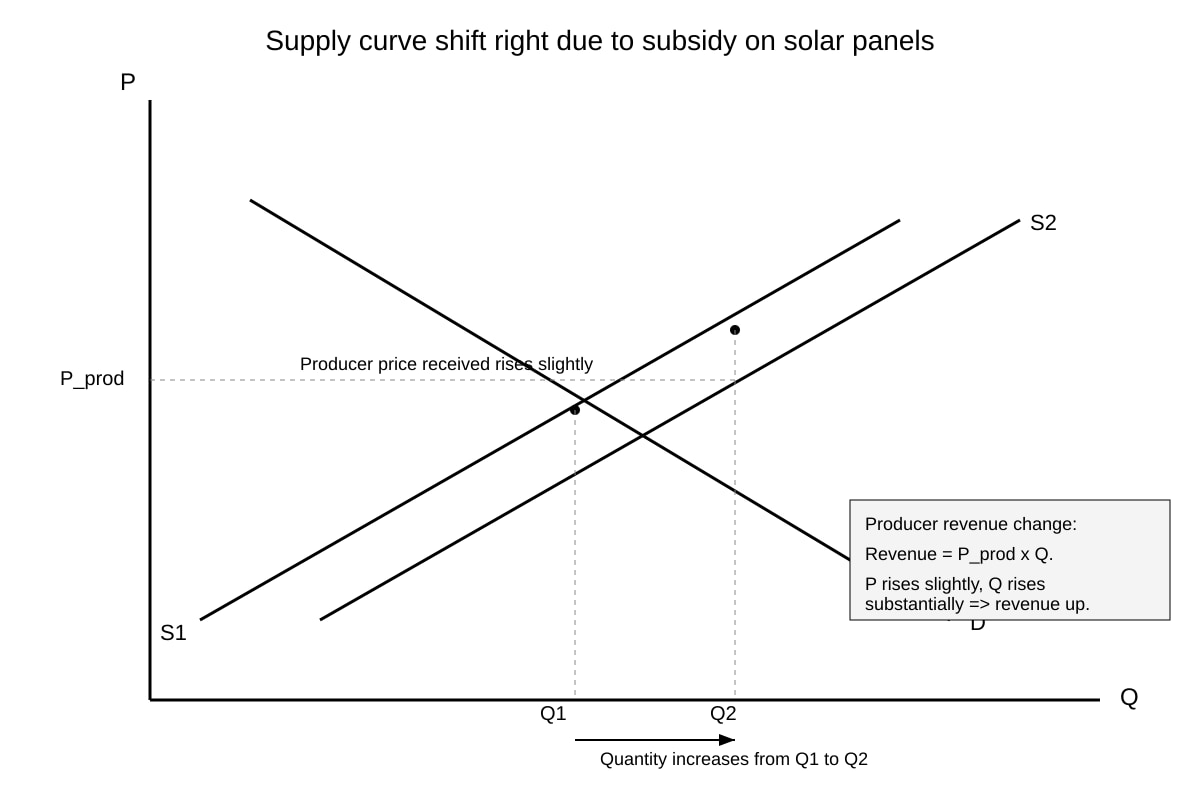
Generated graph for Q13.
14. State whether the following is a positive or negative externality and why: a beekeeper's bees pollinate a neighbouring orchard. [2]
Section C: Policy Evaluation (Questions 15–20)
15. A government imposes a tax on sugary drinks to correct market failure. Using a diagram, explain how this internalises a negative externality. [4]
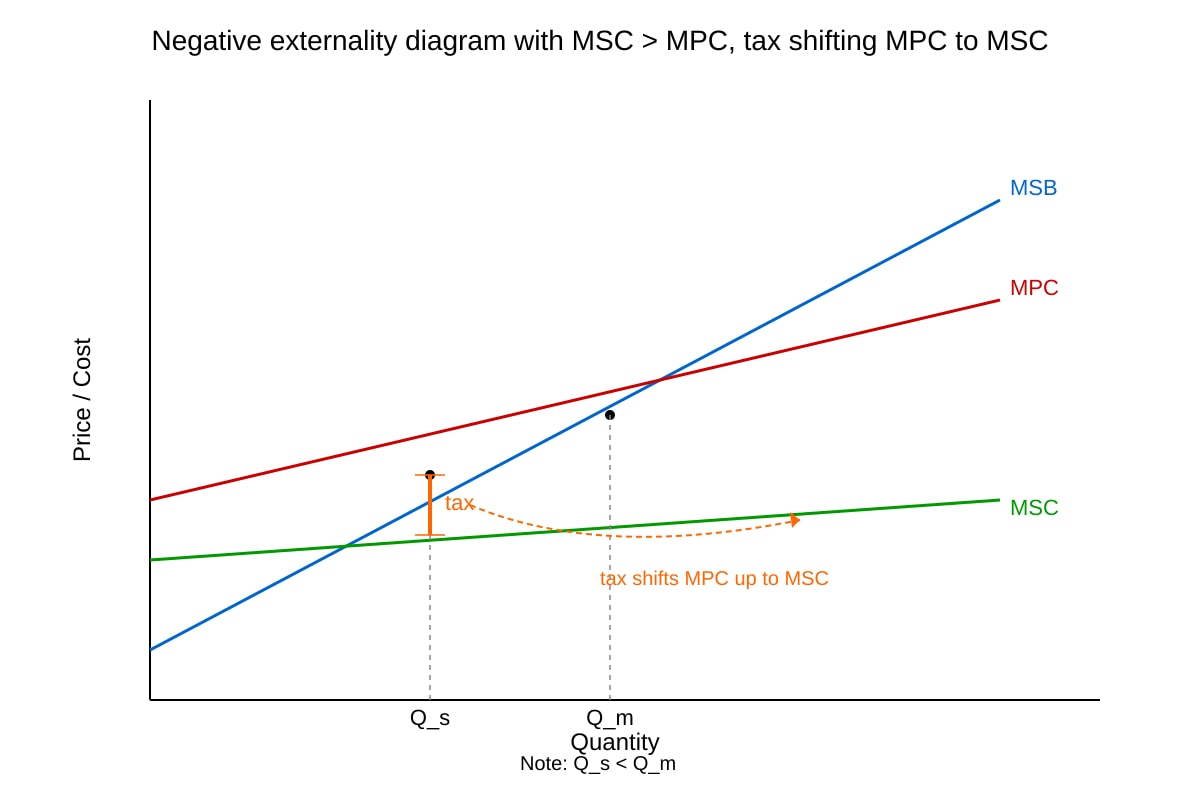
Generated graph for Q15.
16. Discuss whether a quota on foreign domestic workers is an effective way to protect local low-wage employment. [4]
17. Evaluate the use of public education campaigns to reduce information failure in the market for supplements. [3]
18. Using a PPC diagram, explain how a natural disaster that destroys factories affects productive capacity. [3]
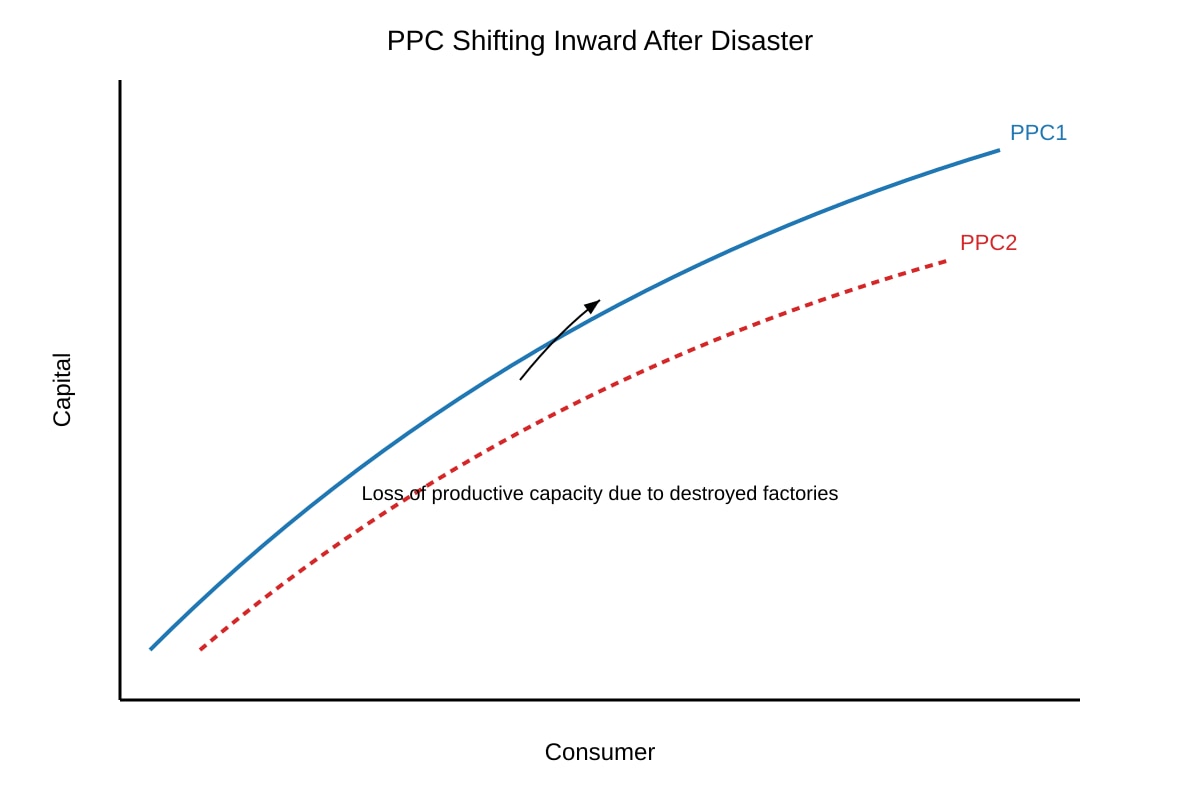
Generated diagram for Q18.
19. Explain why deadweight loss arises when a minimum price is set above equilibrium in the labour market for fresh graduates. [3]
20. Evaluate whether joint provision of broadband infrastructure by government and private firms can achieve both efficiency and equity. [4]
</stage3_quiz_answers_md>
A-Level Economics H1 Quiz - Microeconomics: Answer Key
Total Marks: 40
Duration: 60 minutes
Section A (Q1–7, 14 marks)
Q1. [2 marks]
Compare private vs public transport expenditure Sengkang 2019–2023.
- Both increased: private from 420to510 (+21%); public from 110to145 (+32%). [1]
- Public transport rose at a faster percentage rate, but private transport remained absolutely higher. [1]
Teaching note: Compare both sectors and both years; use comparative language. Common mistake: stating only one sector.
Q2. [2 marks]
Trend in hawker meal price 2020–2024.
- Generally increased from 3.20to4.50. [1]
- Rate accelerated after 2022 (steepest rise 2022–2024). [1]
Teaching note: Direction + rate. Do not just say "up".
Q3. [2 marks]
Compare PED petrol (-0.2) vs tap water (-0.1).
- Both inelastic (|PED|<1). [1]
- Petrol more elastic than tap water; tap water least responsive due to necessity. [1]
Formula: PED = %ΔQd / %ΔP.
Q4. [2 marks]
Explain PED = -1.4 for cinema.
- Calculated: -14% / +10% = -1.4. [1]
- Elastic (|PED|>1); demand responsive due to substitutes (streaming). [1]
Teaching note: Link to extract evidence.
Q5. [2 marks]
PES tuition centres short run.
- Likely low/inelastic (<1) due to time to hire/train tutors and limited classrooms. [1]
- Supply cannot expand quickly when price rises. [1]
Q6. [2 marks]
Compare expenditure rice & beef.
- Rice rose 80mto84m; beef fell 120mto110m. [1]
- Rice increased, beef decreased; beef still larger absolutely. [1]
Q7. [2 marks]
Public good? Yes.
- Non-excludable (all use regardless of payment) and non-rival (one use doesn't reduce another). [2]
Section B (Q8–14, 17 marks)
Q8. [4 marks]
Diagram: S shifts right (feed cheaper → lower cost).
- S1→S2 right; P falls P1→P2, Q rises Q1→Q2. [2]
- Explanation: lower production cost increases supply, surplus at old P pushes price down, quantity up. [2]
Q9. [3 marks]
PPC concave. Move A→B.
- Opportunity cost = consumer goods given up for capital goods. [1]
- Increasing OC shown by concave shape. [1]
- Diagram labelled. [1]
Q10. [3 marks]
Negative externality e-waste.
- Private disposal cost < social cost; toxic spill affects farms uncompensated. [2]
- MSC > MPC, overproduction. [1]
Q11. [3 marks]
Max price below P_e.
- P_max < P_e; Qd > Qs → shortage. [2]
- Diagram shows gap. [1]
Q12. [2 marks]
Two demand shifters: (1) rise in income if normal good; (2) higher price of petrol cars (substitute). [1 each]
Q13. [3 marks]
Subsidy → S right.
- Q up Q1→Q2; producers get P_prod > consumer P; revenue rises. [2]
- Diagram. [1]
Q14. [2 marks]
Positive externality: bees pollinate orchard free benefit to neighbour. [2]
Section C (Q15–20, 9 marks)
Q15. [4 marks]
Tax internalises: MPC shifts to MSC.
- Q_m → Q_s (social optimum). [2]
- Diagram with tax wedge = MSC-MPC. [2]
Q16. [4 marks]
Discuss quota:
- For: protects local jobs, raises wages. [2]
- Against: shortages, higher costs, inefficiency, unintended illegal employment. [2]
Evaluation needed for full marks.
Q17. [3 marks]
Public education:
- Reduces info failure, shifts demand to safe products. [2]
- Limited if low awareness; needs time. [1]
Q18. [3 marks]
PPC inward.
- Factories destroyed → less capital → PPC1→PPC2 inward. [2]
- Diagram. [1]
Q19. [3 marks]
Min price > P_e grads:
- Qs > Qd → unemployment (DWL). [2]
- Explain gap = deadweight loss. [1]
Q20. [4 marks]
Joint provision:
- Efficiency: shared cost, wider access. [2]
- Equity: rural coverage. [2]
Evaluate trade-offs (cost to gov, monopoly risk).
</stage3_quiz_answers_md>
<stage3_quiz_md>
A-Level Economics H1 Quiz - Microeconomics
Name: ___________________________
Class: ___________________________
Date: ___________________________
Score: ___________________________
Duration: 60 minutes
Total Marks: 40
Instructions: Answer all 20 questions. Section A consists of data-based short responses. Section B consists of diagram and concept application. Section C consists of policy evaluation. Use diagrams where requested and show reasoning. Approved calculator permitted.
Section A: Data Response and Interpretation (Questions 1–7)
1. With reference to Table 1 below, compare the average monthly household expenditure on private transport and public transport in Sengkang from 2019 to 2023. [2]
| Year | Private transport ($) | Public transport ($) |
|---|
| 2019 | 420 | 110 |
| 2023 | 510 | 145 |
2. Describe the trend in the price of hawker meals in Singapore from 2020 to 2024 with reference to Extract A. [2]
Extract A: Average hawker meal price rose from 3.20in2020to3.80 in 2022, then to $4.50 in 2024, with the steepest increase observed between 2022 and 2024.
3. Using Table 2, compare the price elasticity of demand for petrol and for tap water in Country X. [2]
| Good | % change in price | % change in quantity demanded | PED |
|---|
| Petrol | +10% | -2% | -0.2 |
| Tap water | +10% | -1% | -0.1 |
4. With reference to Extract B, explain the estimated PED value of -1.4 for cinema tickets. [2]
Extract B: Cinema ticket prices rose by 10% and attendance fell by 14% after streaming services became widely available.
5. Explain the likely value of price elasticity of supply for tuition centres in the short run. [2]
6. Using Table 3, compare the consumer expenditure on rice and on beef in 2022 and 2023. [2]
| Good | 2022 Expenditure ($m) | 2023 Expenditure ($m) |
|---|
| Rice | 80 | 84 |
| Beef | 120 | 110 |
7. With reference to Extract C, identify whether the good described is a public good. Explain. [2]
Extract C: Street lighting is available to all residents regardless of payment and one person's use does not reduce another's ability to use it.
Section B: Diagram and Concept Application (Questions 8–14)
8. Using a demand and supply diagram, explain how a fall in the price of chicken feed affects the equilibrium price and quantity of chicken meat. [4]
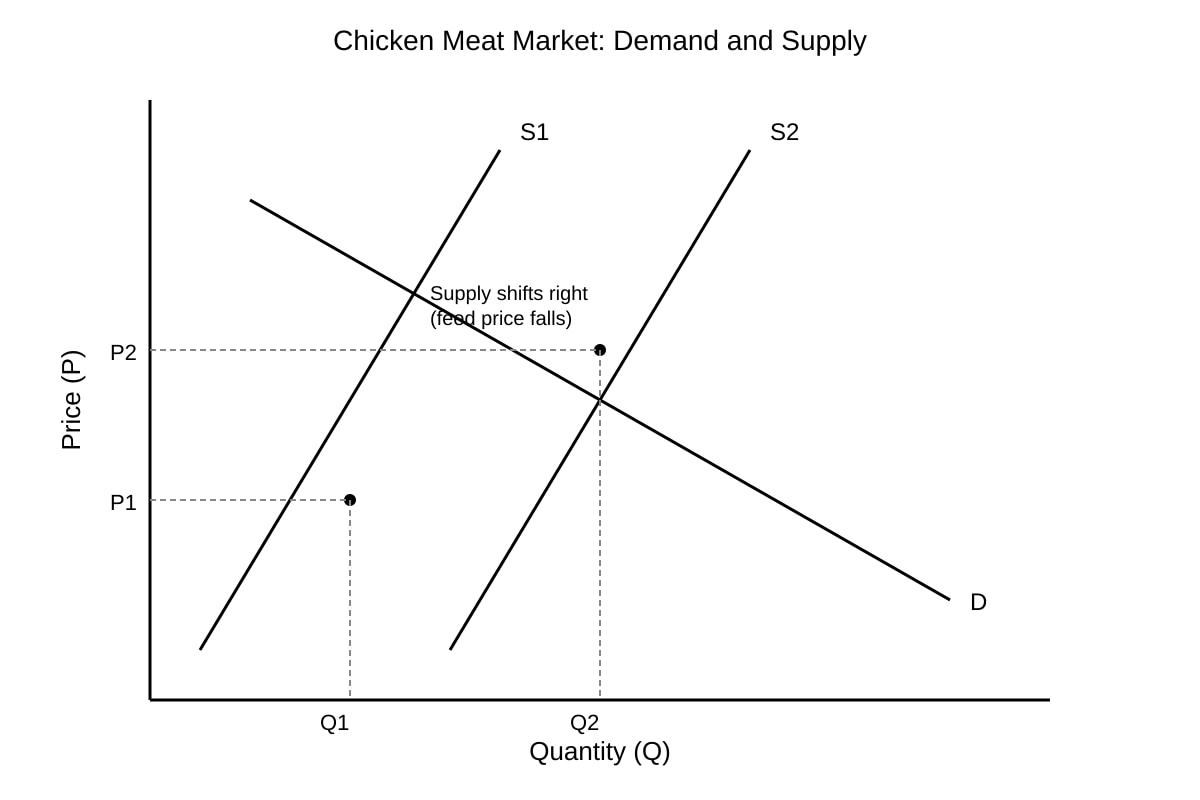
Generated graph for Q8.
9. Draw a production possibility curve (PPC) and use it to explain opportunity cost when an economy moves from producing only consumer goods to more capital goods. [3]
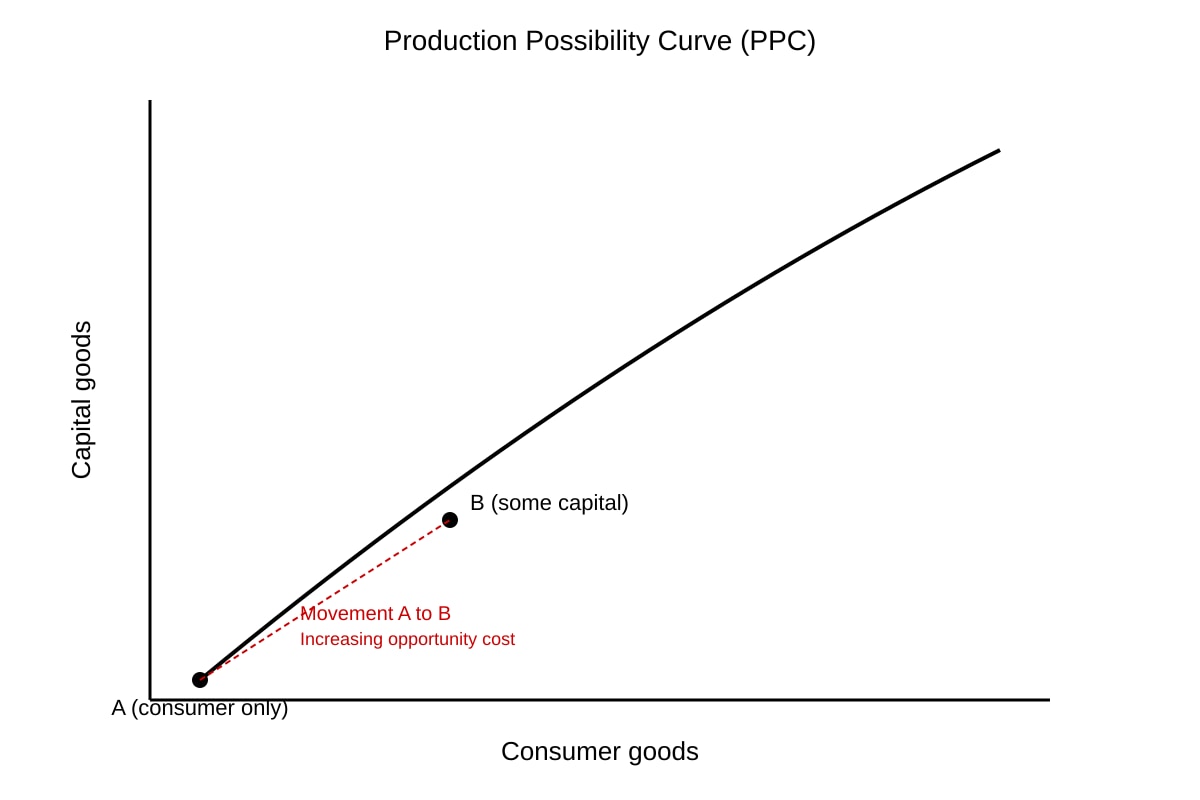
Generated diagram for Q9.
10. With reference to Extract D, explain how a negative externality arises in the market for electronic waste. [3]
Extract D: Improper disposal of e-waste releases toxic chemicals into soil, affecting nearby farms' output without compensation.
11. Using a demand and supply diagram, show the effect of a maximum price set below equilibrium on the rental housing market. [3]
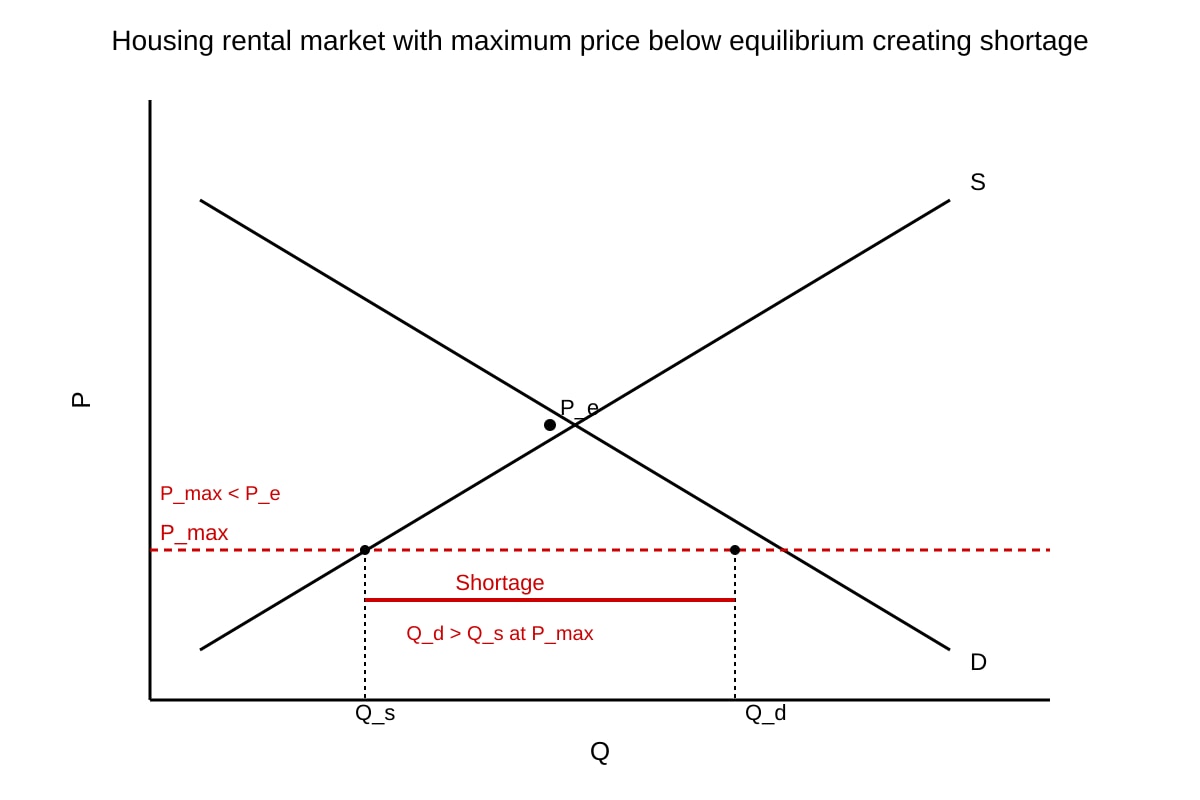
Generated graph for Q11.
12. Explain two non-price determinants that could shift the demand curve for electric cars to the right. [2]
13. Using a diagram, explain how a subsidy on solar panels affects producer revenue and quantity. [3]
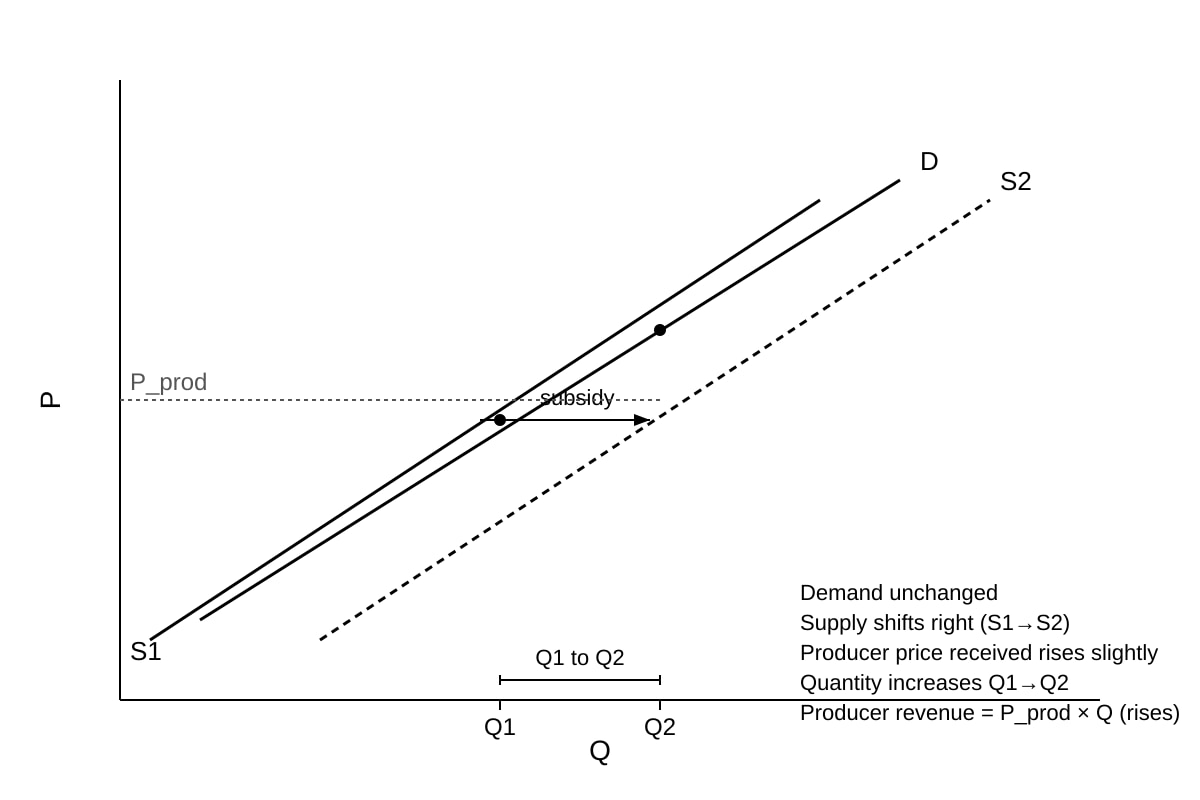
Generated graph for Q13.
14. State whether the following is a positive or negative externality and why: a beekeeper's bees pollinate a neighbouring orchard. [2]
Section C: Policy Evaluation (Questions 15–20)
15. A government imposes a tax on sugary drinks to correct market failure. Using a diagram, explain how this internalises a negative externality. [4]
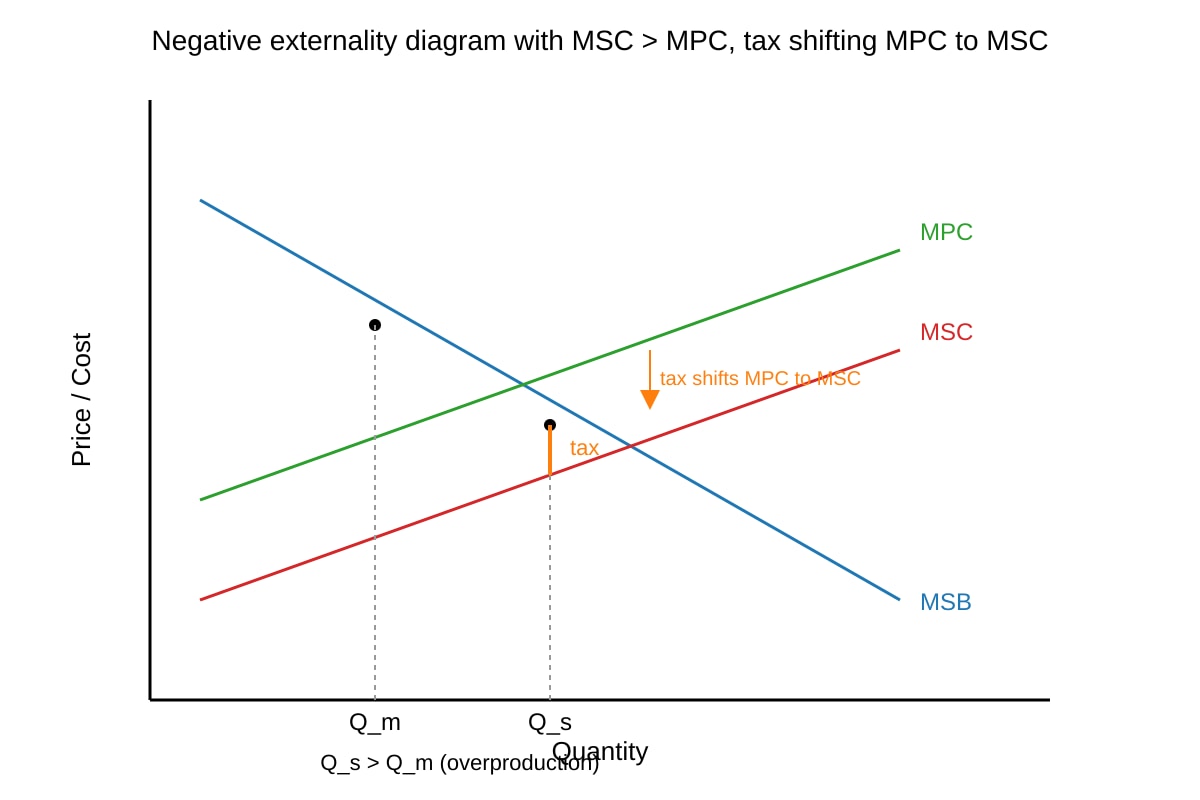
Generated graph for Q15.
16. Discuss whether a quota on foreign domestic workers is an effective way to protect local low-wage employment. [4]
17. Evaluate the use of public education campaigns to reduce information failure in the market for supplements. [3]
18. Using a PPC diagram, explain how a natural disaster that destroys factories affects productive capacity. [3]
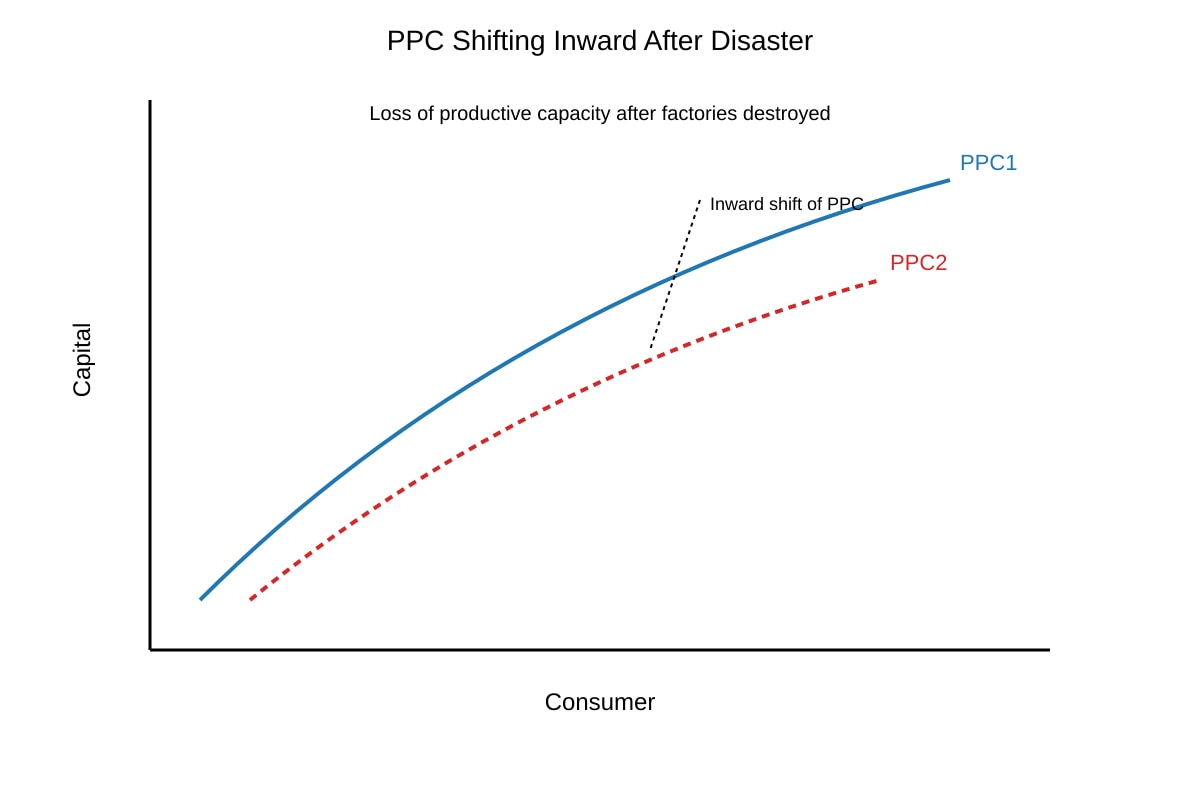
Generated diagram for Q18.
19. Explain why deadweight loss arises when a minimum price is set above equilibrium in the labour market for fresh graduates. [3]
20. Evaluate whether joint provision of broadband infrastructure by government and private firms can achieve both efficiency and equity. [4]