From Real Exams Quiz
A Level H1 Economics Market Failure Quiz
Free A Level H1 Econs Market Failure quiz, HY3 Exam version, with questions, answers, and A Level-style practice for Singapore students.
These static practice materials are generated from the site's syllabus and paper-generation workflow, with source and model context shown so students and parents can evaluate the material before use.
Questions
Free quiz and exam paper access
Enter your details to view this paper
Your access is remembered on this device.
Answers
A-Level Economics H1 Quiz - Market Failure: Answer Key
Total Marks: 40
Topic: Market Failure (Theme 2.2)
Section A: Short Structured Questions (1–5)
1. Define market failure. [2]
Answer: Market failure occurs when the free market fails to allocate resources efficiently, so that marginal social benefit (MSB) ≠ marginal social cost (MSC). [1] It results in a net welfare loss (deadweight loss) to society. [1]
Teaching note: Efficiency requires MSB = MSC. When this fails due to externalities, public goods, or information failure, the market outcome is not socially optimal.
2. State two characteristics of a public good. [2]
Answer: Non-rivalry (one person's consumption does not reduce another's) [1]; non-excludability (non-payers cannot be prevented from consuming). [1]
Common mistake: Confusing with merit goods; public goods are not provided profitably by the market.
3. Give one example of a negative externality in consumption. [1]
Answer: Cigarette smoking (passive smoke harms others) / loud music disturbing neighbours. [1]
4. Give one example of a positive externality in production. [1]
Answer: Beekeeping (pollination benefits farms) / factory training workers who later benefit other firms. [1]
5. Explain what is meant by information failure. [2]
Answer: Information failure occurs when consumers or producers lack accurate information [1] leading to decisions that do not reflect true private or social costs/benefits (e.g., under-consumption of merit goods). [1]
Section B: Data and Diagram Interpretation (6–13)
6. [2]
Answer: Both towns' per-household air pollution cost increased from 2018 to 2022. [1] Town A was higher than Town B in both years (90; 150) and the gap widened from 60. [1]
Marking: 1 mark for direction, 1 for comparative magnitude.
7. [2]
Answer: EV subsidy rose steadily from 130m in 2023. [1] Increase was accelerating (15, 15, 25, 35 added each year). [1]
8. [4]
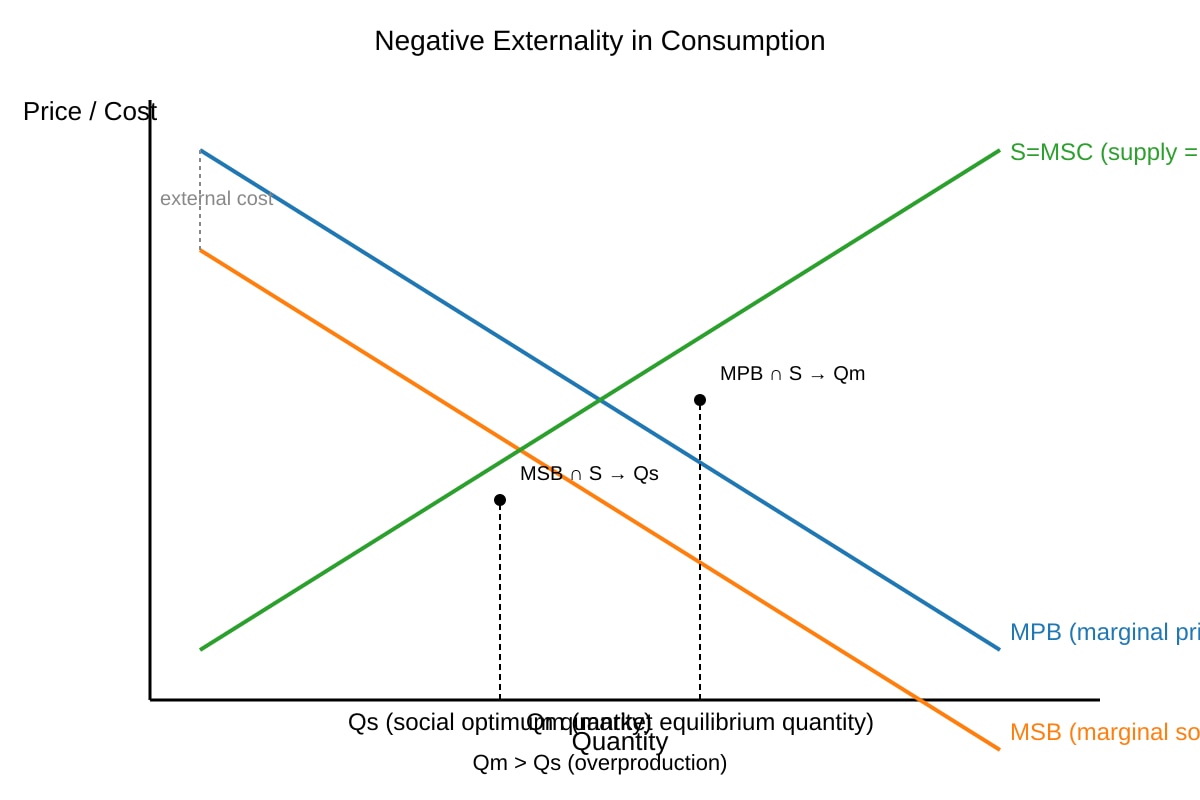
Answer: In the diagram, MPB > MSB by external cost. [1] Market equilibrium at Qm where MPB = MSC. [1] Social optimum at Qs where MSB = MSC. [1] Since MSB < MPB, Qm > Qs, so market overproduces relative to social optimum, causing deadweight loss. [1]
Teaching: Negative consumption externality → private benefit overstates social benefit → excess output.
9. [4]
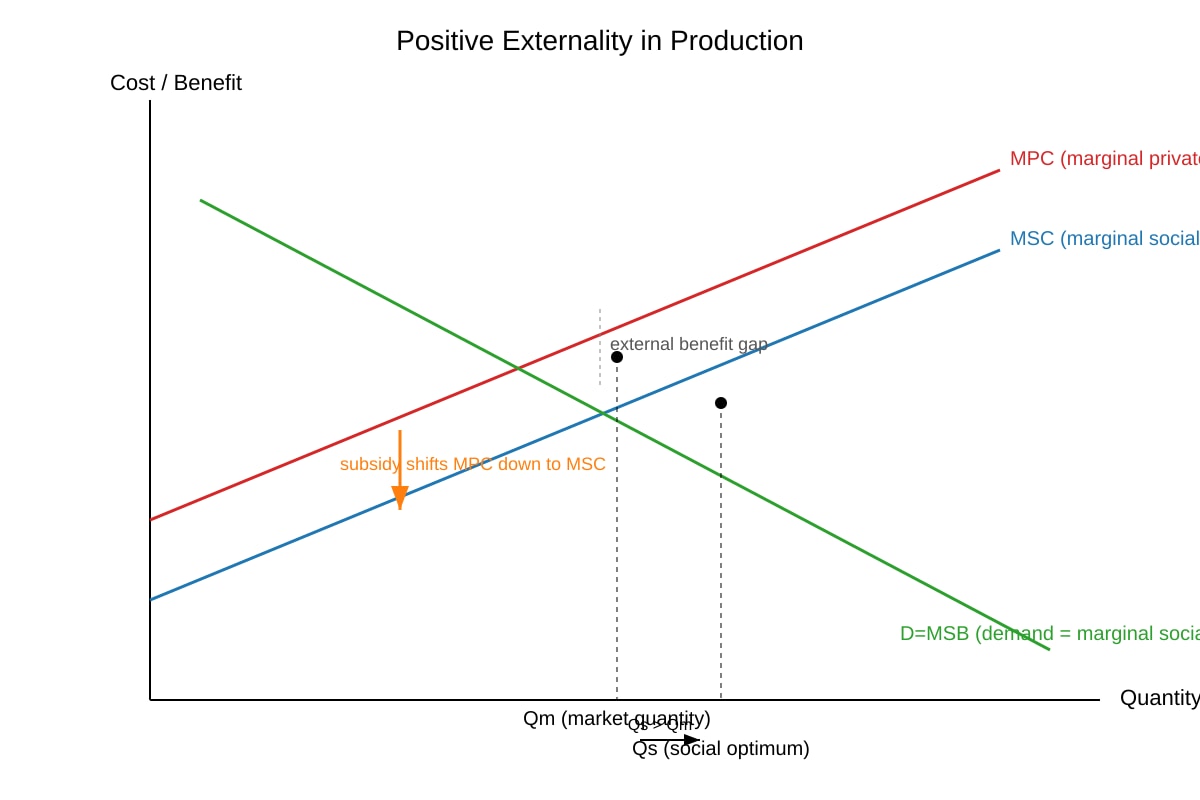
Answer: MPC > MSC by external benefit. [1] Market equilibrium Qm where MPC = MSB is below Qs. [1] Subsidy lowers MPC to MSC, shifting supply right. [1] New equilibrium at Qs where MSC = MSB, correcting underproduction. [1]
10. [3]
MSC = MPC – MEB (since external benefit reduces social cost relative to private).
Unit 1: 20 – 8 = 12 [1]
Unit 2: 26 – 8 = 18 [1]
Unit 3: 34 – 8 = 26 [1]
11. [2]
Market equilibrium: MPC = MSB → Unit 1 (MPC 20 < 40), Unit 2 (26 < 38), Unit 3 (34 = 34) → Qm = 3. [1]
Social optimum: MSC = MSB → Unit 1 (12 < 40), Unit 2 (18 < 38), Unit 3 (26 < 34), Unit 4 would be needed but not given; highest where MSC ≤ MSB is Unit 3 (26<34) but next would exceed; given data Qs = 3 also, but if MSB at 4 unknown, state Qs ≥ 3. For exam: market = 3, social optimum = 3 on given data but note external benefit means more would be optimal if demand continued. [1]
Simplified marking: Market unit = 3, Social optimal unit = 3 (based on table; explain MEB means more desirable beyond).
12. [2]
Answer: Youths underestimated UV risk (information failure) [1] so they consumed less sunscreen than socially optimal, causing potential health externalities. [1]
13. [3]
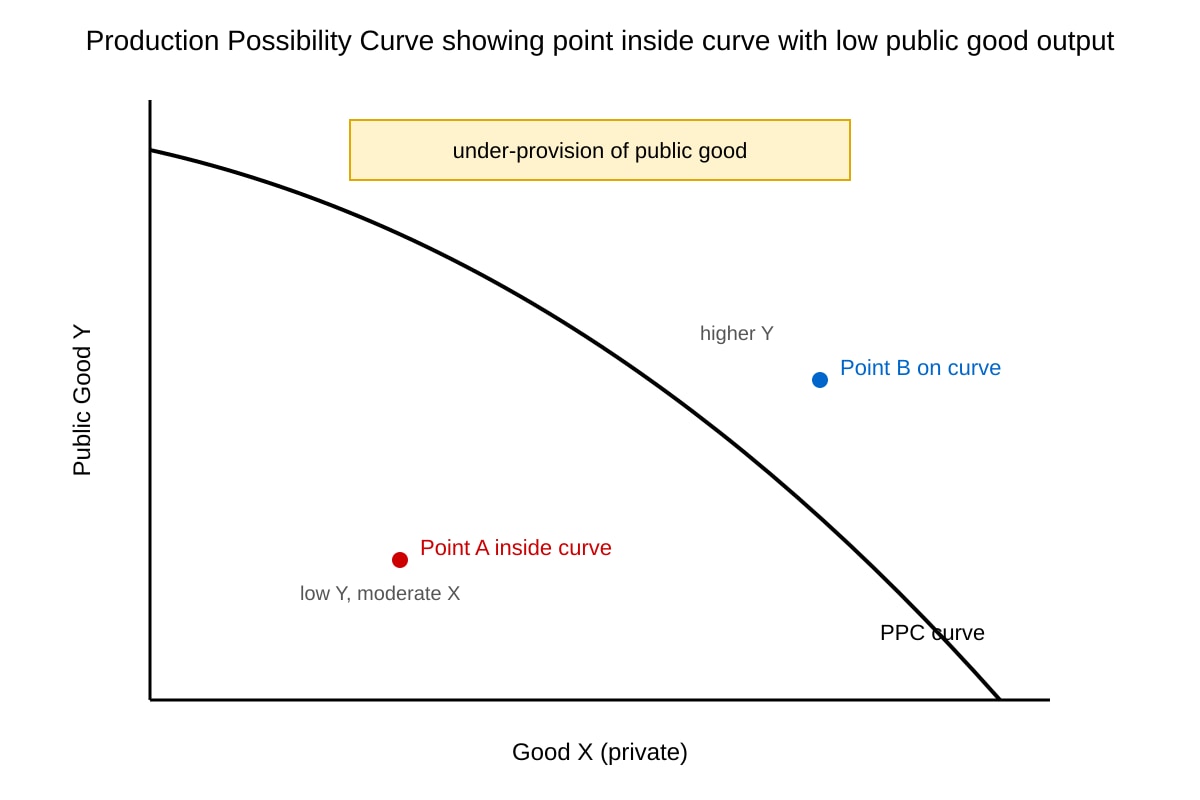
Answer: PPC drawn concave. [1] Point A inside curve with low public good Y. [1] Annotation showing under-provision / inefficiency. [1]
Section C: Source-Based and Evaluation (14–20)
14. [1]
Answer: Positive externality in production (beekeeping benefits farms unpaid). [1]
15. [3]
Answer: Beekeepers receive only private benefit (honey) but generate external benefit (pollination). [1] MPC > MSC, so market output below social optimum. [1] Free market under-provides beekeeping relative to MSB = MSC point. [1]
16. [4]
Answer: Street lighting is non-rival (all can use) [1] and non-excludable (cannot fence light) [1] so private firms cannot charge → market fails to provide [1] thus government provision justified to achieve efficiency. [1]
Descriptor: 2 marks for characteristics, 2 for application.
17. [4]
Answer: Carbon tax raises private cost to include external cost, shifting MPC toward MSC. [1] Reduces emissions to social optimum. [1] But tax level hard to set; may hurt competitiveness. [1] Revenue can fund clean tech; evaluation needs balance of equity and efficiency. [1]
18. [2]
Answer: Both firms' external cost per tonne rose (P: 15→25, Q: 22→30). [1] Q remained higher than P in both years; gap narrowed from 7 to 5. [1]
19. [3]
Answer: Government sets total permit cap. [1] Firms trade permits; low-cost reducers sell to high-cost. [1] Achieves emission cut at lowest cost, internalising externality. [1]
20. [4]
Answer: Campaigns improve information, raising merit good consumption. [1] But may not change behaviour if other barriers (price, preference). [1] Need subsidies/regulation alongside. [1] Therefore not sufficient alone; combination policy more effective. [1]