From Real Exams Quiz
A Level H1 Economics Macroeconomics Quiz
Free A Level H1 Econs Macroeconomics quiz, LongCat Exam version, with questions, answers, and A Level-style practice for Singapore students.
These static practice materials are generated from the site's syllabus and paper-generation workflow, with source and model context shown so students and parents can evaluate the material before use.
Questions
A-Level Economics H1 Quiz - Macroeconomics
Name: ___________________________
Class: ___________________________
Date: ___________________________
Score: _________ / 60
Duration: 90 minutes
Total Marks: 60
Instructions:
- Answer ALL questions.
- Read each question carefully and use economic terminology where appropriate.
- For calculation questions, show all working clearly.
- For analysis and evaluation questions, use relevant economic theory and real-world examples where appropriate.
- Where data or diagrams are referenced, refer to the information provided in the question.
Section A: Data Response & Interpretation (Questions 1–5)
Refer to the following data for Questions 1–4.
Table 1: Selected Macroeconomic Indicators for Country X
| Indicator | 2019 | 2020 | 2021 | 2022 |
|---|---|---|---|---|
| Real GDP (US$ billion) | 320.5 | 301.2 | 315.8 | 328.4 |
| Real GDP growth rate (%) | 3.2 | −5.8 | 4.9 | 3.8 |
| Unemployment rate (%) | 3.1 | 6.4 | 5.2 | 4.1 |
| Inflation rate (CPI, %) | 1.5 | 0.3 | 2.8 | 5.6 |
| Current account balance (% of GDP) | 4.2 | 3.1 | 2.8 | 1.5 |
| Government budget balance (% of GDP) | 1.8 | −6.2 | −4.5 | −2.1 |
1. With reference to Table 1, describe the trend in real GDP growth rate for Country X from 2019 to 2022. (2 marks)
2. With reference to Table 1, compare the unemployment rate and inflation rate for Country X in 2020 and 2022. (3 marks)
3. Using the data in Table 1, explain the likely relationship between the government budget balance and the real GDP growth rate from 2019 to 2022. (3 marks)
4. (a) Calculate the percentage change in real GDP for Country X from 2019 to 2020. Show your working. (2 marks)
(b) Using your answer in (a), explain one likely consequence of this change in real GDP for Country X's economy. (2 marks)
5. Define the term "natural rate of unemployment" and explain why a government might be concerned if the actual unemployment rate falls significantly below this level. (4 marks)
Section B: Structured Response (Questions 6–14)
6. Distinguish between demand-pull inflation and cost-push inflation, giving one cause of each. (4 marks)
7. Explain two reasons why a government might aim to achieve a low and stable rate of inflation as a macroeconomic objective. (4 marks)
8. Using an AD/AD diagram, explain how an increase in exports might affect the price level and real output of an economy. (4 marks)
Generated graph for Q8.
9. Explain the difference between the multiplier effect and the accelerator effect in macroeconomics. (4 marks)
10. A country has a marginal propensity to consume (MPC) of 0.75. The government increases spending by $200 million.
(a) Calculate the value of the multiplier. Show your working. (2 marks)
(b) Calculate the total change in national income resulting from the government spending increase. Show your working. (2 marks)
11. Explain two limitations of using GDP as a measure of standard of living. (4 marks)
12. Describe the main components of the circular flow of income and explain how a leakage affects the level of national income. (4 marks)
13. Explain how a central bank might use monetary policy to reduce a high rate of inflation. Include reference to interest rates and the transmission mechanism. (5 marks)
14. Distinguish between a current account deficit and a budget deficit. Explain whether a current account deficit is always a cause for concern for an economy. (5 marks)
Section C: Essay / Extended Response (Questions 15–20)
15. "Supply-side policies are the most effective way to achieve sustained economic growth without causing inflation." Evaluate this statement. (8 marks)
16. Evaluate the view that a government should always aim to balance its budget rather than run a budget deficit. (8 marks)
17. Singapore has experienced a rising cost of living in recent years. Discuss whether the Singapore government should prioritise controlling inflation over achieving full employment. (8 marks)
18. (a) Explain the causes of unemployment in an economy. (4 marks)
(b) Evaluate the effectiveness of demand-side policies in reducing unemployment. (4 marks)
19. A small open economy is experiencing a significant fall in its exchange rate.
(a) Explain two possible causes of a fall in the exchange rate. (4 marks)
(b) Discuss the likely effects of a significant fall in the exchange rate on the economy. (4 marks)
20. "Economic growth inevitably leads to a more unequal distribution of income." Assess the extent to which you agree with this statement. (8 marks)
Answers
A-Level Economics H1 Quiz - Macroeconomics: Answer Key
Section A: Data Response & Interpretation
1. With reference to Table 1, describe the trend in real GDP growth rate for Country X from 2019 to 2020. (2 marks)
Answer:
- The real GDP growth rate fell sharply from +3.2% in 2019 to −5.8% in 2020, indicating a severe economic contraction (recession). (1 mark)
- It then recovered strongly to +4.9% in 2021 and moderated to +3.8% in 2022, showing a V-shaped recovery pattern. (1 mark)
Teaching Note: A "trend" question requires describing the overall direction of change across the period, not just individual data points. Students should use language like "fell sharply," "recovered," and "moderated." The key is to identify the pattern: contraction followed by recovery.
Common Mistake: Students often list each year's figure without describing the overall trend. Describing a trend requires comparative language and identification of the overall pattern.
2. With reference to Table 1, compare the unemployment rate and inflation rate for Country X in 2020 and 2022. (3 marks)
Answer:
- In 2020, the unemployment rate was 6.4% while the inflation rate was only 0.3%. (1 mark)
- In 2022, the unemployment rate fell to 4.1% (lower than 2020) while the inflation rate rose significantly to 5.6% (much higher than 2020). (1 mark)
- The two indicators moved in opposite directions: unemployment decreased while inflation increased between 2020 and 2022, suggesting a possible short-run trade-off consistent with the Phillips Curve relationship. (1 mark)
Teaching Note: "Compare" requires identifying similarities AND differences. Students must reference both indicators for both years. The best answers will note the inverse relationship and connect it to economic theory (Phillips Curve).
Common Mistake: Students may only describe one year or one indicator. A comparison must address both items being compared across both time periods.
3. Using the data in Table 1, explain the likely relationship between the government budget balance and the real GDP growth rate from 2019 to 2022. (3 marks)
Answer:
- In 2019, the government ran a budget surplus (+1.8% of GDP) while real GDP grew at 3.2%. (1 mark)
- In 2020, real GDP contracted sharply by 5.8% and the government budget moved to a large deficit (−6.2% of GDP). This is likely due to automatic stabilisers (lower tax revenue, higher welfare spending) and/or discretionary fiscal stimulus to counter the recession. (1 mark)
- From 2020 to 2022, as real GDP growth recovered (4.9% then 3.8%), the budget deficit narrowed (from −6.2% to −2.1%), suggesting that improving economic conditions increased tax revenues and reduced government spending on unemployment benefits. (1 mark)
Teaching Note: This question tests understanding of the relationship between the economic cycle and government finances. Students should recognise automatic stabilisers — the budget automatically moves toward deficit during a recession and toward surplus during expansion.
Common Mistake: Students may simply describe each variable separately without explaining the causal link between them.
4. (a) Calculate the percentage change in real GDP for Country X from 2019 to 2020. Show your working. (2 marks)
Answer:
- Percentage change = [(New value − Old value) / Old value] × 100
- Percentage change = [(301.2 − 320.5) / 320.5] × 100
- Percentage change = [−19.3 / 320.5] × 100
- Percentage change = −6.02% (or approximately −6.0%) (2 marks)
Marking: 1 mark for correct formula/method, 1 mark for correct final answer.
(b) Using your answer in (a), explain one likely consequence of this change in real GDP for Country X's economy. (2 marks)
Answer:
- The fall in real GDP of approximately 6% indicates a severe recession. (1 mark)
- One likely consequence is a significant rise in unemployment, as firms reduce production and lay off workers due to falling demand. This is supported by Table 1, which shows unemployment rising from 3.1% to 6.4%. (1 mark)
Teaching Note: Students should connect the fall in GDP to real economic consequences. Acceptable answers include: rising unemployment, falling incomes, reduced consumer spending, falling business investment, or deflationary pressure.
5. Define the term "natural rate of unemployment" and explain why a government might be concerned if the actual unemployment rate falls significantly below this level. (4 marks)
Answer:
- Definition: The natural rate of unemployment is the rate of unemployment that exists when the economy is at full employment (potential output), consisting of frictional and structural unemployment. It is the unemployment rate consistent with a stable rate of inflation (also known as the NAIRU — Non-Accelerating Inflation Rate of Unemployment). (2 marks)
- Explanation of concern: If actual unemployment falls significantly below the natural rate, it means the economy is overheating — aggregate demand exceeds aggregate supply at potential output. This creates excess demand in labour markets, pushing up wages as firms compete for scarce workers. Rising wage costs feed into higher production costs and consumer prices, leading to accelerating (demand-pull) inflation. (2 marks)
Teaching Note: The natural rate is NOT zero unemployment — it includes frictional and structural unemployment. Students often confuse this. The key concern with unemployment below the natural rate is inflationary pressure.
Common Mistake: Defining natural rate as "zero unemployment" or failing to mention the inflationary consequence.
Section B: Structured Response
6. Distinguish between demand-pull inflation and cost-push inflation, giving one cause of each. (4 marks)
Answer:
- Demand-pull inflation occurs when the general price level rises due to aggregate demand growing faster than aggregate supply (excess demand in the economy). (1 mark)
- One cause: Excessive growth in consumer spending (e.g., due to easy credit conditions or rising consumer confidence) or rapid increases in government spending. (1 mark)
- Cost-push inflation occurs when the general price level rises due to increases in the costs of production, shifting the short-run aggregate supply curve to the left. (1 mark)
- One cause: A rise in global oil prices increasing production and transportation costs for firms, or wage increases that outpace productivity growth. (1 mark)
Teaching Note: The key distinction is the source of inflationary pressure: demand-pull originates from the AD side (too much spending chasing too few goods), while cost-push originates from the AS side (rising production costs). Students should be able to identify which curve shifts in each case.
Common Mistake: Students sometimes confuse the two or give vague causes without linking them to the correct type of inflation.
7. Explain two reasons why a government might aim to achieve a low and stable rate of inflation as a macroeconomic objective. (4 marks)
Answer:
Reason 1: To maintain the purchasing power of money and protect living standards (2 marks)
- High and unpredictable inflation erodes the real value of money, meaning consumers can buy less with each dollar. This particularly harms those on fixed incomes (e.g., pensioners) and low-income earners who cannot negotiate wage increases. A low and stable inflation rate preserves consumers' purchasing power and maintains confidence in the currency. (1 mark for explanation, 1 mark for development/link to living standards)
Reason 2: To create a stable environment for investment and economic growth (2 marks)
- High and volatile inflation creates uncertainty for businesses, making it difficult to plan future investments, set prices, and negotiate contracts. This uncertainty discourages both domestic and foreign investment. Low and stable inflation reduces this uncertainty, encouraging firms to invest in productive capacity, which supports long-run economic growth. (1 mark for explanation, 1 mark for development/link to investment)
Alternative acceptable reasons:
- To maintain international competitiveness (high domestic inflation makes exports more expensive)
- To reduce menu costs and shoe-leather costs associated with high inflation
- To prevent arbitrary redistribution of income and wealth (e.g., from savers to borrowers)
Teaching Note: Each reason needs a clear explanation (what the problem is) and development (why it matters for the economy). Students who only state the reason without explaining it will not receive full marks.
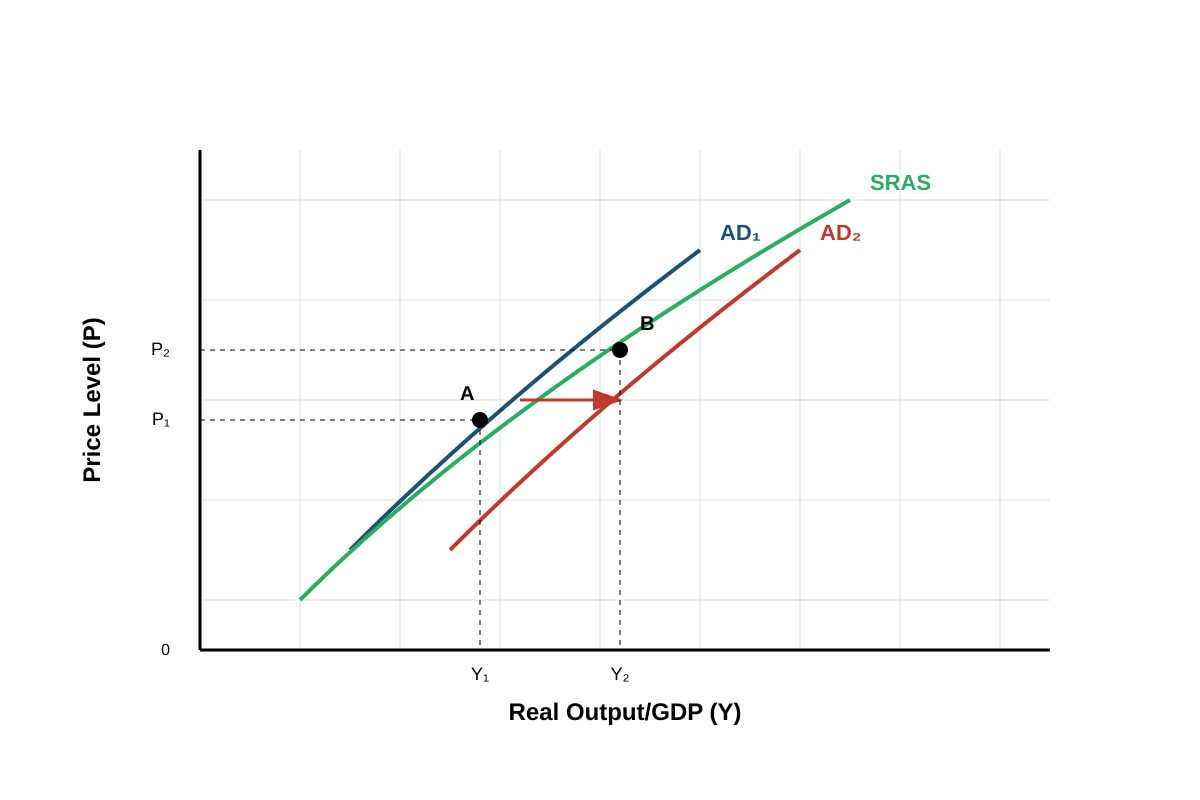
8. Using an AD/AS diagram, explain how an increase in exports might affect the price level and real output of an economy. (4 marks)
Answer:
Diagram (2 marks):
- Correctly drawn AD/AS diagram showing AD shifting rightward. (1 mark)
- Correctly labelled axes (Price Level and Real Output), curves (AD1, AD2, SRAS), and equilibrium points showing higher price level and higher output. (1 mark)
[Refer to the image_placeholder for Q8 — the diagram should show AD1 shifting right to AD2, with the new equilibrium at a higher price level (P2 > P1) and higher real output (Y2 > Y1).]
Explanation (2 marks):
- An increase in exports represents an increase in net exports (X − M), which is a component of aggregate demand (AD = C + I + G + X − M). (1 mark)
- This causes the AD curve to shift rightward from AD1 to AD2. The new equilibrium shows a higher real output (Y1 to Y2) and a higher price level (P1 to Y2), indicating economic growth accompanied by some inflationary pressure. (1 mark)
Teaching Note: Students must explicitly link exports to AD through the formula. The explanation should trace the cause-and-effect chain: higher exports → higher AD → rightward shift → higher output AND higher price level. If the economy has spare capacity (on the horizontal/flat portion of AS), the price level effect may be minimal.
Common Mistake: Forgetting to mention the price level change, or not explicitly stating that exports are a component of AD.
9. Explain the difference between the multiplier effect and the accelerator effect in macroeconomics. (4 marks)
Answer:
Multiplier Effect (2 marks):
- The multiplier effect refers to the process by which an initial injection of spending (e.g., government spending or investment) into the circular flow of income leads to a larger final increase in national income. (1 mark)
- This occurs because one person's spending becomes another person's income, and recipients spend a proportion of their additional income (determined by the MPC), creating successive rounds of spending. The size of the multiplier is given by k = 1/(1 − MPC) or k = 1/MPS. (1 mark)
Accelerator Effect (2 marks):
- The accelerator effect refers to the relationship between the rate of change of national income (or consumer demand) and the level of investment. It states that a change in the rate of growth of output/income induces a proportionally larger change in investment. (1 mark)
- For example, if consumer demand is growing rapidly, firms need to expand their capital stock to meet that demand, leading to a large increase in investment spending. Conversely, a slowdown in the rate of growth of demand can cause investment to fall sharply, even if demand is still rising. (1 mark)
Key Distinction: The multiplier shows how a change in spending causes a larger change in income (spending → income). The accelerator shows how a change in the rate of growth of income causes a change in investment (income growth → investment).
Teaching Note: These two concepts are frequently confused. The multiplier is about the magnification of an initial spending injection; the accelerator is about how changes in demand growth drive investment decisions.
10. A country has a marginal propensity to consume (MPC) of 0.75. The government increases spending by $200 million.
(a) Calculate the value of the multiplier. Show your working. (2 marks)
Answer:
- Multiplier (k) = 1 / (1 − MPC)
- k = 1 / (1 − 0.75)
- k = 1 / 0.25
- k = 4 (2 marks)
Marking: 1 mark for correct formula, 1 mark for correct answer.
(b) Calculate the total change in national income resulting from the government spending increase. Show your working. (2 marks)
Answer:
- Total change in national income = Multiplier × Initial change in government spending
- ΔY = k × ΔG
- ΔY = 4 × $200 million
- ΔY = $800 million (2 marks)
Marking: 1 mark for correct formula/method, 1 mark for correct answer.
Teaching Note: The multiplier formula is fundamental in macroeconomics. Students should understand that a higher MPC leads to a larger multiplier because more of each round of income is re-spent. Common errors include using MPC directly as the multiplier or using the wrong formula (e.g., 1/MPC instead of 1/(1−MPC)).
11. Explain two limitations of using GDP as a measure of standard of living. (4 marks)
Answer:
Limitation 1: GDP does not account for the distribution of income (2 marks)
- GDP measures total output or average income per capita, but it does not show how income is distributed among the population. A country may have a high GDP per capita, but if income is concentrated in the hands of a small elite, the majority of the population may still have a low standard of living. For example, two countries with identical GDP per capita may have very different levels of inequality, meaning the average figure masks significant differences in actual living standards. (1 mark for identification, 1 mark for explanation/development)
Limitation 2: GDP does not capture non-market activities and quality-of-life factors (2 marks)
- GDP only measures the value of goods and services traded in markets. It excludes unpaid work (e.g., housework, volunteer work), the underground economy, and environmental degradation. Additionally, GDP does not reflect factors such as leisure time, life expectancy, education quality, crime levels, or environmental quality — all of which significantly affect people's well-being. For instance, a country could have rising GDP but deteriorating air quality, which reduces the actual standard of living. (1 mark for identification, 1 mark for explanation/development)
Alternative acceptable limitations:
- GDP does not reflect the composition of output (e.g., spending on weapons vs. healthcare)
- GDP figures may be inaccurate in developing countries due to poor data collection
- Real GDP per capita is needed (not nominal) to make meaningful comparisons over time
- GDP does not account for population growth
12. Describe the main components of the circular flow of income and explain how a leakage affects the level of national income. (4 marks)
Answer:
Description of the circular flow (2 marks):
- In a simple two-sector economy, households provide factors of production (land, labour, capital, enterprise) to firms through factor markets, and in return receive factor incomes (rent, wages, interest, profit). (1 mark)
- Households then spend this income on goods and services produced by firms through product markets. This spending becomes revenue for firms, which they use to pay for factors of production, completing the circular flow. In the flow, there are injections (Investment, Government spending, Exports) and leakages (Savings, Taxation, Imports). (1 mark)
Explanation of how a leakage affects national income (2 marks):
- A leakage (withdrawal) is any income that is not passed on within the circular flow — savings (S), taxation (T), and imports (M). When households save part of their income instead of spending it, that money does not return to firms as revenue. (1 mark)
- This reduces the total spending in the economy, causing a multiplied contraction in national income through the reverse multiplier process. For example, if households increase savings, firms receive less revenue, reduce production, lay off workers, leading to lower incomes and further reductions in spending — a downward spiral. Equilibrium national income occurs where injections equal leakages (J = W, i.e., I + G + X = S + T + M). (1 mark)
Teaching Note: Students should understand that the circular flow is not a closed system — leakages reduce the flow while injections increase it. The equilibrium condition (J = W) is important for understanding how changes in any component affect national income.
13. Explain how a central bank might use monetary policy to reduce a high rate of inflation. Include reference to interest rates and the transmission mechanism. (5 marks)
Answer:
-
To reduce high inflation, the central bank would implement contractionary (tight) monetary policy by raising the policy interest rate (e.g., the central bank's benchmark lending rate). (1 mark)
-
Transmission mechanism:
- The central bank raises its policy rate, which increases commercial banks' cost of borrowing. Commercial banks pass this on to consumers and businesses through higher lending rates (mortgage rates, business loan rates, credit card rates). (1 mark)
- Higher interest rates increase the cost of borrowing and the reward for saving. This discourages consumer spending on credit (e.g., housing, durable goods) and reduces business investment in new projects. (1 mark)
- Higher interest rates may also attract foreign capital inflows, increasing demand for the domestic currency and causing the exchange rate to appreciate. This makes imports cheaper (reducing cost-push inflation) and exports more expensive (reducing demand further). (1 mark)
- The combined effect is a reduction in aggregate demand (C and I fall), which reduces the upward pressure on prices, thereby lowering the inflation rate. The economy moves toward a new equilibrium with lower inflation but potentially lower output and higher unemployment in the short run. (1 mark)
Teaching Note: The transmission mechanism is a chain of cause-and-effect that students must trace step by step. The key links are: policy rate → market interest rates → C and I → AD → price level. Students who skip steps or only mention "higher interest rates reduce spending" without explaining how will lose marks.
Common Mistake: Not mentioning the exchange rate channel, or confusing contractionary with expansionary monetary policy.
14. Distinguish between a current account deficit and a budget deficit. Explain whether a current account deficit is always a cause for concern for an economy. (5 marks)
Answer:
Distinction (2 marks):
- A current account deficit occurs when a country's total spending on imports of goods and services, income payments to foreign factors, and transfers exceed its total earnings from exports, income receipts, and transfers. It relates to the country's trade and income flows with the rest of the world. (1 mark)
- A budget deficit occurs when a government's total expenditure exceeds its total tax revenue in a given fiscal year. It relates to the government's fiscal position. (1 mark)
Explanation — Is a current account deficit always a concern? (3 marks):
It may NOT be a concern:
- A current account deficit may reflect strong domestic demand and economic growth, where the country is importing capital goods and raw materials to expand productive capacity. This can be beneficial for long-run growth. (1 mark)
- If the deficit is financed by sustainable long-term capital inflows (e.g., foreign direct investment), it is less problematic than if financed by short-term speculative capital. (1 mark)
It MAY be a concern:
- However, a persistent and large current account deficit may indicate that the country's industries are uncompetitive internationally, or that the country is living beyond its means, accumulating unsustainable levels of foreign debt. If foreign investors lose confidence, they may withdraw capital, causing a sharp depreciation of the currency and potentially a financial crisis. (1 mark)
Teaching Note: This is an evaluation question. Students must present both sides and reach a reasoned conclusion. The key insight is that the cause and sustainability of the deficit matter more than its existence alone.
Section C: Essay / Extended Response
15. "Supply-side policies are the most effective way to achieve sustained economic growth without causing inflation." Evaluate this statement. (8 marks)
Answer:
Knowledge & Understanding (AO1) — Up to 2 marks:
- Define supply-side policies: government policies aimed at increasing the productive capacity (aggregate supply) of the economy by improving the efficiency and quantity of factors of production. Examples include investment in education and training, tax cuts to incentivise work and investment, deregulation, privatisation, and infrastructure spending. (1 mark)
- Define sustained economic growth: a persistent increase in real GDP over time, represented by a rightward shift of the long-run aggregate supply (LRAS) curve. (1 mark)
Analysis (AO2) — Up to 3 marks:
- Explain how supply-side policies shift LRAS to the right, increasing potential output. For example, investment in education improves labour productivity, shifting LRAS rightward. This increases real output without putting upward pressure on the price level — in fact, it may reduce the price level if AS shifts right faster than AD. (1 mark)
- Contrast with demand-side policies: expansionary fiscal or monetary policy can increase AD and output in the short run, but if the economy is already near full employment, this primarily causes demand-pull inflation (movement along the upward-sloping AS curve) rather than sustainable real growth. (1 mark)
- Explain that supply-side policies can achieve non-inflationary growth because they expand the economy's capacity to produce, meaning more goods and services are available to meet demand. (1 mark)
Evaluation (AO3) — Up to 3 marks:
- Time lags: Supply-side policies often take many years to have a noticeable effect (e.g., education reforms may take a decade to improve workforce quality). In the short run, demand-side policies may be more effective at stimulating growth. (1 mark)
- Limitations of supply-side policies: Some supply-side policies (e.g., deregulation) may have negative side effects such as increased inequality or environmental damage. Tax cuts may increase inequality if they disproportionately benefit high earners. (1 mark)
- Conclusion: While supply-side policies are theoretically the best way to achieve sustained non-inflationary growth, in practice they work slowly and may need to be complemented by demand-side policies in the short run. The most effective approach is likely a combination of both, tailored to the specific economic context. (1 mark)
Marking Descriptors:
| Level | Marks | Descriptor |
|---|---|---|
| Level 3 | 6–8 | Well-structured answer with clear explanation of supply-side policies, detailed comparison with demand-side policies, and balanced evaluation with a reasoned conclusion. |
| Level 2 | 3–5 | Some explanation of supply-side policies and their effects, but limited evaluation or one-sided argument. |
| Level 1 | 1–2 | Basic knowledge shown but little analysis or evaluation. Lacks economic terminology. |
16. Evaluate the view that a government should always aim to balance its budget rather than run a budget deficit. (8 marks)
Answer:
Knowledge & Understanding (AO1) — Up to 2 marks:
- Define a balanced budget: government spending (G) equals tax revenue (T). A budget deficit occurs when G > T. (1 mark)
- Explain that governments finance deficits by borrowing (issuing bonds), which adds to the national debt. (1 mark)
Analysis (AO2) — Up to 3 marks:
- Case for balancing the budget: Persistent deficits accumulate into a large national debt, requiring increasing portions of government revenue to be spent on debt interest payments rather than productive public services. This crowds out future spending and may lead to higher taxes. High debt may also reduce investor confidence, leading to higher borrowing costs. (1 mark)
- Case against always balancing the budget: During a recession, tax revenues fall automatically while welfare spending rises (automatic stabilisers). Attempting to balance the budget through spending cuts or tax increases during a recession would reduce AD further, deepening the recession (pro-cyclical fiscal policy). Keynesian economics argues that deficit spending during downturns is necessary to stimulate demand and support the economy. (1 mark)
- Furthermore, if the government borrows to finance productive investment (e.g., infrastructure, education), the resulting increase in productive capacity can generate future economic growth and tax revenue, making the deficit self-financing in the long run. (1 mark)
Evaluation (AO3) — Up to 3 marks:
- The optimal fiscal approach depends on the state of the economy. During recessions, deficit spending is justified to support demand and prevent a deep downturn. During periods of strong growth, the government should aim to reduce deficits or achieve surpluses to build fiscal space for future downturns. (1 mark)
- The "always balance" view ignores the role of fiscal policy as a counter-cyclical tool. However, persistent structural deficits even during growth periods are unsustainable and may lead to a debt crisis. (1 mark)
- Conclusion: A balanced budget over the economic cycle (deficits in recessions, surpluses in booms) is a more pragmatic approach than always balancing the budget annually. The key is to ensure that any deficit incurred is sustainable and used productively. (1 mark)
Marking Descriptors:
| Level | Marks | Descriptor |
|---|---|---|
| Level 3 | 6–8 | Balanced discussion of both sides with clear economic reasoning, relevant examples, and a well-supported conclusion. |
| Level 2 | 3–5 | Some discussion of arguments for and against, but evaluation may be limited or one-sided. |
| Level 1 | 1–2 | Basic knowledge of budget deficits but little analysis or evaluation. |
17. Singapore has experienced a rising cost of living in recent years. Discuss whether the Singapore government should prioritise controlling inflation over achieving full employment. (8 marks)
Answer:
Knowledge & Understanding (AO1) — Up to 2 marks:
- Define inflation: a sustained increase in the general price level. Define full employment: a situation where all those willing and able to work at the prevailing wage rate are employed (exists at the natural rate of unemployment). (1 mark)
- Explain that Singapore is a small, open economy heavily dependent on imports for food, energy, and raw materials, making it particularly vulnerable to imported inflation. (1 mark)
Analysis (AO2) — Up to 3 marks:
- Case for prioritising inflation control: Rising cost of living erodes purchasing power, especially for lower-income households who spend a larger proportion of income on necessities. High inflation can lead to wage-price spirals, reduce Singapore's competitiveness as a business hub, and create uncertainty. The Monetary Authority of Singapore (MAS) manages the exchange rate (rather than interest rates) as its primary tool, allowing the SGD to appreciate to reduce imported inflation. (1 mark)
- Case for prioritising full employment: High unemployment means wasted human resources, lower output, lost tax revenue, and higher government spending on unemployment benefits. It also has social costs such as increased crime, mental health issues, and inequality. For Singapore, maintaining full employment is important for social cohesion and political stability. (1 mark)
- Trade-off: In the short run, there may be a trade-off between inflation and unemployment (Phillips Curve). Policies to reduce inflation (e.g., tightening monetary policy, allowing SGD appreciation) may reduce export competitiveness and increase unemployment. Conversely, policies to boost employment (e.g., fiscal stimulus) may increase inflationary pressure. (1 mark)
Evaluation (AO3) — Up to 3 marks:
- In Singapore's context, the trade-off may be less severe because the economy is highly open and flexible. Supply-side policies (e.g., retraining programmes, productivity improvements) can reduce the natural rate of unemployment without causing inflation. (1 mark)
- Given Singapore's heavy reliance on imports, controlling inflation may be more urgent because imported inflation is harder to manage through domestic policy alone. However, the government can use targeted measures (e.g., GST vouchers, ComCare) to protect low-income households from cost-of-living increases without abandoning employment objectives. (1 mark)
- Conclusion: Rather than strictly prioritising one over the other, the Singapore government should pursue a balanced approach using the exchange rate to manage inflation while implementing supply-side policies to maintain full employment. The two objectives are not always in conflict, especially in the long run. (1 mark)
Marking Descriptors:
| Level | Marks | Descriptor |
|---|---|---|
| Level 3 | 6–8 | Detailed discussion with Singapore-specific context, clear analysis of trade-offs, and a well-reasoned conclusion. |
| Level 2 | 3–5 | Some relevant analysis but limited Singapore context or weak evaluation. |
| Level 1 | 1–2 | General knowledge of inflation and unemployment but little application to Singapore. |
18. (a) Explain the causes of unemployment in an economy. (4 marks)
Answer:
- Cyclical (demand-deficient) unemployment: Caused by a fall in aggregate demand during an economic recession. When AD falls, firms reduce production and lay off workers. This is the most common cause of rising unemployment during downturns. (1 mark)
- Frictional unemployment: Occurs when workers are between jobs — searching for new employment or transitioning from one job to another. This is inevitable in a dynamic economy and is generally short-term. (1 mark)
- Structural unemployment: Caused by a mismatch between the skills of workers and the skills demanded by employers, often due to technological change or shifts in the structure of the economy (e.g., decline of manufacturing, rise of services). Workers may lack the skills needed for available jobs. (1 mark)
- Seasonal unemployment: Caused by regular seasonal fluctuations in demand for certain types of labour (e.g., tourism workers in off-season, agricultural workers after harvest). (1 mark)
Additional acceptable cause: Real wage (classical) unemployment — caused by wages being set above the equilibrium level (e.g., due to minimum wage laws or trade union power), leading to excess supply of labour.
(b) Evaluate the effectiveness of demand-side policies in reducing unemployment. (4 marks)
Answer:
Analysis (AO2) — Up to 2 marks:
- Demand-side policies (expansionary fiscal and monetary policy) aim to increase aggregate demand, which increases output and derived demand for labour, thereby reducing cyclical unemployment. For example, increased government spending directly creates jobs and, through the multiplier effect, generates further employment in the economy. (1 mark)
- Lower interest rates reduce borrowing costs, encouraging consumer spending and business investment, which increases AD and reduces unemployment. (1 mark)
Evaluation (AO3) — Up to 2 marks:
- Limitation 1: Demand-side policies are only effective against cyclical (demand-deficient) unemployment. They cannot address structural, frictional, or seasonal unemployment. If unemployment is primarily structural (e.g., due to technological change), increasing AD will not create jobs for workers who lack the necessary skills — it may instead cause inflation. (1 mark)
- Limitation 2: Expansionary demand-side policies may cause demand-pull inflation, especially if the economy is already near full employment. There are also time lags in implementation and effect. Additionally, if consumers and businesses are pessimistic (low confidence), lower interest rates may not stimulate spending (liquidity trap). (1 mark)
Conclusion: Demand-side policies are effective for reducing cyclical unemployment but must be complemented by supply-side policies to address structural unemployment for a comprehensive solution.
19. A small open economy is experiencing a significant fall in its exchange rate.
(a) Explain two possible causes of a fall in the exchange rate. (4 marks)
Answer:
Cause 1: Decrease in demand for the currency / Increase in supply of the currency (2 marks)
- If the country's exports become less competitive (e.g., due to higher domestic inflation compared to trading partners), foreign buyers demand fewer of the country's goods and therefore less of its currency. This reduces demand for the currency, causing the exchange rate to depreciate. Similarly, if domestic residents increase their demand for imports, they supply more of their domestic currency on the foreign exchange market, increasing supply and causing depreciation. (1 mark for cause, 1 mark for explanation)
Cause 2: Lower interest rates or capital outflows (2 marks)
- If the country's central bank lowers interest rates relative to other countries, the return on domestic financial assets falls. Foreign investors move their funds to countries with higher returns (capital outflow), reducing demand for the domestic currency and increasing its supply on forex markets, causing depreciation. Speculative activity can also cause a fall in the exchange rate if investors expect the currency to weaken. (1 mark for cause, 1 mark for explanation)
Alternative acceptable causes: Current account deficit, loss of investor confidence, expansionary monetary policy increasing money supply.
(b) Discuss the likely effects of a significant fall in the exchange rate on the economy. (4 marks)
Answer:
Positive effects (up to 2 marks):
- Improved export competitiveness: A weaker currency makes the country's exports cheaper for foreign buyers, increasing export demand. This boosts AD, increases output, and creates jobs in export industries. (1 mark)
- Reduced import demand: Imports become more expensive, encouraging domestic consumers and firms to switch to domestically produced substitutes (import substitution), further boosting domestic output and employment. (1 mark)
Negative effects (up to 2 marks):
- Imported inflation: A weaker currency makes imports more expensive, raising the cost of imported raw materials, components, and consumer goods. This increases cost-push inflation, reducing consumers' purchasing power and potentially eroding the competitive advantage gained from depreciation. (1 mark)
- Higher debt servicing costs: If the government or firms have borrowed in foreign currencies, a depreciation increases the domestic currency cost of servicing and repaying that debt, potentially leading to financial distress. It may also reduce foreign investor confidence, leading to further capital outflows. (1 mark)
Evaluation: The net effect depends on the elasticity of demand for exports and imports (Marshall-Lerner condition). If the sum of PED for exports and imports is greater than 1, the depreciation will improve the trade balance. However, in the short run, the J-curve effect may mean the trade balance initially worsens before improving.
20. "Economic growth inevitably leads to a more unequal distribution of income." Assess the extent to which you agree with this statement. (8 marks)
Answer:
Knowledge & Understanding (AO1) — Up to 2 marks:
- Define economic growth: an increase in real GDP over time (actual growth) or an increase in potential output (potential growth). (1 mark)
- Define income inequality: the unequal distribution of household or individual income across different groups in society, often measured by the Gini coefficient. (1 mark)
Analysis (AO2) — Up to 3 marks:
- How growth CAN increase inequality: Economic growth often benefits those with capital (owners of land, financial assets, businesses) more than those who rely on wages. As the economy grows, returns to capital tend to grow faster than wages (as argued by Piketty). Growth driven by technological change and globalisation tends to favour skilled workers over unskilled workers, widening the wage gap. In developing countries, growth may initially concentrate in urban areas or specific sectors, increasing the rural-urban divide. (1.5 marks)
- How growth does NOT inevitably increase inequality: Economic growth can reduce inequality if the government implements redistributive policies (progressive taxation, transfer payments, universal education and healthcare). Growth generates tax revenue that can be used to fund social programmes. The Kuznets Curve suggests that inequality may initially rise during early stages of development but falls as the economy matures and more people benefit from growth. Countries like South Korea achieved rapid growth while maintaining relatively low inequality. (1.5 marks)
Evaluation (AO3) — Up to 3 marks:
- The relationship between growth and inequality is not automatic — it depends on the type of growth, the structure of the economy, and government policies. Growth driven by labour-intensive sectors (e.g., manufacturing, services) tends to be more inclusive than growth driven by capital-intensive sectors or resource extraction. (1 mark)
- Government policy plays a crucial mediating role. Countries with strong social safety nets, progressive tax systems, and investment in public education (e.g., Nordic countries) have achieved both high growth and low inequality. Conversely, countries with weak institutions and corruption may see growth benefits captured by a small elite. (1 mark)
- Conclusion: Economic growth does not inevitably lead to greater inequality. While certain patterns of growth can exacerbate inequality, the outcome depends critically on the nature of growth and the policy framework. With appropriate redistributive policies, growth can be inclusive and even reduce inequality. (1 mark)
Marking Descriptors:
| Level | Marks | Descriptor |
|---|---|---|
| Level 3 | 6–8 | Comprehensive answer with clear explanation of both sides, use of economic theory (Kuznets Curve, Piketty), relevant examples, and a well-supported conclusion. |
| Level 2 | 3–5 | Some relevant analysis but may be one-sided or lack depth in evaluation. |
| Level 1 | 1–2 | Basic knowledge of growth and inequality but little analysis or evaluation. |
Free quiz and exam paper access
Enter your details to view this paper
Your access is remembered on this device.