A-Level Economics H1 Quiz - Macroeconomics
Name: ___________________________
Class: ___________________________
Date: ___________________________
Score: ___________ / 40
Duration: 60 minutes
Total Marks: 40
Topic: Macroeconomics (Theme 3: The National Economy)
Instructions:
- Answer all 20 questions.
- Section A: Data Interpretation (Questions 1–5)
- Section B: Structured Response (Questions 6–10)
- Section C: Diagram & Evaluation (Questions 11–20)
- Use diagrams where requested. Show working for calculation-based items.
- Marks are indicated at the end of each question.
Section A: Data Interpretation (15 marks)
1. With reference to Table 1, compare the real GDP growth rate of Economia and Rizal from 2019 to 2022. [2]
Table 1: Real GDP Growth Rate (%)
| Year | Economia | Rizal |
|---|
| 2019 | 3.2 | 2.8 |
| 2020 | -1.5 | 1.1 |
| 2021 | 4.0 | 3.5 |
| 2022 | 2.1 | 2.9 |
2. Describe the trend in the unemployment rate of Economia from 2019 to 2022 using Table 2. [2]
Table 2: Unemployment Rate (%)
| Year | Economia |
|---|
| 2019 | 4.0 |
| 2020 | 6.5 |
| 2021 | 5.2 |
| 2022 | 4.3 |
3. Using Table 3, compare the inflation rate in Economia and Rizal in 2021 and 2022. [2]
Table 3: Inflation Rate (%)
| Year | Economia | Rizal |
|---|
| 2021 | 1.2 | 2.0 |
| 2022 | 3.8 | 2.6 |
4. With reference to Extract A, explain one possible reason for the fall in private consumption expenditure in Economia in 2020. [2]
Extract A: "In 2020, Economia imposed strict border restrictions due to the pandemic. Many retail outlets were closed for three months, and household incomes fell as unemployment rose to 6.5%."
5. Using Table 4, calculate the percentage change in government spending from 2021 to 2022 for Economia. Show your working. [2]
Table 4: Government Spending ($ billion)
| Year | Economia |
|---|
| 2021 | 50.0 |
| 2022 | 53.0 |
6. Using Table 5, compare the current account balance of Economia and Rizal in 2022. [2]
Table 5: Current Account Balance (% of GDP)
| Year | Economia | Rizal |
|---|
| 2022 | +2.1 | -1.4 |
7. Describe the trend in Rizal's FDI inflows from 2019 to 2022 with reference to Table 6. [3]
Table 6: FDI Inflows ($ billion)
| Year | Rizal |
|---|
| 2019 | 10.2 |
| 2020 | 8.5 |
| 2021 | 12.0 |
| 2022 | 14.1 |
Section B: Structured Response (10 marks)
8. Identify two components of Aggregate Demand (AD) and explain how a rise in one of them could lead to higher national income. [3]
9. Explain how a decrease in interest rates may affect consumption (C) and investment (I) in an economy. [3]
10. State two macroeconomic policy objectives a government might pursue and explain why reducing unemployment may conflict with controlling inflation. [4]
Section C: Diagram & Evaluation (15 marks)
11. With reference to an AD/AS diagram, explain how a rise in government spending (G) affects equilibrium national income and price level in the short run. [3]
12. Using a PPC diagram, explain how a sustained increase in the labour force can lead to economic growth. [3]
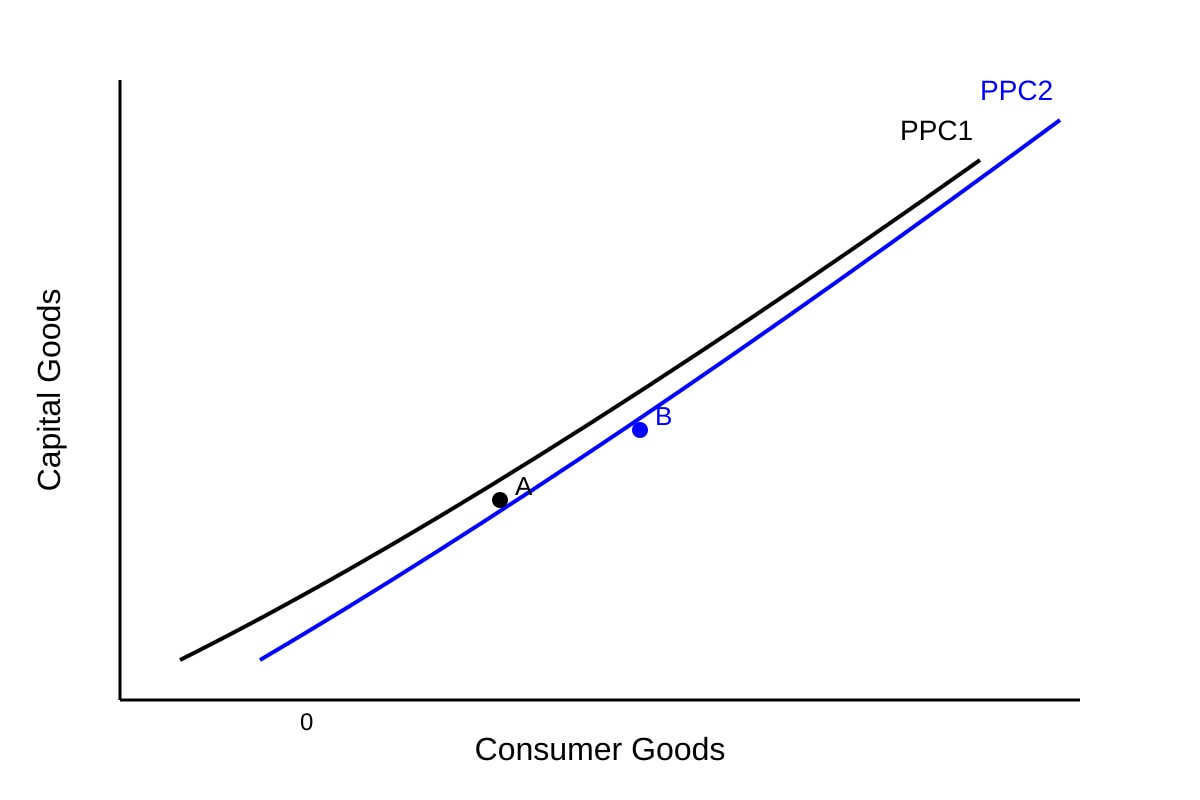
Generated diagram for Q12.
13. Explain two reasons why a government might use expansionary fiscal policy during a recession. [2]
14. Discuss whether a policy of increasing government spending is always effective in reducing unemployment. Use economic reasoning. [4]
15. Using an AD/AS diagram, explain how a negative supply shock (e.g., oil price rise) can cause cost-push inflation. [3]
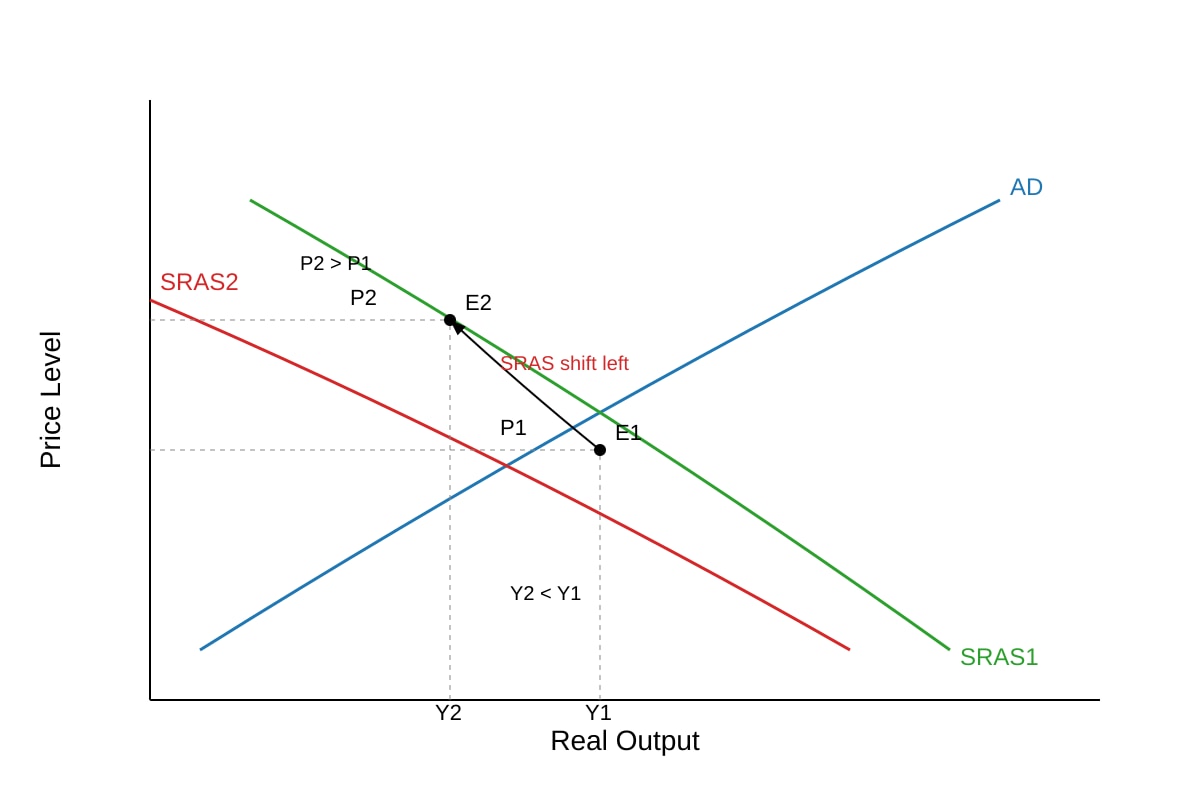
Generated diagram for Q15.
16. With reference to Extract B, explain how a strong exchange rate may reduce net exports (X–M). [2]
Extract B: "In 2022, Rizal's currency appreciated by 10% against major trading partners. Exports became more expensive overseas while imports grew cheaper domestically."
17. Compare the use of fiscal policy and monetary policy in achieving low inflation. [2]
18. Evaluate the view that economic growth measured by GDP always reflects an improvement in living standards. [3]
19. Using a PPC diagram, explain the concept of opportunity cost when an economy moves from producing more consumer goods to more capital goods. [2]
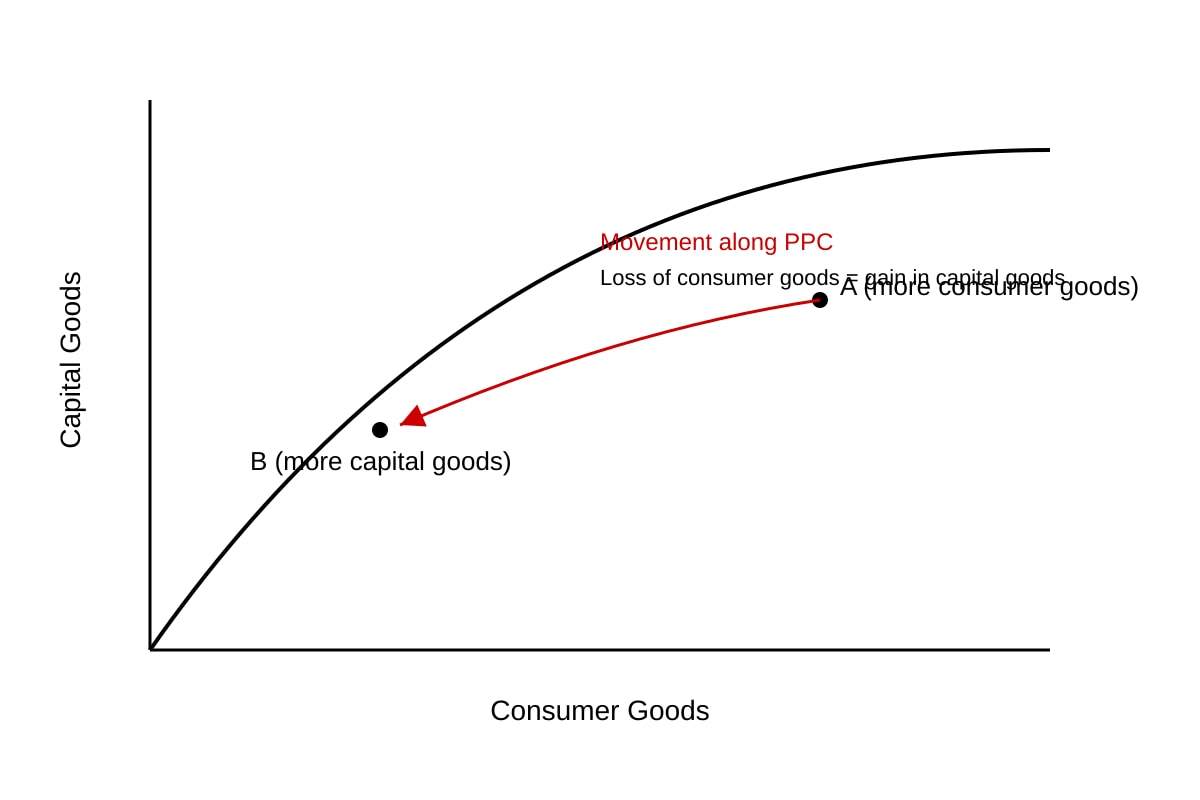
Generated diagram for Q19.
20. Discuss whether a country should prioritise low inflation over low unemployment when formulating macroeconomic policy. [3]
</stage3_quiz_answers_md>
A-Level Economics H1 Quiz - Macroeconomics: Answer Key
Total Marks: 40
Topic: Macroeconomics
Section A: Data Interpretation
Q1. [2 marks]
Compare real GDP growth: Economia and Rizal.
- Both experienced a fall in 2020 (Economia -1.5%, Rizal 1.1% positive but slowed). Economia contracted; Rizal slowed.
- From 2019–2022, Economia grew at 3.2→-1.5→4.0→2.1; Rizal at 2.8→1.1→3.5→2.9. Rizal more stable, no negative except 2020 dip.
Marking: 1 mark for correct values comparison, 1 mark for comparative language ("whereas", "both").
Teaching note: Real GDP growth shows output change. Compare direction and magnitude. Common mistake: stating only one country.
Q2. [2 marks]
Trend: Unemployment rose sharply from 4.0% (2019) to 6.5% (2020), then fell to 5.2% (2021) and 4.3% (2022). Overall it increased then decreased but remained above 2019 by 2022.
Marking: 1 mark direction (rise then fall), 1 mark reference to years/values.
Teaching note: Describe start, peak, end. Avoid saying "stable".
Q3. [2 marks]
In 2021 Economia (1.2) lower than Rizal (2.0); in 2022 Economia (3.8) higher than Rizal (2.6). Inflation converged differently: Economia rose faster.
Marking: 1 mark each year comparison.
Teaching note: Inflation = persistent price rise. Compare levels and change.
Q4. [2 marks]
Border restrictions closed outlets → consumption fell; unemployment rose → incomes fell → less spending.
Marking: 1 mark extract link, 1 mark reasoning (income/closure).
Teaching note: C falls when income drops or shops close.
Q5. [2 marks]
% change = (53.0 - 50.0)/50.0 × 100 = 3.0/50.0 × 100 = 6.0%.
Working shown = 2 marks (1 calc, 1 answer).
Teaching note: %Δ = (new-old)/old ×100.
Q6. [2 marks]
Economia surplus +2.1% GDP; Rizal deficit -1.4% GDP. Economia exports>imports; Rizal opposite.
Marking: 1 mark each country described.
Q7. [3 marks]
FDI fell 10.2→8.5 (2020 dip), then rose to 12.0 (2021), 14.1 (2022). Overall upward trend after 2020.
Marking: 1 direction, 1 turning point, 1 values.
Teaching note: Trend = general direction with reference to data.
Section B: Structured Response
Q8. [3 marks]
Components: C, I, G, (X-M). E.g. rise in G → AD↑ → firms produce more → income↑ via multiplier.
Marking: 2 components (1), explanation (2).
Teaching note: AD = C+I+G+(X-M). Multiplier effect.
Q9. [3 marks]
Lower rates → cheaper loans → C↑ (durables), I↑ (capital).
Marking: C effect (1.5), I effect (1.5).
Teaching note: Interest rate is cost of borrowing.
Q10. [4 marks]
Objectives: low unemployment, low inflation, growth, surplus. Conflict: expansion to cut unemployment may raise AD→inflation.
Marking: 2 objectives (2), conflict explanation (2).
Teaching note: Trade-off shown by Phillips curve concept (not required formula).
Section C: Diagram & Evaluation
Q11. [3 marks]
AD↑ (G↑) → new eqm higher Y and P. Diagram: AD right.
Marking: diagram shift (1), Y↑ (1), P↑ (1).
Teaching note: Keynesian short-run: prices flexible.
Q12. [3 marks]
PPC shifts out; more of both goods possible. Labour↑ → capacity↑.
Marking: PPC shift shown (1), reason (1), growth defined (1).
Teaching note: PPC shows max output. Shift = growth.
Q13. [2 marks]
(1) Boost AD → jobs; (2) Fill deflation gap.
Marking: 1 each.
Q14. [4 marks]
Yes: AD↑→firms hire. No: if structural unemp, or crowding-out, or inflation.
Marking: for (2) against (2).
Teaching note: Evaluation = conditions matter.
Q15. [3 marks]
SRAS left → P↑ Y↓ = stagflation. Diagram required.
Marking: shift (1), P↑ (1), Y↓ (1).
Q16. [2 marks]
Appreciation → X dear, M cheap → X↓ M↑ → net exports fall.
Marking: mechanism (2).
Q17. [2 marks]
Fiscal: tax↑/spend↓; Monetary: rate↑. Both reduce AD.
Marking: 1 each.
Q18. [3 marks]
GDP↑ may miss inequality, environment, leisure. Not always better living.
Marking: define (1), limit (1), conclude (1).
Q19. [2 marks]
Move A→B: more capital = less consumer. OC = consumer goods given up.
Marking: diagram (1), OC explained (1).
Q20. [3 marks]
Depends on shock, expectations. Prioritise based on context.
Marking: both sides (2), judgement (1).
</stage3_quiz_answers_md>
<stage3_quiz_md>
A-Level Economics H1 Quiz - Macroeconomics
Name: ___________________________
Class: ___________________________
Date: ___________________________
Score: ___________ / 40
Duration: 60 minutes
Total Marks: 40
Topic: Macroeconomics (Theme 3: The National Economy)
Instructions:
- Answer all 20 questions.
- Section A: Data Interpretation (Questions 1–5)
- Section B: Structured Response (Questions 6–10)
- Section C: Diagram & Evaluation (Questions 11–20)
- Use diagrams where requested. Show working for calculation-based items.
- Marks are indicated at the end of each question.
Section A: Data Interpretation (15 marks)
1. With reference to Table 1, compare the real GDP growth rate of Economia and Rizal from 2019 to 2022. [2]
Table 1: Real GDP Growth Rate (%)
| Year | Economia | Rizal |
|---|
| 2019 | 3.2 | 2.8 |
| 2020 | -1.5 | 1.1 |
| 2021 | 4.0 | 3.5 |
| 2022 | 2.1 | 2.9 |
2. Describe the trend in the unemployment rate of Economia from 2019 to 2022 using Table 2. [2]
Table 2: Unemployment Rate (%)
| Year | Economia |
|---|
| 2019 | 4.0 |
| 2020 | 6.5 |
| 2021 | 5.2 |
| 2022 | 4.3 |
3. Using Table 3, compare the inflation rate in Economia and Rizal in 2021 and 2022. [2]
Table 3: Inflation Rate (%)
| Year | Economia | Rizal |
|---|
| 2021 | 1.2 | 2.0 |
| 2022 | 3.8 | 2.6 |
4. With reference to Extract A, explain one possible reason for the fall in private consumption expenditure in Economia in 2020. [2]
Extract A: "In 2020, Economia imposed strict border restrictions due to the pandemic. Many retail outlets were closed for three months, and household incomes fell as unemployment rose to 6.5%."
5. Using Table 4, calculate the percentage change in government spending from 2021 to 2022 for Economia. Show your working. [2]
Table 4: Government Spending ($ billion)
| Year | Economia |
|---|
| 2021 | 50.0 |
| 2022 | 53.0 |
6. Using Table 5, compare the current account balance of Economia and Rizal in 2022. [2]
Table 5: Current Account Balance (% of GDP)
| Year | Economia | Rizal |
|---|
| 2022 | +2.1 | -1.4 |
7. Describe the trend in Rizal's FDI inflows from 2019 to 2022 with reference to Table 6. [3]
Table 6: FDI Inflows ($ billion)
| Year | Rizal |
|---|
| 2019 | 10.2 |
| 2020 | 8.5 |
| 2021 | 12.0 |
| 2022 | 14.1 |
Section B: Structured Response (10 marks)
8. Identify two components of Aggregate Demand (AD) and explain how a rise in one of them could lead to higher national income. [3]
9. Explain how a decrease in interest rates may affect consumption (C) and investment (I) in an economy. [3]
10. State two macroeconomic policy objectives a government might pursue and explain why reducing unemployment may conflict with controlling inflation. [4]
Section C: Diagram & Evaluation (15 marks)
11. With reference to an AD/AS diagram, explain how a rise in government spending (G) affects equilibrium national income and price level in the short run. [3]
12. Using a PPC diagram, explain how a sustained increase in the labour force can lead to economic growth. [3]
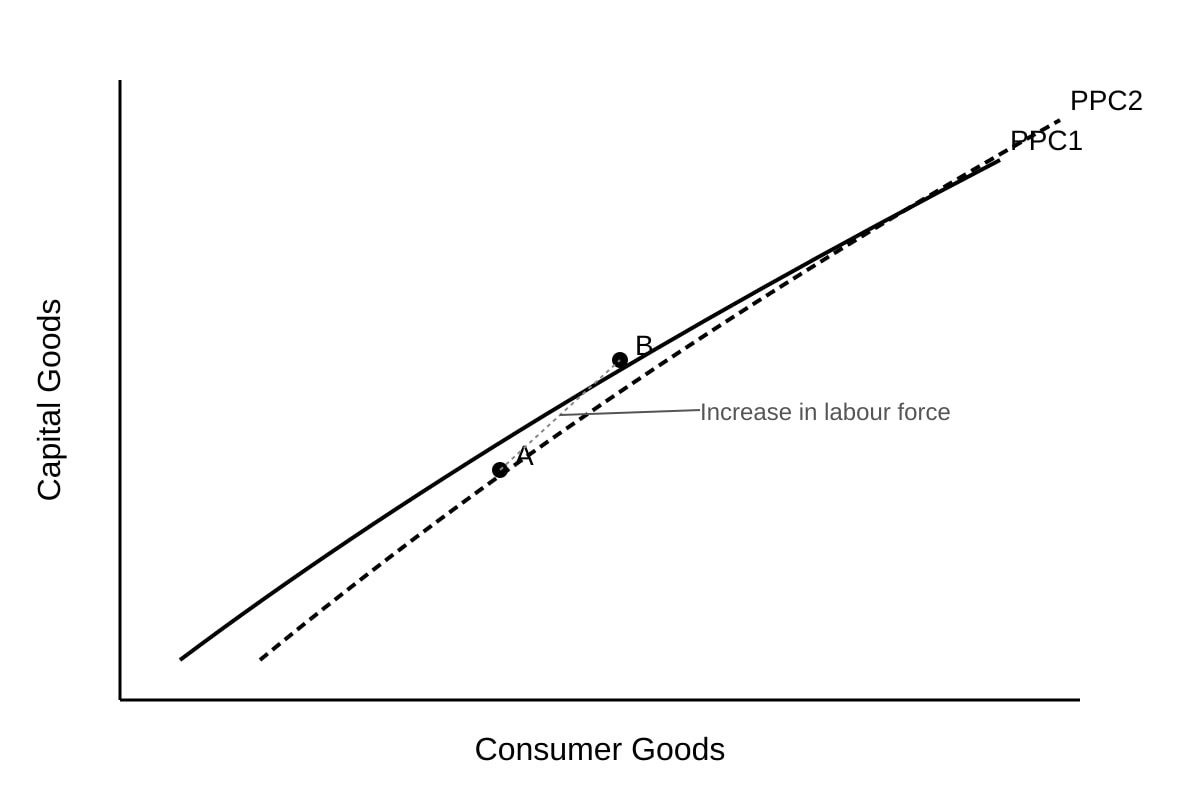
Generated diagram for Q12.
13. Explain two reasons why a government might use expansionary fiscal policy during a recession. [2]
14. Discuss whether a policy of increasing government spending is always effective in reducing unemployment. Use economic reasoning. [4]
15. Using an AD/AS diagram, explain how a negative supply shock (e.g., oil price rise) can cause cost-push inflation. [3]
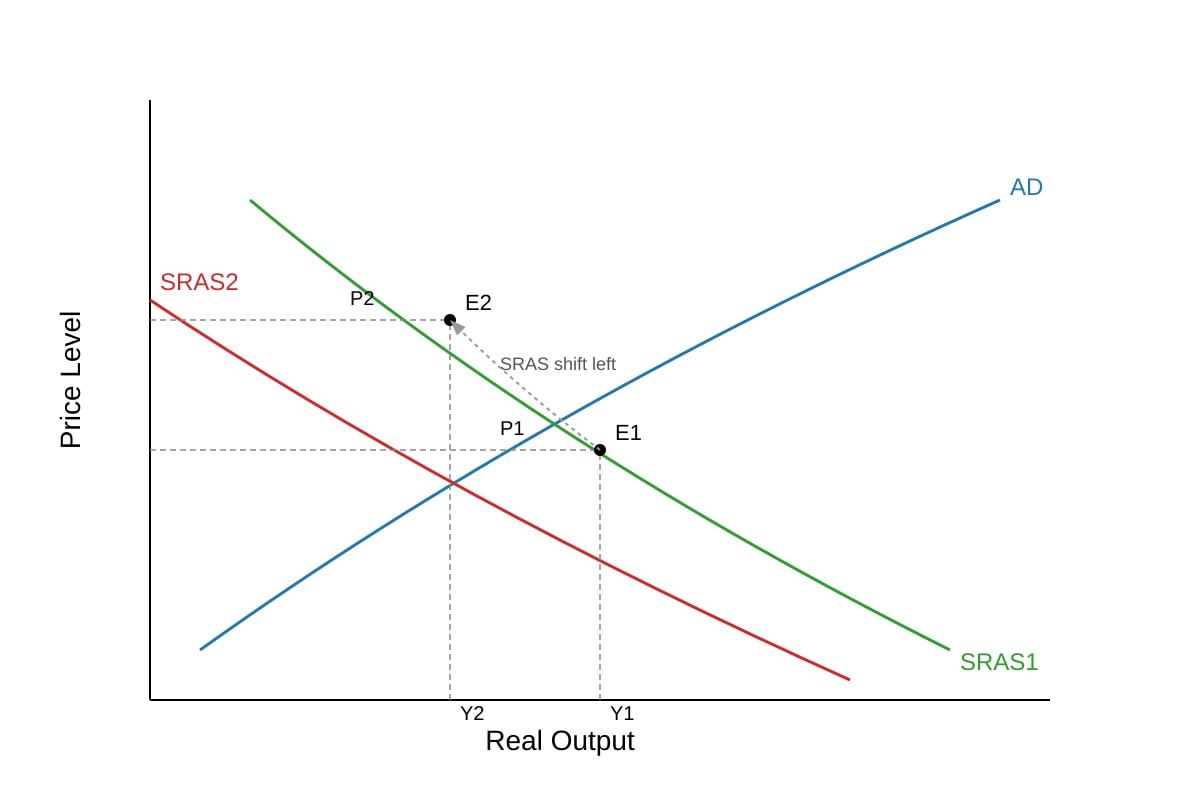
Generated diagram for Q15.
16. With reference to Extract B, explain how a strong exchange rate may reduce net exports (X–M). [2]
Extract B: "In 2022, Rizal's currency appreciated by 10% against major trading partners. Exports became more expensive overseas while imports grew cheaper domestically."
17. Compare the use of fiscal policy and monetary policy in achieving low inflation. [2]
18. Evaluate the view that economic growth measured by GDP always reflects an improvement in living standards. [3]
19. Using a PPC diagram, explain the concept of opportunity cost when an economy moves from producing more consumer goods to more capital goods. [2]
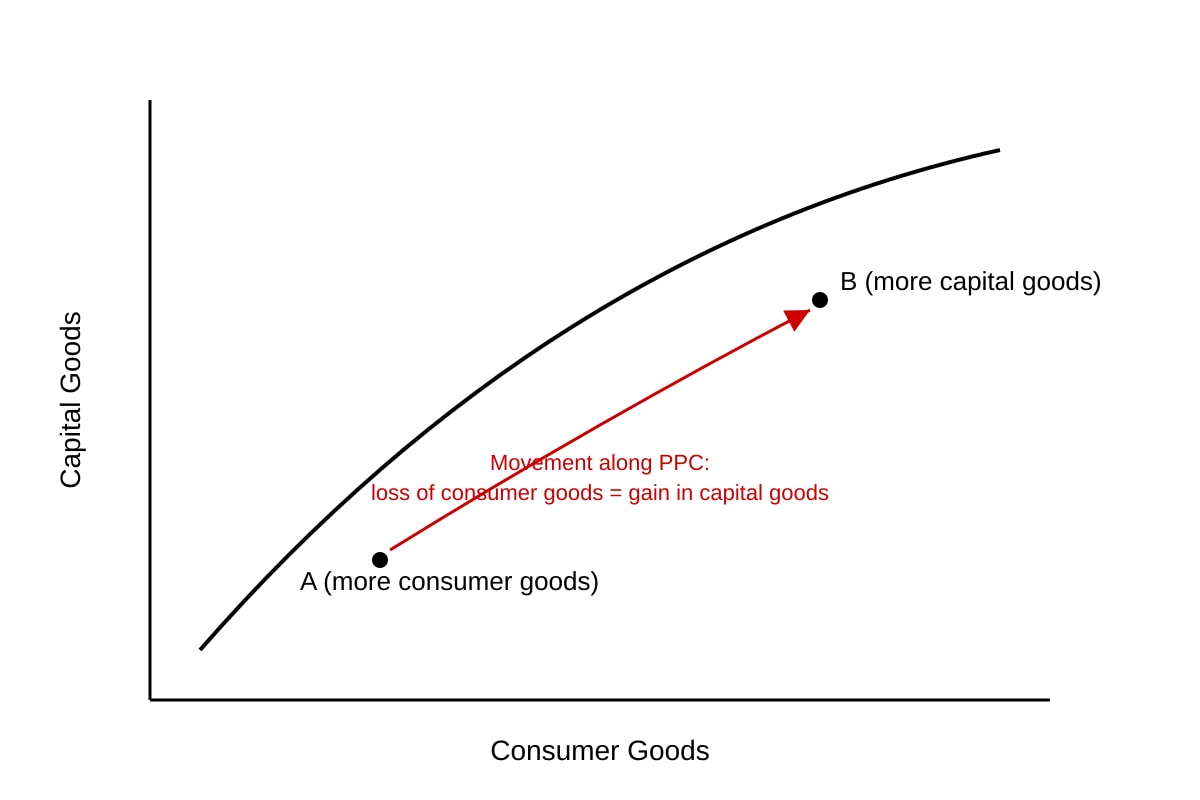
Generated diagram for Q19.
20. Discuss whether a country should prioritise low inflation over low unemployment when formulating macroeconomic policy. [3]