From Real Exams Quiz
A Level H1 Economics International Economics Quiz
Free A Level H1 Econs International Economics quiz, HY3 Exam version, with questions, answers, and A Level-style practice for Singapore students.
These static practice materials are generated from the site's syllabus and paper-generation workflow, with source and model context shown so students and parents can evaluate the material before use.
Questions
Free quiz and exam paper access
Enter your details to view this paper
Your access is remembered on this device.
Answers
A-Level Economics H1 Quiz - International Economics: Answer Key
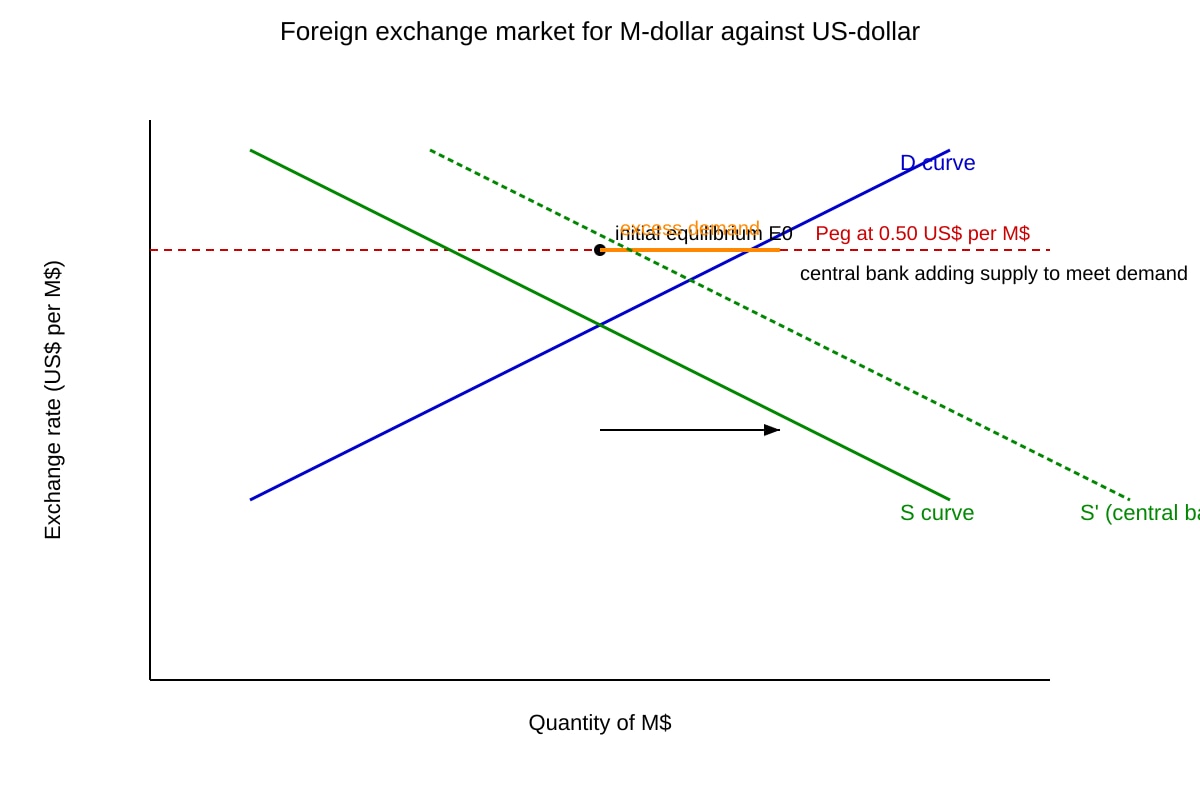
Total Marks: 40
Topic: International Economics
Section A: Data and Concept Interpretation
Q1. [2 marks]
- Both Country A and Country B increased merchandise exports from 2019 to 2023. [1]
- Country A rose from 268bn (increase of 145bn to 45bn); Country A had higher exports and grew more in absolute terms. [1]
Teaching note: Compare both values and direction. Common mistake: stating only one country.
Q2. [2 marks]
- Country A's current account balance improved from a deficit of -2.1% of GDP in 2020 to a surplus of +0.3% in 2023. [1]
- The trend was a steady narrowing of deficit then surplus from 2021 to 2023. [1]
Teaching note: Describe direction and turning point (deficit to surplus).
Q3. [2 marks]
- Economy Y had consistently higher inflation than Economy X in all three years. [1]
- Both increased from 2021 to 2022, but Economy Y fell slightly in 2023 while X continued rising. [1]
Teaching note: Use comparative language; note divergence in 2023.
Q4. [2 marks]
Any two: protect domestic industries from foreign competition; raise government revenue; correct trade deficit; retaliate against unfair trade practices. [1+1]
Teaching note: Do not accept "to reduce exports" (wrong direction).
Q5. [2 marks]
- Terms of trade = (Export Price Index / Import Price Index) × 100. [1]
- It measures the relative price of a country's exports compared to its imports. [1]
Teaching note: Definition and formula required.
Section B: Source-Based Structured Response
Q6. [2 marks]
Tariff per car = 15% × 3,750.
Imports after tariff = 35,000 units.
Revenue = 35,000 × 131,250,000 (US$131.25 million). [2]
Working: Show % calc and multiplication.
Q7. [3 marks]
- Domestic producers: benefit from higher price and increased sales (40k → 58k). [1]
- Foreign exporters: face reduced demand (60k → 35k) and lower revenue. [1]
- Consumers in Nation Z face higher prices. [1]
Marking: 1 mark each group effect.
Q8. [3 marks]
- Diagram: D and S for cars; tariff shifts S upward by tariff amount (or tax wedge). [1]
- Equilibrium Q falls from 100k (60+40) to 93k (35+58). [1]
- Price to consumers rises. [1]
Teaching note: Show tariff as supply shift or wedge.
Q9. [4 marks]
For: protects jobs, develops industry, revenue. [2]
Against: higher prices for consumers, less choice, inefficiency, possible retaliation. [2]
Marking descriptors: 2 marks for one side, 4 for balanced with evaluation.
Q10. [2 marks]
- Surge in imports increased demand for foreign currency (US$). [1]
- At fixed rate, supply of US$ from exports insufficient. [1]
Q11. [2 marks]
- Central bank sold US$ reserves to supply market. [1]
- Reserves decreased. [1]
Q12. [3 marks]
- Diagram shows D > S at peg → excess demand. [1]
- Central bank supplies US$ shifting S right. [1]
- Maintains peg, reserves fall. [1]
Image requirement: Graph with peg line, excess demand gap, S shift.
Q13. [4 marks]
- Not sustainable if reserves depleted. [2]
- Requires constant intervention; loss of reserves limits defense. [2]
Evaluation needed for full marks.
Section C: Diagram, Evaluation and Synthesis
Q14. [3 marks]
- PPC drawn with exports on one axis. [1]
- Outward shift / reallocation toward export goods. [1]
- Shows gains from specialisation. [1]
Q15. [3 marks]
- Appreciation makes exports more expensive foreign → X falls. [1]
- Imports cheaper → M rises. [1]
- Net exports fall, AD affected. [1]
Q16. [3 marks]
- AD shifts right due to higher X. [1]
- Real national income rises. [1]
- Diagram with AD/AS. [1]
Q17. [3 marks]
- Both raise domestic price. [1]
- Quota limits Q directly; tariff reduces Q via price. [1]
- Tariff yields revenue; quota may not. [1]
Q18. [4 marks]
- For: efficiency, lower prices, growth. [2]
- Against: losers in import-competing sectors, inequality. [2]
Q19. [3 marks]
ToT 2023 = (130 / 115) × 100 = 113.04. [2 for calc, 1 for stating index]
Working: 130÷115=1.1304×100.
Q20. [4 marks]
- Globalisation transmits inflation via imports. [2]
- But also increases competition lowering prices. [2]
Evaluation required.