AI Generated Exam Paper
A Level H1 Economics Practice Paper 5
Free A Level H1 Econs Practice Paper 5, LongCat AI version, with questions, answers, and A Level-style practice for Singapore students.
These static practice materials are generated from the site's syllabus and paper-generation workflow, with source and model context shown so students and parents can evaluate the material before use.
Questions
TuitionGoWhere Practice Paper - Economics H1 A-Level
TuitionGoWhere Practice Paper (AI)
Subject: Economics H1
Level: A-Level
Paper: Practice Paper (Data Response Focus)
Version: 5 of 5
Duration: 2 hours 30 minutes
Total Marks: 80
Name: ___________________________
Class: ___________________________
Date: ___________________________
Instructions
- Answer all questions in the spaces provided.
- Read each case study carefully before attempting the questions.
- Use economic terminology precisely.
- Show all working for calculation questions.
- Where diagrams are required, draw them clearly and label all axes, curves, and equilibrium points.
- For evaluation questions, consider multiple perspectives before reaching a reasoned conclusion.
Case Study A: The Singapore Digital Economy
Read the following source material and answer Questions 1–10.
Source 1: Singapore's Digital Economy Indicators
Singapore has been actively pursuing digital transformation across its economy. The following table shows key indicators of Singapore's digital economy performance from 2019 to 2023.
Table 1: Singapore Digital Economy Indicators (2019–2023)
| Indicator | 2019 | 2020 | 2021 | 2022 | 2023 |
|---|---|---|---|---|---|
| E-commerce revenue (S$ billion) | 5.2 | 8.1 | 9.8 | 11.2 | 12.5 |
| Digital services exports (S$ billion) | 32.4 | 35.1 | 42.6 | 48.3 | 52.1 |
| ICT workforce (thousands) | 155 | 162 | 178 | 195 | 210 |
| Digital economy share of GDP (%) | 13.0 | 14.8 | 16.2 | 17.5 | 18.4 |
Source: Infocomm Media Development Authority (IMDA), 2024
Source 2: Government Digitalisation Initiatives
The Singapore Government has implemented several policies to accelerate digital adoption. The SMEs Go Digital programme, launched in 2017, provides subsidies of up to 70% for small and medium enterprises adopting pre-approved digital solutions. The Digital Resilience Bonus, introduced in 2020, offers additional support to firms that adopt advanced cybersecurity measures and e-payment systems.
In 2022, the Government announced the Singapore Digital Economy Framework for Action, targeting a digital economy contribution of 30% of GDP by 2030. This framework emphasises three pillars: (1) digital infrastructure development, (2) workforce upskilling, and (3) regulatory innovation to support emerging technologies such as artificial intelligence and blockchain.
However, critics argue that the rapid pace of digitalisation may widen the income gap, as lower-skilled workers face displacement while higher-skilled workers capture most of the gains. The Government has responded by expanding the SkillsFuture programme, which provides credits for mid-career workers to reskill.
Source 3: Comparative Digital Economy Data
Table 2: Digital Economy Share of GDP (%) – Selected Economies (2019–2023)
| Economy | 2019 | 2020 | 2021 | 2022 | 2023 |
|---|---|---|---|---|---|
| Singapore | 13.0 | 14.8 | 16.2 | 17.5 | 18.4 |
| South Korea | 10.5 | 12.1 | 13.8 | 14.9 | 15.7 |
| United Kingdom | 11.2 | 12.8 | 14.0 | 15.1 | 15.9 |
| Malaysia | 8.4 | 9.6 | 10.8 | 11.9 | 12.8 |
Source: OECD Digital Economy Outlook, 2024
Section A: Data Response Questions (Case Study A)
Question 1
With reference to Table 1, compare the e-commerce revenue and digital services exports in Singapore from 2019 to 2023.
(4 marks)
Question 2
With reference to Table 1, describe the trend in the ICT workforce from 2019 to 2023. Calculate the percentage increase over this period.
(3 marks)
Question 3
With reference to Table 2, compare the digital economy share of GDP between Singapore and Malaysia from 2019 to 2023.
(4 marks)
Question 4
Using the data in Table 2, identify which economy experienced the largest percentage point increase in digital economy share of GDP from 2019 to 2023. Show your working.
(3 marks)
Question 5
Explain one possible reason why Singapore's digital economy share of GDP is consistently higher than Malaysia's, as shown in Table 2.
(3 marks)
Question 6
With reference to Source 2, identify two government policies aimed at promoting digitalisation in Singapore.
(2 marks)
Question 7
Using a demand and supply diagram, illustrate and explain how the Government's subsidy for SMEs adopting digital solutions might affect the market for digital services in Singapore.
(5 marks)
Generated diagram for Q7.
Question 8
Explain how the expansion of the SkillsFuture programme might help address the concern about income inequality arising from digitalisation, as mentioned in Source 2.
(4 marks)
Question 9
Discuss whether the Government's target of achieving a 30% digital economy contribution to GDP by 2030 is realistic, using evidence from the case study.
(6 marks)
Question 10
Evaluate the effectiveness of government subsidies (such as the SMEs Go Digital programme) as a policy tool to promote digitalisation in Singapore.
(6 marks)
Case Study B: Inflation and Monetary Policy in Singapore
Read the following source material and answer Questions 11–20.
Source 4: Singapore's Inflation Trends
Singapore experienced a significant rise in inflation from 2021 to 2023, driven by both global and domestic factors. The following table shows key inflation indicators.
Table 3: Singapore Inflation Indicators (2019–2023)
| Indicator | 2019 | 2020 | 2021 | 2022 | 2023 |
|---|---|---|---|---|---|
| CPI All Items (Index, 2019=100) | 100.0 | 99.8 | 102.1 | 108.4 | 113.2 |
| MAS Core Inflation (%) | 1.0 | -0.2 | 0.9 | 4.1 | 4.2 |
| Global oil price (US$/barrel) | 64 | 42 | 71 | 94 | 82 |
| Import price index (2019=100) | 100.0 | 95.3 | 104.8 | 118.6 | 114.2 |
Source: Department of Statistics Singapore, Monetary Authority of Singapore, 2024
Source 5: Monetary Policy Response
The Monetary Authority of Singapore (MAS) manages monetary policy through the Singapore dollar nominal effective exchange rate (S$NEER), rather than through interest rates. In response to rising inflation, MAS tightened monetary policy in October 2021, April 2022, October 2022, and January 2023 by allowing a stronger appreciation of the Singapore dollar.
A stronger Singapore dollar makes imports cheaper in domestic currency terms, helping to reduce imported inflation. However, it also makes Singapore's exports more expensive for foreign buyers, potentially reducing export competitiveness. The trade-off between controlling inflation and maintaining export competitiveness is a key consideration for MAS.
Economists have noted that Singapore's inflation in 2022–2023 was largely imported in nature, stemming from global supply chain disruptions, the Russia-Ukraine conflict, and rising energy prices. Domestic factors, including a tight labour market and rising wages, also contributed to cost-push inflation pressures.
Source 6: Comparative Inflation Data
Table 4: CPI Inflation Rate (%) – Selected Economies (2020–2023)
| Economy | 2020 | 2021 | 2022 | 2023 |
|---|---|---|---|---|
| Singapore | -0.2 | 2.3 | 6.1 | 4.8 |
| United States | 1.2 | 4.7 | 8.0 | 4.1 |
| Eurozone | 0.3 | 2.6 | 8.4 | 5.4 |
| Japan | 0.0 | -0.2 | 2.5 | 3.3 |
Source: International Monetary Fund, World Economic Outlook, 2024
Section B: Data Response Questions (Case Study B)
Question 11
With reference to Table 3, compare the MAS Core Inflation rate and the global oil price from 2020 to 2023.
(4 marks)
Question 12
Using the data in Table 3, calculate the percentage increase in the CPI All Items index from 2021 to 2023. Show your working.
(3 marks)
Question 13
With reference to Table 4, compare the inflation experience of Singapore and the United States from 2020 to 2023.
(4 marks)
Question 14
Explain how a rise in global oil prices, as shown in Table 3, could lead to cost-push inflation in Singapore.
(4 marks)
Question 15
Using an AD/AS diagram, illustrate and explain the effect of a stronger Singapore dollar on the price level and real output in Singapore.
(5 marks)
Generated diagram for Q15.
Question 16
With reference to Source 5, explain why MAS uses the exchange rate rather than interest rates as its primary monetary policy tool.
(3 marks)
Question 17
Identify one domestic factor and one global factor that contributed to Singapore's inflation in 2022–2023, as mentioned in Source 5.
(2 marks)
Question 18
Explain how a tight labour market could contribute to inflation in Singapore.
(4 marks)
Question 19
Discuss whether MAS's policy of allowing the Singapore dollar to appreciate is an effective way to control inflation in Singapore.
(6 marks)
Question 20
Evaluate the trade-off between controlling inflation and maintaining export competitiveness in the context of Singapore's exchange rate policy.
(6 marks)
End of Practice Paper
Mark Summary
| Section | Questions | Marks |
|---|---|---|
| Section A (Case Study A) | Q1–Q10 | 40 |
| Section B (Case Study B) | Q11–Q20 | 40 |
| Total | 20 questions | 80 marks |
Answers
TuitionGoWhere Practice Paper - Economics H1 A-Level
Answer Key and Marking Scheme
Subject: Economics H1
Paper: Practice Paper (Data Response Focus)
Version: 5 of 5
Total Marks: 80
Section A: Case Study A — The Singapore Digital Economy
Question 1
With reference to Table 1, compare the e-commerce revenue and digital services exports in Singapore from 2019 to 2023. (4 marks)
Answer:
Both e-commerce revenue and digital services exports increased from 2019 to 2023 [1 mark for identifying the common trend].
- E-commerce revenue rose from S5.2billionin2019toS12.5 billion in 2023, an increase of approximately 140% (or more than doubling) [1 mark].
- Digital services exports rose from S32.4billionin2019toS52.1 billion in 2023, an increase of approximately 61% [1 mark].
Digital services exports were consistently larger in absolute terms than e-commerce revenue throughout the period, but e-commerce revenue grew at a faster rate [1 mark for comparative analysis].
Marking Notes:
- 1 mark for stating both increased.
- 1 mark for correct data reference for e-commerce.
- 1 mark for correct data reference for digital services exports.
- 1 mark for a valid comparative point (e.g., one grew faster, or one was larger in absolute terms).
- Students must use comparative language ("both," "whereas," "in contrast," "faster rate") to earn full marks.
Question 2
With reference to Table 1, describe the trend in the ICT workforce from 2019 to 2023. Calculate the percentage increase over this period. (3 marks)
Answer:
The ICT workforce in Singapore showed a consistent upward trend from 155,000 in 2019 to 210,000 in 2023 [1 mark for describing the trend].
Calculation of percentage increase:
Percentage increase=155,000210,000−155,000×100=155,00055,000×100≈35.5%
[1 mark for correct method/formula, 1 mark for correct answer of approximately 35.5%]
Marking Notes:
- The trend description must note the consistent increase.
- Accept answers in the range 35%–36% depending on rounding.
- Award the method mark even if the final answer is incorrect, provided the formula is correct.
Question 3
With reference to Table 2, compare the digital economy share of GDP between Singapore and Malaysia from 2019 to 2023. (4 marks)
Answer:
Both Singapore and Malaysia experienced an increase in their digital economy share of GDP from 2019 to 2023 [1 mark for identifying the common trend].
- Singapore's digital economy share rose from 13.0% to 18.4%, an increase of 5.4 percentage points [1 mark].
- Malaysia's digital economy share rose from 8.4% to 12.8%, an increase of 4.4 percentage points [1 mark].
Singapore's digital economy share was consistently higher than Malaysia's throughout the period, and Singapore also experienced a larger absolute increase (5.4 pp vs 4.4 pp) [1 mark for comparative analysis].
Marking Notes:
- Students must reference specific data from the table.
- "Percentage points" should be used rather than "percent" when comparing two percentages, though accept either if the meaning is clear.
- The comparison must go beyond simply stating both figures — a comparative connective is required.
Question 4
Using the data in Table 2, identify which economy experienced the largest percentage point increase in digital economy share of GDP from 2019 to 2023. Show your working. (3 marks)
Answer:
Calculate the percentage point increase for each economy:
- Singapore: 18.4−13.0=5.4 percentage points
- South Korea: 15.7−10.5=5.2 percentage points
- United Kingdom: 15.9−11.2=4.7 percentage points
- Malaysia: 12.8−8.4=4.4 percentage points
[1 mark for correct method — calculating the difference for at least two economies]
Singapore experienced the largest percentage point increase of 5.4 percentage points [1 mark for correct identification].
[1 mark for showing complete working for all four economies]
Marking Notes:
- Award 1 mark if the student correctly identifies Singapore with partial working.
- Award full marks only if all four calculations are shown and the correct economy is identified.
- Common mistake: confusing percentage change with percentage point change.
Question 5
Explain one possible reason why Singapore's digital economy share of GDP is consistently higher than Malaysia's, as shown in Table 2. (3 marks)
Answer:
One possible reason is that Singapore has invested more heavily in digital infrastructure, such as nationwide broadband networks and 5G connectivity, which provides a stronger foundation for digital economic activity [1 mark for identifying a valid reason].
This higher level of investment enables more businesses and consumers to participate in the digital economy, increasing the digital sector's contribution to overall GDP [1 mark for developing the explanation].
Additionally, Singapore's smaller land area and highly urbanised population make it easier and more cost-effective to deploy digital infrastructure compared to Malaysia, which has more rural and geographically dispersed regions [1 mark for further development or an alternative valid point].
Alternative acceptable answers:
- Singapore's higher per capita income means greater consumer purchasing power for digital goods and services.
- Singapore's status as a global financial and business hub attracts more digital services firms.
- Singapore's government has been more proactive in implementing digitalisation policies (e.g., SMEs Go Digital, Smart Nation initiative).
- Singapore's more educated and skilled workforce is better equipped to participate in the digital economy.
Marking Notes:
- 1 mark for identifying a valid reason.
- 1 mark for explaining how the reason leads to a higher digital economy share.
- 1 mark for further development, elaboration, or a second distinct point.
- The reason must be economically plausible and clearly linked to the data.
Question 6
With reference to Source 2, identify two government policies aimed at promoting digitalisation in Singapore. (2 marks)
Answer:
-
SMEs Go Digital programme — provides subsidies of up to 70% for SMEs adopting pre-approved digital solutions [1 mark].
-
Digital Resilience Bonus — offers additional support to firms that adopt advanced cybersecurity measures and e-payment systems [1 mark].
Alternative acceptable answer:
- SkillsFuture programme — provides credits for mid-career workers to reskill for the digital economy [1 mark if used as one of the two policies].
Marking Notes:
- 1 mark per policy correctly identified from Source 2.
- The policy must be named or clearly described; vague references to "government subsidies" without naming the specific programme earn 0 marks.
Question 7
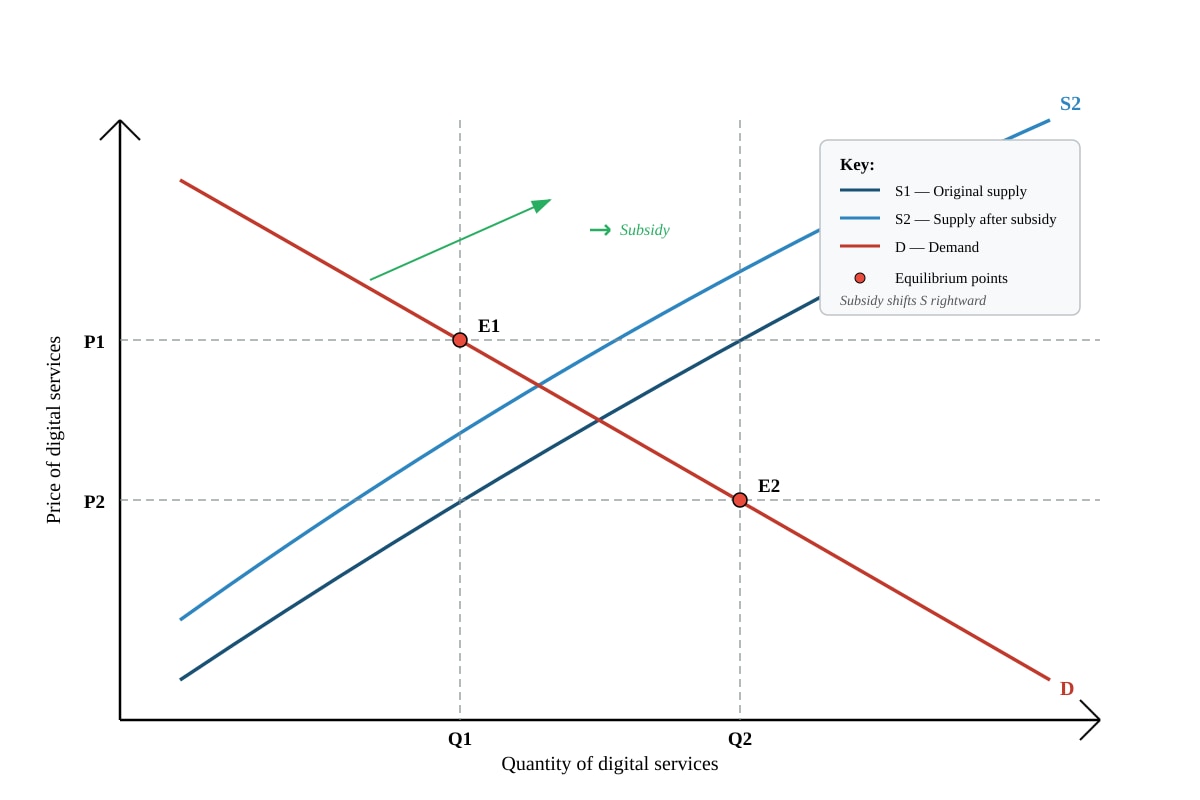
Using a demand and supply diagram, illustrate and explain how the Government's subsidy for SMEs adopting digital solutions might affect the market for digital services in Singapore. (5 marks)
Answer:
Diagram (3 marks):
<image_placeholder> id: Q7-fig1 type: diagram linked_question: Q7 description: A demand and supply diagram for the digital services market. Initial equilibrium at price P1 and quantity Q1. Supply curve shifts rightward to S2 due to subsidy, new equilibrium at lower price P2 and higher quantity Q2. Axes labelled "Price of digital services" (vertical) and "Quantity of digital services" (horizontal). Curves labelled S1 (original supply), S2 (new supply after subsidy), and D (demand). Equilibrium points E1 and E2 clearly marked. labels: P1, P2, Q1, Q2, S1, S2, D, E1, E2 values: P1 > P2, Q2 > Q1 must_show: Two supply curves (S1 left, S2 right), one downward-sloping demand curve D, two equilibrium points E1 and E2, all axes and curves clearly labelled, arrows showing direction of shift </image_placeholder>
- 1 mark for correctly drawn and labelled axes (Price and Quantity of digital services).
- 1 mark for showing the supply curve shifting rightward (S1 to S2) with the demand curve unchanged.
- 1 mark for correctly identifying the new equilibrium (lower price P2, higher quantity Q2) with both equilibria labelled.
Explanation (2 marks):
The government subsidy reduces the cost of production for firms providing digital services (or reduces the effective price for SMEs purchasing digital solutions), effectively increasing supply [1 mark].
As the supply curve shifts rightward from S1 to S2, the equilibrium price falls from P1 to P2 and the equilibrium quantity increases from Q1 to Q2. This means more digital services are consumed at a lower price, promoting digital adoption [1 mark].
Marking Notes:
- The explanation must link the subsidy to an increase in supply (not demand).
- Common mistake: students may incorrectly shift the demand curve. Award 0 marks for the explanation if the diagram shows a demand shift.
- Accept explanations framed in terms of "increased demand for digital services by SMEs" if the student draws a demand shift diagram, but note that the more economically accurate treatment is a supply-side effect (subsidy to producers) or an effective demand increase. Either approach is acceptable if consistently applied.
Question 8
Explain how the expansion of the SkillsFuture programme might help address the concern about income inequality arising from digitalisation, as mentioned in Source 2. (4 marks)
Answer:
Digitalisation tends to disproportionately benefit higher-skilled workers who can leverage digital tools, while lower-skilled workers face displacement from automation and technological change. This widens the income gap [1 mark for explaining the link between digitalisation and income inequality].
The SkillsFuture programme provides credits for mid-career workers to reskill and upskill, enabling lower-skilled workers to acquire the competencies needed for higher-paying digital economy jobs [1 mark for explaining how SkillsFuture addresses the issue].
By improving the human capital of displaced or at-risk workers, the programme increases their employability and earning potential, thereby reducing the income gap between skilled and unskilled workers [1 mark for developing the explanation].
Furthermore, if the programme successfully transitions a significant number of workers into higher-productivity roles, it can increase the overall supply of skilled labour, which may moderate wage growth at the top end while raising wages at the bottom, contributing to a more equitable income distribution [1 mark for further development or evaluation].
Marking Notes:
- 1 mark for explaining why digitalisation worsens income inequality.
- 1 mark for explaining how SkillsFuture addresses this.
- 1 mark for developing the mechanism (human capital, employability, wages).
- 1 mark for further development, a second distinct point, or a qualifying statement.
- Answers must go beyond simply describing SkillsFuture — they must link it to income inequality.
Question 9
Discuss whether the Government's target of achieving a 30% digital economy contribution to GDP by 2030 is realistic, using evidence from the case study. (6 marks)
Answer:
Introduction: The Government aims for the digital economy to contribute 30% of GDP by 2030, up from 18.4% in 2023. This requires an increase of 11.6 percentage points over 7 years.
Arguments suggesting the target is realistic (3 marks):
-
The digital economy share has been growing steadily, rising from 13.0% in 2019 to 18.4% in 2023 — an increase of 5.4 percentage points in 4 years. If this growth rate continues, reaching 30% by 2030 is achievable [1 mark for using data to support feasibility].
-
The Government has committed significant resources through the Digital Economy Framework for Action, with three pillars (digital infrastructure, workforce upskilling, regulatory innovation) that address key enablers of digital growth [1 mark for referencing government policy support].
-
The COVID-19 pandemic accelerated digital adoption (e-commerce revenue jumped from S5.2billionin2019toS8.1 billion in 2020), suggesting that digitalisation trends may continue to accelerate [1 mark for using evidence of accelerating trends].
Arguments suggesting the target may be challenging (2 marks):
-
As the digital economy share grows larger, further percentage point gains become harder to achieve because the base is larger — diminishing returns may set in [1 mark for identifying a constraint].
-
The concern about income inequality and workforce displacement (mentioned in Source 2) could create political and social resistance to rapid digitalisation, potentially slowing progress [1 mark for identifying a social/political constraint].
Conclusion (1 mark):
On balance, the target is ambitious but achievable, provided that the Government continues to invest in digital infrastructure and workforce development, and addresses the distributional concerns that may arise from rapid digitalisation. The historical growth rate suggests the target is within reach, but it will require sustained policy effort.
Marking Notes:
- This is an AO3 evaluation question. Award marks for:
- 1 mark for identifying the scale of the challenge (data reference).
- Up to 3 marks for arguments supporting feasibility.
- Up to 2 marks for arguments suggesting challenges.
- 1 mark for a reasoned conclusion.
- Students must use evidence from the case study, not just generic arguments.
- A one-sided answer can earn a maximum of 4 marks.
Question 10
Evaluate the effectiveness of government subsidies (such as the SMEs Go Digital programme) as a policy tool to promote digitalisation in Singapore. (6 marks)
Answer:
Introduction: Government subsidies, such as the SMEs Go Digital programme which covers up to 70% of digital solution costs, are a demand-side intervention designed to lower the cost barrier for SMEs to adopt digital technologies.
Arguments that subsidies are effective (3 marks):
-
Subsidies directly reduce the financial cost of digital adoption for SMEs, making it more affordable and reducing the opportunity cost of investing in digital solutions. This is particularly important for SMEs that may lack the capital to invest in digital transformation [1 mark].
-
The 70% subsidy rate is substantial, meaning the effective price to SMEs is only 30% of the actual cost. This significant price reduction is likely to generate a strong response, especially for price-sensitive smaller firms [1 mark for developing the analysis].
-
Subsidies can help overcome information failures and inertia — many SMEs may not fully understand the benefits of digitalisation, and a subsidy provides a financial incentive to try digital solutions, after which they may continue using them even without the subsidy [1 mark for identifying a market failure rationale].
Limitations of subsidies (2 marks):
-
Subsidies are costly to the government and may represent a misallocation of resources if they fund digital solutions that firms would have adopted anyway (deadweight loss) [1 mark].
-
Subsidies may create dependency, where firms only adopt digital solutions when subsidised and revert to old practices when the subsidy ends, limiting long-term effectiveness [1 mark].
-
There is a risk of moral hazard — firms may over-invest in digital solutions simply because they are subsidised, rather than because the investment is economically justified [alternative point].
Conclusion (1 mark):
Subsidies are an effective short-term tool to kickstart digital adoption, particularly for SMEs facing financial constraints. However, they should be complemented by other policies (e.g., education, infrastructure development) to ensure sustainable digital transformation. The effectiveness depends on careful programme design to minimise deadweight loss and dependency.
Marking Notes:
- This is an AO3 evaluation question requiring a balanced assessment.
- Award up to 3 marks for arguments supporting effectiveness.
- Award up to 2 marks for limitations/criticisms.
- Award 1 mark for a reasoned conclusion that weighs both sides.
- Students must use evidence from the case study (e.g., the 70% subsidy rate, the SMEs Go Digital programme).
- A one-sided answer can earn a maximum of 4 marks.
Section B: Case Study B — Inflation and Monetary Policy in Singapore
Question 11
With reference to Table 3, compare the MAS Core Inflation rate and the global oil price from 2020 to 2023. (4 marks)
Answer:
Both MAS Core Inflation and global oil prices showed an overall upward trend from 2020 to 2023, though with some fluctuations [1 mark for identifying the common trend].
- MAS Core Inflation rose from -0.2% in 2020 to 4.2% in 2023, representing a significant increase of 4.4 percentage points [1 mark].
- Global oil prices rose from US42/barrelin2020toUS82/barrel in 2023, though they peaked at US$94 in 2022 before falling slightly [1 mark].
Both indicators dipped or were at their lowest in 2020 (likely due to the COVID-19 pandemic reducing demand), and both rose sharply in 2021–2022, suggesting a positive correlation between global oil prices and domestic core inflation [1 mark for comparative analysis].
Marking Notes:
- 1 mark for stating the common trend (both increased overall).
- 1 mark for correct data reference for MAS Core Inflation.
- 1 mark for correct data reference for global oil prices.
- 1 mark for a valid comparative point (correlation, relative magnitude, or timing).
- Students must use comparative language to earn full marks.
Question 12
Using the data in Table 3, calculate the percentage increase in the CPI All Items index from 2021 to 2023. Show your working. (3 marks)
Answer:
From Table 3:
- CPI All Items in 2021 = 102.1
- CPI All Items in 2023 = 113.2
Percentage increase=102.1113.2−102.1×100=102.111.1×100≈10.87%
[1 mark for correct formula/method, 1 mark for correct substitution, 1 mark for correct answer of approximately 10.9%]
Marking Notes:
- Accept answers in the range 10.8%–11.0% depending on rounding.
- Award the method mark even if the final answer is incorrect, provided the formula is correct.
- Common mistake: using 2019 as the base year instead of 2021.
Question 13
With reference to Table 4, compare the inflation experience of Singapore and the United States from 2020 to 2023. (4 marks)
Answer:
Both Singapore and the United States experienced a similar pattern of low/negative inflation in 2020, followed by a sharp rise in 2021–2022, and then a moderation in 2023 [1 mark for identifying the common pattern].
- Singapore's inflation ranged from -0.2% (2020) to 6.1% (2022), while the US ranged from 1.2% (2020) to 8.0% (2022) [1 mark for data reference].
- The United States experienced higher peak inflation (8.0% vs 6.1% in 2022), suggesting more severe inflationary pressures [1 mark for comparative analysis].
- Both economies saw inflation moderate in 2023 (Singapore: 4.8%, US: 4.1%), with the US experiencing a slightly faster decline [1 mark for further comparison].
Marking Notes:
- 1 mark for identifying the common trend/pattern.
- 1 mark for correct data reference for Singapore.
- 1 mark for correct data reference for the US.
- 1 mark for a valid comparative analysis.
- Students must reference specific data from the table.
Question 14
Explain how a rise in global oil prices, as shown in Table 3, could lead to cost-push inflation in Singapore. (4 marks)
Answer:
Cost-push inflation occurs when the costs of production increase, causing firms to raise prices [1 mark for defining cost-push inflation].
Oil is a key input in production and transportation. When global oil prices rise (from US42in2020toUS94 in 2022), the cost of energy and transportation increases for Singaporean firms [1 mark for identifying the transmission mechanism].
Since Singapore is a price-taker in global oil markets and imports virtually all of its energy, it cannot influence the world price of oil and must accept the higher import costs [1 mark for explaining Singapore's vulnerability as a small open economy].
Firms pass on these higher production costs to consumers in the form of higher prices, leading to a rise in the general price level — this is cost-push inflation. This is reflected in the rise in the import price index from 95.3 in 2020 to 118.6 in 2022 (Table 3) [1 mark for linking to the data and completing the chain of reasoning].
Marking Notes:
- 1 mark for defining cost-push inflation.
- 1 mark for identifying oil as a production input and the cost increase mechanism.
- 1 mark for explaining why Singapore is particularly affected (small open economy, import-dependent).
- 1 mark for completing the chain of reasoning (firms pass on costs → higher prices).
- Answers must demonstrate a clear cause-and-effect chain.
Question 15
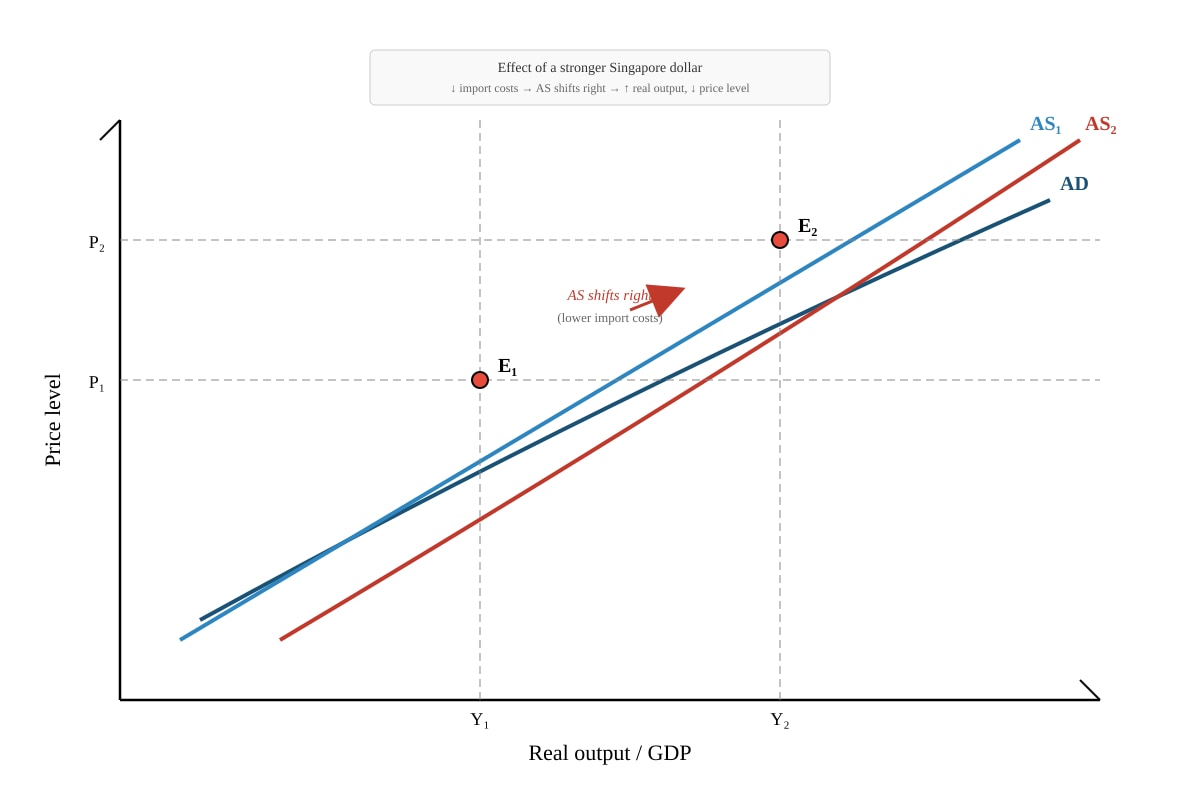
Using an AD/AS diagram, illustrate and explain the effect of a stronger Singapore dollar on the price level and real output in Singapore. (5 marks)
Answer:
Diagram (3 marks):
<image_placeholder> id: Q15-fig1 type: diagram linked_question: Q15 description: An AD/AS diagram showing the effect of a stronger Singapore dollar. Initial equilibrium at price level P1 and real output Y1. Aggregate supply curve shifts rightward to AS2 due to lower import costs, new equilibrium at lower price level P2 and higher real output Y2. Axes labelled "Price level" (vertical) and "Real output/GDP" (horizontal). Curves labelled AD (aggregate demand), AS1 (original aggregate supply), AS2 (new aggregate supply after stronger dollar). Equilibrium points E1 and E2 clearly marked. labels: P1, P2, Y1, Y2, AD, AS1, AS2, E1, E2 values: P1 > P2, Y2 > Y1 must_show: One downward-sloping AD curve, two upward-sloping AS curves (AS1 left, AS2 right), two equilibrium points E1 and E2, all axes and curves clearly labelled, arrows showing direction of shift </image_placeholder>
- 1 mark for correctly drawn and labelled axes (Price level and Real output/GDP).
- 1 mark for showing the AS curve shifting rightward (AS1 to AS2) with AD unchanged.
- 1 mark for correctly identifying the new equilibrium (lower price level P2, higher real output Y2).
Explanation (2 marks):
A stronger Singapore dollar makes imports cheaper in domestic currency terms. Since Singapore is heavily reliant on imports for raw materials, intermediate goods, and consumer products, lower import costs reduce firms' costs of production [1 mark].
The reduction in production costs shifts the aggregate supply curve rightward from AS1 to AS2. At the new equilibrium, the price level falls from P1 to P2 and real output increases from Y1 to Y2 [1 mark].
Marking Notes:
- The explanation must focus on the supply-side effect (lower import costs → increased AS).
- Common mistake: students may argue that a stronger dollar reduces net exports and shifts AD leftward. While this is also a valid effect, the question specifically asks about the price level and real output effect through the exchange rate policy context described in Source 5 (controlling imported inflation). Accept either approach if consistently applied and clearly explained.
- If a student draws an AD shift (leftward due to lower net exports), accept with appropriate explanation: price level falls and real output falls. Award marks accordingly.
Question 16
With reference to Source 5, explain why MAS uses the exchange rate rather than interest rates as its primary monetary policy tool. (3 marks)
Answer:
Singapore is a small, highly open economy with a large trade sector — total trade is a multiple of GDP. This means the exchange rate has a much more direct and significant impact on the domestic economy than interest rates [1 mark for explaining Singapore's economic structure].
The exchange rate directly affects the price of imports and exports, which is crucial for an economy that is heavily dependent on international trade. A stronger dollar reduces imported inflation, which is particularly important since Singapore imports most of its goods [1 mark for explaining the transmission mechanism].
Additionally, as a small open economy with free capital mobility, Singapore cannot independently set interest rates without affecting capital flows and the exchange rate. Using interest rates as the primary tool would conflict with exchange rate management [1 mark for explaining the trilemma/impossible trinity].
Marking Notes:
- 1 mark for identifying Singapore's small open economy characteristics.
- 1 mark for explaining the exchange rate's direct impact on trade and prices.
- 1 mark for explaining the constraint on interest rate policy (impossible trinity/capital mobility).
- Answers must reference the context from Source 5.
Question 17
Identify one domestic factor and one global factor that contributed to Singapore's inflation in 2022–2023, as mentioned in Source 5. (2 marks)
Answer:
- Domestic factor: Tight labour market and rising wages (cost-push inflation from the domestic side) [1 mark].
- Global factor: Global supply chain disruptions / Russia-Ukraine conflict / rising energy prices (any one) [1 mark].
Marking Notes:
- 1 mark for each correctly identified factor.
- The factor must be from Source 5, not invented by the student.
- Accept any of the global factors mentioned in Source 5.
Question 18
Explain how a tight labour market could contribute to inflation in Singapore. (4 marks)
Answer:
A tight labour market occurs when the demand for labour exceeds the supply of available workers, leading to labour shortages [1 mark for defining a tight labour market].
When firms face labour shortages, they must offer higher wages to attract and retain workers. This increases the cost of production for firms [1 mark for explaining the wage increase mechanism].
Firms pass on these higher labour costs to consumers in the form of higher prices for goods and services, leading to cost-push inflation [1 mark for explaining the transmission to prices].
In Singapore's context, the tight labour market in 2022–2023 was exacerbated by border restrictions during the pandemic, which reduced the inflow of foreign workers. This supply-side constraint on labour intensified wage pressures, contributing to the rise in MAS Core Inflation from 0.9% in 2021 to 4.1% in 2022 [1 mark for contextualising with evidence from the case study].
Marking Notes:
- 1 mark for defining a tight labour market.
- 1 mark for explaining the wage-cost mechanism.
- 1 mark for explaining the pass-through to prices (cost-push inflation).
- 1 mark for contextualising with evidence from the case study or data.
- Answers must demonstrate a clear cause-and-effect chain.
Question 19
Discuss whether MAS's policy of allowing the Singapore dollar to appreciate is an effective way to control inflation in Singapore. (6 marks)
Answer:
Introduction: MAS tightened monetary policy multiple times between October 2021 and January 2023 by allowing the S$NEER to appreciate, in response to rising inflation (MAS Core Inflation rose from 0.9% in 2021 to 4.2% in 2023).
Arguments that exchange rate appreciation is effective (3 marks):
-
A stronger Singapore dollar directly reduces the domestic price of imports, which is highly effective for Singapore since it imports most of its consumer goods, raw materials, and energy. This directly addresses imported inflation, which was the primary driver of inflation in 2022–2023 [1 mark].
-
The policy is relatively quick to implement and its effects are transmitted rapidly through import prices, unlike interest rate changes which work with a longer lag [1 mark for explaining the speed of transmission].
-
The data in Table 3 shows that as the dollar strengthened and oil prices fell from US94(2022)toUS82 (2023), MAS Core Inflation stabilised at 4.2% in 2023 (down from the peak trajectory), suggesting the policy had a moderating effect [1 mark for using evidence].
Limitations of exchange rate appreciation (2 marks):
-
A stronger dollar makes Singapore's exports more expensive for foreign buyers, reducing export competitiveness. This could lead to lower export demand, reduced economic growth, and higher unemployment — a trade-off that may not be sustainable in the long run [1 mark].
-
Exchange rate policy is less effective against domestically generated inflation (e.g., from a tight labour market or rising domestic wages), which was also a factor in 2022–2023. In such cases, supply-side policies may be more appropriate [1 mark for identifying the limitation].
Conclusion (1 mark):
Exchange rate appreciation is an effective tool for controlling imported inflation in Singapore, given the country's heavy reliance on imports. However, it is less effective against domestic cost-push inflation and involves a trade-off with export competitiveness. A comprehensive approach combining exchange rate policy with supply-side measures would be most effective.
Marking Notes:
- This is an AO3 evaluation question requiring a balanced assessment.
- Award up to 3 marks for arguments supporting effectiveness.
- Award up to 2 marks for limitations/criticisms.
- Award 1 mark for a reasoned conclusion.
- Students must use evidence from the case study.
- A one-sided answer can earn a maximum of 4 marks.
Question 20
Evaluate the trade-off between controlling inflation and maintaining export competitiveness in the context of Singapore's exchange rate policy. (6 marks)
Answer:
Introduction: Singapore's exchange rate policy involves an inherent trade-off: allowing the dollar to appreciate helps control inflation by reducing import costs, but it simultaneously makes exports more expensive and less competitive in global markets.
The trade-off explained (2 marks):
-
When MAS allows the S$NEER to appreciate, the stronger dollar reduces the domestic currency price of imports, helping to lower imported inflation. This benefits consumers and firms that rely on imported inputs [1 mark].
-
However, a stronger dollar means that Singapore's exports become more expensive in foreign currency terms. Foreign buyers need to spend more of their own currency to purchase the same Singapore-made goods, reducing demand for Singapore's exports. This can lead to lower export revenues, reduced GDP growth, and potential job losses in export-oriented industries [1 mark].
Factors affecting the severity of the trade-off (2 marks):
-
The price elasticity of demand for Singapore's exports determines how severely export volumes fall. If demand is price-inelastic (e.g., for specialised electronics or pharmaceuticals), the impact on export revenues may be limited. If demand is price-elastic, the trade-off is more severe [1 mark].
-
The nature of inflation matters. If inflation is primarily imported (as in 2022–2023), exchange rate appreciation is a well-targeted policy that addresses the root cause, making the trade-off more justified. If inflation is domestically driven, the trade-off may not be worth it [1 mark].
Evaluation and conclusion (2 marks):
In the context of 2022–2023, when inflation was largely imported (driven by global supply chain disruptions and energy prices), the trade-off was justified because exchange rate appreciation directly addressed the source of inflation. The stabilisation of MAS Core Inflation at 4.2% in 2023 suggests the policy was effective [1 mark].
However, in the long run, sustained exchange rate appreciation could erode Singapore's export competitiveness and economic growth. MAS must therefore calibrate its policy carefully, tightening only as much as necessary to control inflation while minimising the damage to the export sector. A balanced approach that also addresses supply-side constraints (e.g., labour market policies, productivity improvements) would reduce the severity of this trade-off [1 mark].
Marking Notes:
- This is an AO3 evaluation question requiring analysis of a trade-off and a reasoned judgement.
- Award up to 2 marks for explaining the trade-off.
- Award up to 2 marks for factors affecting the severity of the trade-off.
- Award up to 2 marks for evaluation and a reasoned conclusion.
- Students must use evidence from the case study (e.g., the nature of inflation in 2022–2023, the data from Tables 3 and 4).
- A one-sided answer can earn a maximum of 4 marks.
Mark Summary
| Section | Questions | Marks |
|---|---|---|
| Section A (Case Study A) | Q1–Q10 | 40 |
| Section B (Case Study B) | Q11–Q20 | 40 |
| Total | 20 questions | 80 marks |
Assessment Objective Distribution
| AO | Description | Marks (approx.) | Weighting |
|---|---|---|---|
| AO1 | Knowledge and Understanding | 28 | 35% |
| AO2 | Analysis | 32 | 40% |
| AO3 | Evaluation | 20 | 25% |
| Total | 80 | 100% |
End of Answer Key
Free quiz and exam paper access
Enter your details to view this paper
Your access is remembered on this device.