AI Generated Exam Paper
A Level H1 Economics Practice Paper 5
Free A Level H1 Econs Practice Paper 5, HY3 AI version, with questions, answers, and A Level-style practice for Singapore students.
These static practice materials are generated from the site's syllabus and paper-generation workflow, with source and model context shown so students and parents can evaluate the material before use.
Questions
TuitionGoWhere Practice Paper - Economics H1 A-Level
TuitionGoWhere Practice Paper (AI) — Version 5
Subject: Economics H1
Level: A-Level
Paper: Practice Paper (Data Response Focus)
Duration: 1 hour 30 minutes
Total Marks: 40
Name: ___________________________
Class: ___________________________
Date: ___________________________
Instructions:
- This practice paper contains 20 questions based on data response skills for H1 Economics.
- Section A (Q1–8): Data interpretation (16 marks)
- Section B (Q9–14): Source-based analysis (12 marks)
- Section C (Q15–20): Evaluation and synthesis (12 marks)
- Use the extracts, tables, and figures provided. Reference them clearly in your answers.
- Approved calculator permitted.
Section A: Data Interpretation (16 marks)
Extract 1 and Table 1: Regional Productivity and Spending
Table 1 shows real GDP growth (%) and government healthcare spending per capita (USD) for two economies from 2019–2023.
| Year | Country X Real GDP Growth | Country X Health Spend | Country Y Real GDP Growth | Country Y Health Spend |
|---|---|---|---|---|
| 2019 | 3.2 | 2100 | 2.1 | 1500 |
| 2020 | -2.4 | 2300 | -1.0 | 1600 |
| 2021 | 5.0 | 2400 | 3.4 | 1700 |
| 2022 | 3.8 | 2500 | 2.9 | 1800 |
| 2023 | 2.5 | 2600 | 2.2 | 1900 |
Q1. With reference to Table 1, compare the real GDP growth of Country X and Country Y from 2019 to 2023. [2]
Q2. Using Table 1, describe the trend in government healthcare spending per capita in Country X from 2019 to 2023. [2]
Q3. Using Table 1, compare the government healthcare spending per capita between the two countries over the period. [2]
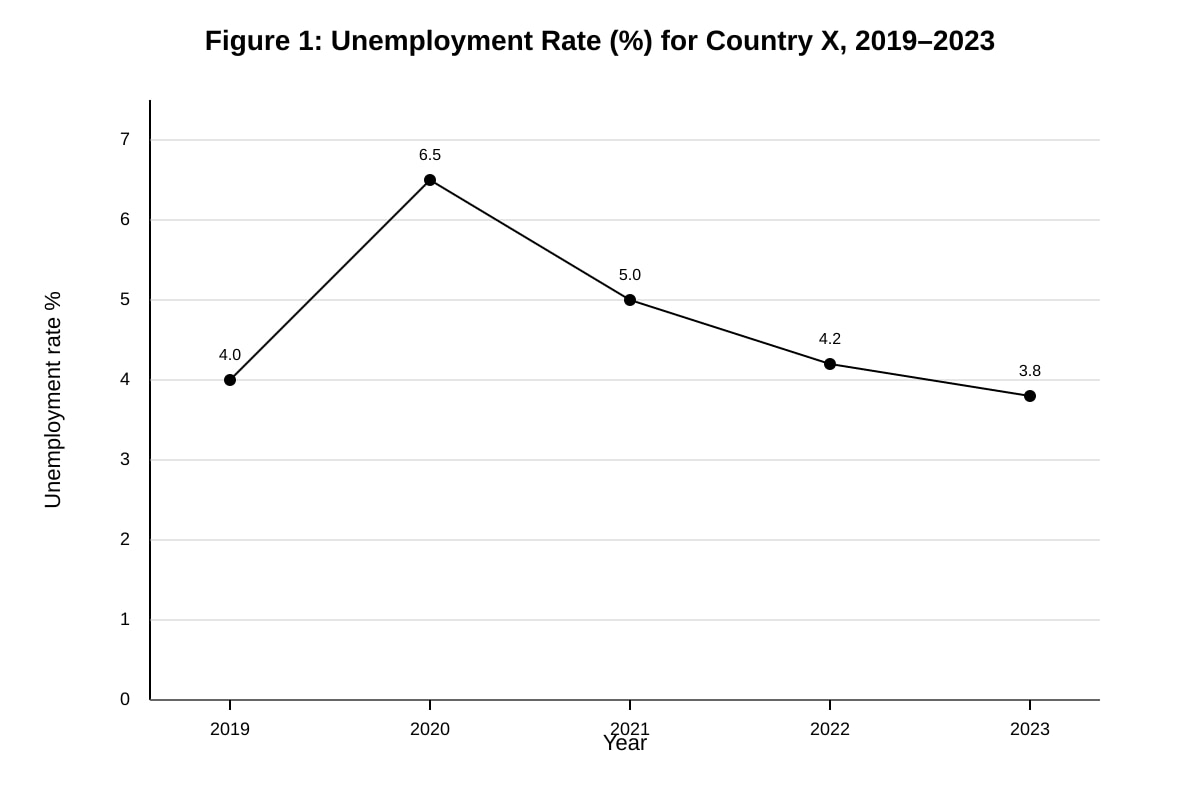
Q4. Figure 1 shows the unemployment rate (%) for Country X from 2019 to 2023.
Image pending generation: graph for Q4.
Describe the trend in Country X's unemployment rate from 2019 to 2023. [2]
Q5. Using Table 1, calculate the percentage change in Country Y's real GDP growth from 2019 to 2021. Show your working. [2]
Q6. With reference to Table 1, explain one possible reason why Country X's healthcare spending rose despite negative GDP growth in 2020. [2]
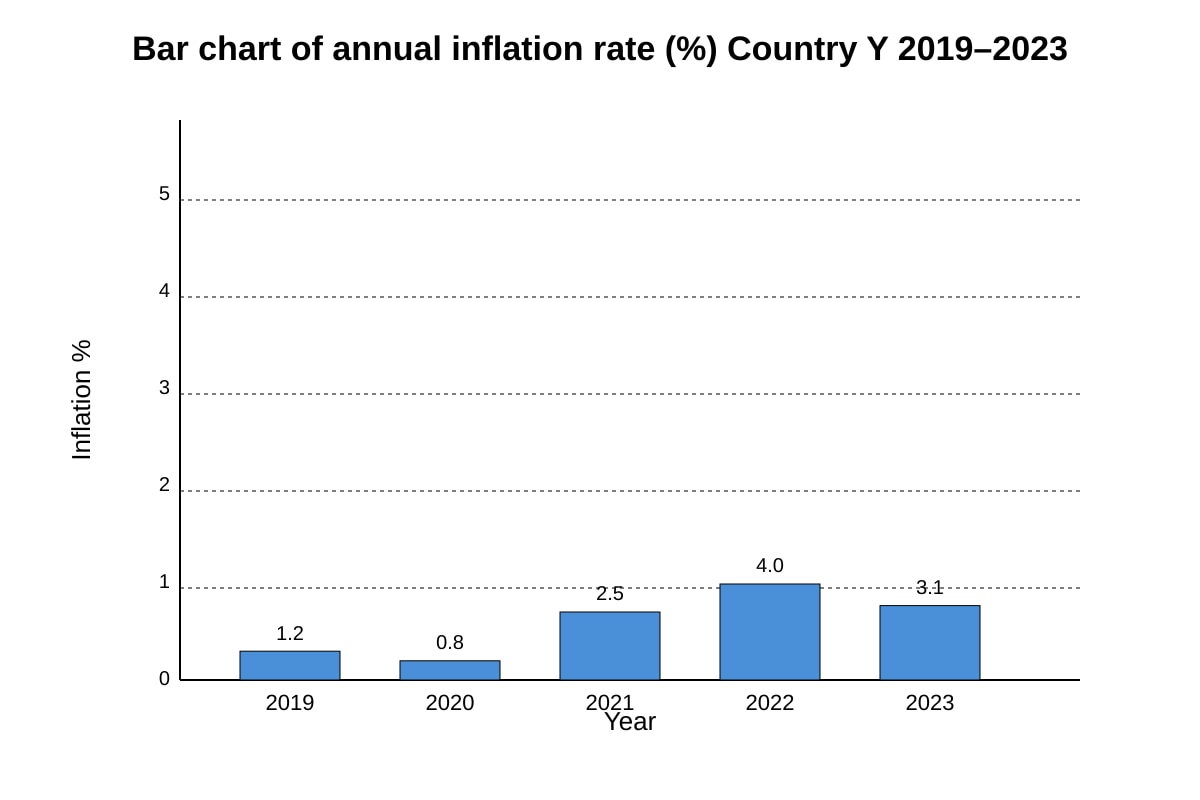
Q7. Figure 2 shows Consumer Price Index inflation for Country Y, 2019–2023.
Image pending generation: graph for Q7.
Describe the trend in inflation in Country Y from 2019 to 2023. [2]
Q8. Using Table 1, compare the volatility of real GDP growth between the two countries. [2]
Section B: Source-Based Analysis (12 marks)
Extract 2: "Country X introduced a subsidy for electric vehicles (EVs) in 2021. The aim was to reduce carbon emissions and improve air quality. By 2023, EV sales tripled, but total government expenditure on the subsidy reached $1.2 billion. Public transport ridership growth slowed."
Q9. With reference to Extract 2, explain the intended benefit of the EV subsidy. [2]
Q10. Using Extract 2, explain one possible unintended consequence of the EV subsidy on public transport. [2]
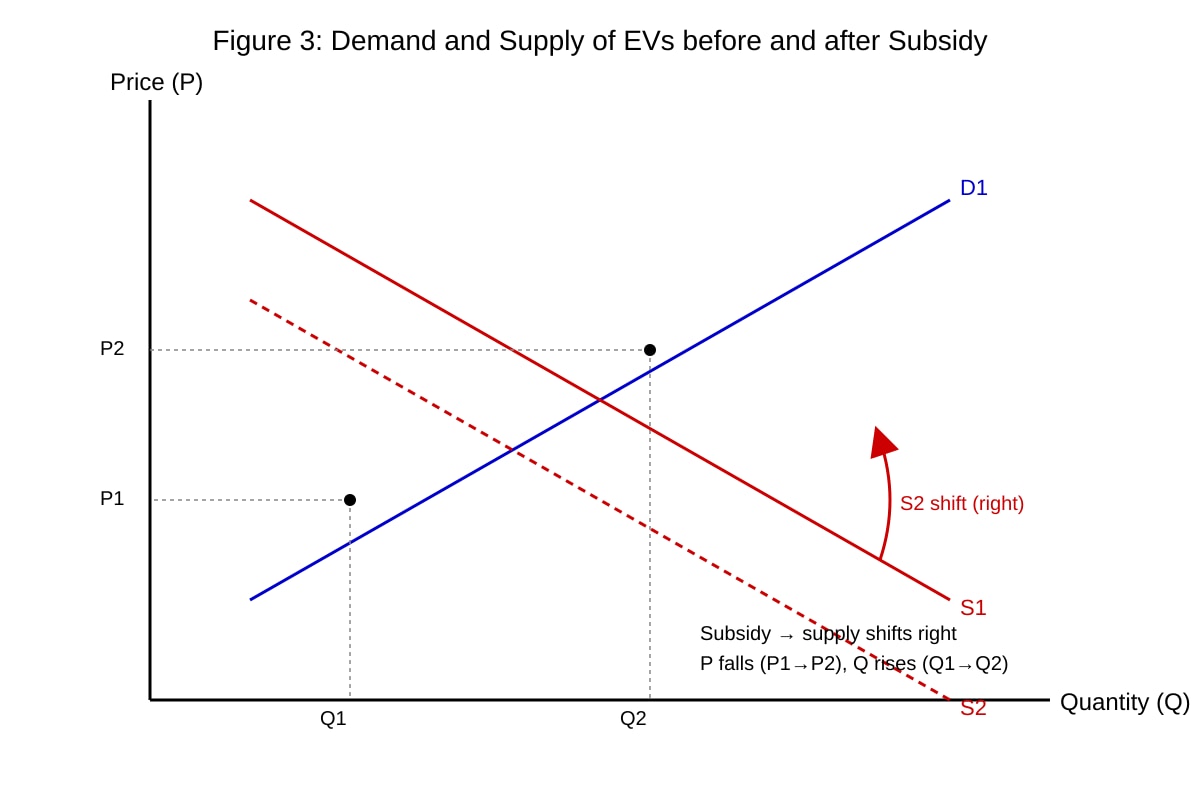
Q11. Figure 3 shows demand and supply of EVs before and after the subsidy.
Image pending generation: diagram for Q11.
With reference to Figure 3, explain how the subsidy affected equilibrium price and quantity of EVs. [2]
Q12. Using Extract 2 and Table 1, suggest one reason why Country X could afford the EV subsidy. [2]
Q13. Explain the concept of opportunity cost with reference to government spending on EV subsidies. [2]
Q14. Using Extract 2, discuss whether the EV subsidy achieved its equity objective. [2]
Section C: Evaluation and Synthesis (12 marks)
Extract 3: "Country Y faces ageing population. Government plans to raise retirement age and increase healthcare spending. Some argue this improves living standards; others say it burdens youth."
Q15. Using Extract 3 and Table 1, evaluate whether higher healthcare spending improved living standards in Country Y. [2]
Q16. Discuss one trade-off faced by Country Y's government in raising retirement age. [2]
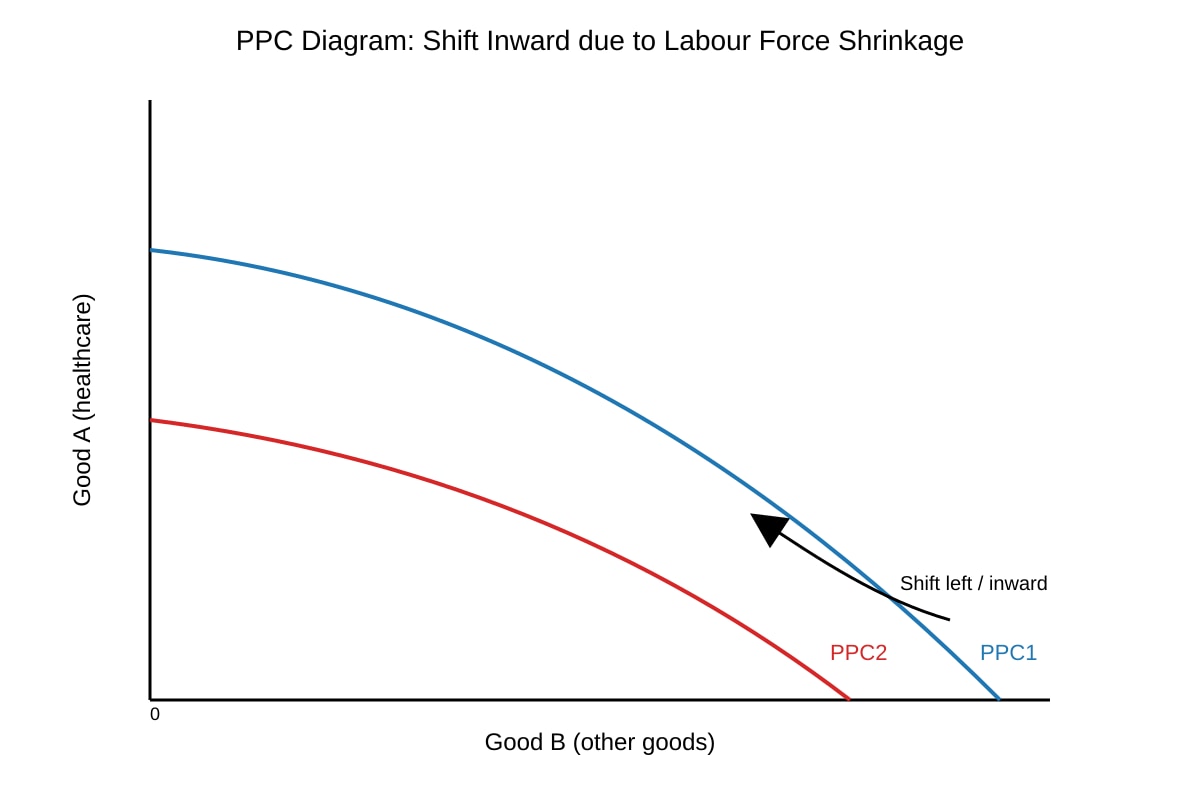
Q17. Using a PPC diagram, explain how an ageing population may affect Country Y's productive capacity.
Image pending generation: diagram for Q17.
[2]
Q18. Evaluate the effectiveness of using subsidies versus direct provision for elderly care. [2]
Q19. Using Extract 3, explain how marginalist decision-making applies to the retirement age policy. [2]
Q20. Discuss whether economic growth alone ensures improved living standards, using data from Table 1. [2]
Answers
TuitionGoWhere Practice Paper — Economics H1 A-Level (Version 5) Answer Key
Total Marks: 40
Section A: 16 marks | Section B: 12 marks | Section C: 12 marks
Section A: Data Interpretation (16 marks)
Q1. [2 marks]
Compare real GDP growth 2019–2023.
- Country X growth was more volatile: 3.2 → -2.4 (2020) → 5.0 (2021) → 3.8 → 2.5. [1]
- Country Y was lower and steadier: 2.1 → -1.0 → 3.4 → 2.9 → 2.2; X fell more in 2020 but recovered faster in 2021. [1]
Marking: 1 mark each for correct comparison of direction/volatility.
Q2. [2 marks]
Trend: Rose every year from 2100(2019)to2600 (2023), a steady increase of $500 total. [2]
Marking: 2 marks for describing upward trend with values.
Q3. [2 marks]
X spent more throughout (2100–2600vs1500–1900). Gap narrowed from 600(2019)to700 (2023)? Actually 2600–1900 = 700, wider. [1] Y always lower but also rising. [1]
Marking: 1 mark each for correct compare.
Q4. [2 marks]
Unemployment rose from 4.0% (2019) to 6.5% (2020), fell to 3.8% (2023). Inverted-V shape. [2]
Refers to Q4-fig1: axes labelled, values as given.
Q5. [2 marks]
% change = ((3.4 – 2.1) / 2.1) × 100 = (1.3 / 2.1) × 100 ≈ 61.9%. [2]
Working shown = 2 marks.
Q6. [2 marks]
COVID-19 shock increased need for health services; automatic stabiliser / counter-cyclical fiscal policy. [2]
Q7. [2 marks]
Low 2019–2020 (1.2, 0.8), rose to 2.5 (2021), 4.0 (2022), eased to 3.1 (2023). [2]
Refers to Q7-fig2 bars.
Q8. [2 marks]
X range: -2.4 to 5.0 (7.4 pts); Y: -1.0 to 3.4 (4.4 pts). X more volatile. [2]
Section B: Source-Based Analysis (12 marks)
Q9. [2 marks]
Reduce carbon emissions and improve air quality (externalities correction). [2]
Q10. [2 marks]
Subsidy diverted users from public transport → ridership growth slowed, possible congestion externality. [2]
Q11. [2 marks]
Subsidy shifts supply right → price falls (P1→P2), quantity rises (Q1→Q2). [2]
Refers to Q11-fig3.
Q12. [2 marks]
X had higher GDP growth pre-2020 and rising tax base; or ran fiscal deficit acceptable. [2]
Q13. [2 marks]
OC = next best alternative foregone; subsidy spending means less for education/infra. [2]
Q14. [2 marks]
Equity: helps EV owners (mid-income) not poor; regressive if non-rich excluded. [2]
Section C: Evaluation and Synthesis (12 marks)
Q15. [2 marks]
Y spend rose, possibly longer life; but ageing may offset gains. Mixed. [2]
Q16. [2 marks]
Trade-off: more workers vs youth burden / fewer entry jobs. [2]
Q17. [2 marks]
Ageing shrinks labour → PPC shifts inward (Q17-fig4). [2]
Q18. [2 marks]
Subsidy: targeted, market-based; direct provision: universal, costly. [2]
Q19. [2 marks]
Govt weighed marginal benefit (support) vs cost (youth burden). [2]
Q20. [2 marks]
X grew but unemployment spiked 2020; growth ≠ living std alone. [2]
Free quiz and exam paper access
Enter your details to view this paper
Your access is remembered on this device.