AI Generated Exam Paper
A Level H1 Economics Practice Paper 4
Free A Level H1 Econs Practice Paper 4, HY3 AI version, with questions, answers, and A Level-style practice for Singapore students.
These static practice materials are generated from the site's syllabus and paper-generation workflow, with source and model context shown so students and parents can evaluate the material before use.
Questions

Free quiz and exam paper access
Enter your details to view this paper
Your access is remembered on this device.
Answers
TuitionGoWhere Practice Paper - Economics H1 A-Level (Version 4) Answer Key
Total Marks: 80
Section A: 28 marks
Section B: 28 marks
Section C: 24 marks
Section A Answers (28 marks)
Q1 [2 marks]
Both primary and university expenditure per student increased from 2018 to 2022. Primary rose from 14,900 (increase of 28,100 to 3,400). University spending remained higher than primary throughout.
Marking: 1 mark for both increased, 1 mark for comparative magnitudes / university higher.
Q2 [2 marks]
Singapore's real GDP growth was more volatile: fell to -5.4% in 2020 then rebounded to 7.6% in 2021. Malaysia also fell in 2020 (-5.6%) but recovered more modestly (3.1% in 2021). By 2022, Malaysia (5.0%) exceeded Singapore (3.6%).
Marking: 1 mark each country trend with data reference.
Q3 [2 marks]
Singapore is a small open economy highly dependent on trade and financial services, making it more exposed to global shocks (e.g., COVID-19 trade disruption) hence more volatile.
Marking: 1 mark cause, 1 mark application to volatility.
Q4 [3 marks]
% increase = ((14,900 - 12,400) / 12,400) × 100 = (2,500 / 12,400) × 100 ≈ 20.16% → 20.2%.
Marking: 1 mark correct subtraction, 1 mark division by original, 1 mark final value.
Q5 [1 mark]
2022 (gap = 3.6 - 5.0 = -1.4 absolute 1.4; 2021 gap 4.5; 2020 gap 0.2? Wait: 2020: -5.4 vs -5.6 gap 0.2; smallest absolute gap is 2020 at 0.2 percentage points). Correct: 2020.
Marking: 1 mark for 2020.
Q6 [3 marks]
2018 difference: 28,100 - 12,400 = 15,700. 2022 difference: 31,500 - 14,900 = 16,600. Difference widened by $900. Therefore widened.
Marking: 1 mark each difference calc, 1 mark conclusion.
Q7 [3 marks]
Malaysia's growth fell from 4.3% (2019) to -5.6% (2020), then recovered to 3.1% (2021) and 5.0% (2022). Trend: sharp drop then gradual recovery above pre-shock level.
Marking: 1 mark drop, 1 mark recovery, 1 mark overall description.
Section B Answers (28 marks)
Q8 [2 marks]
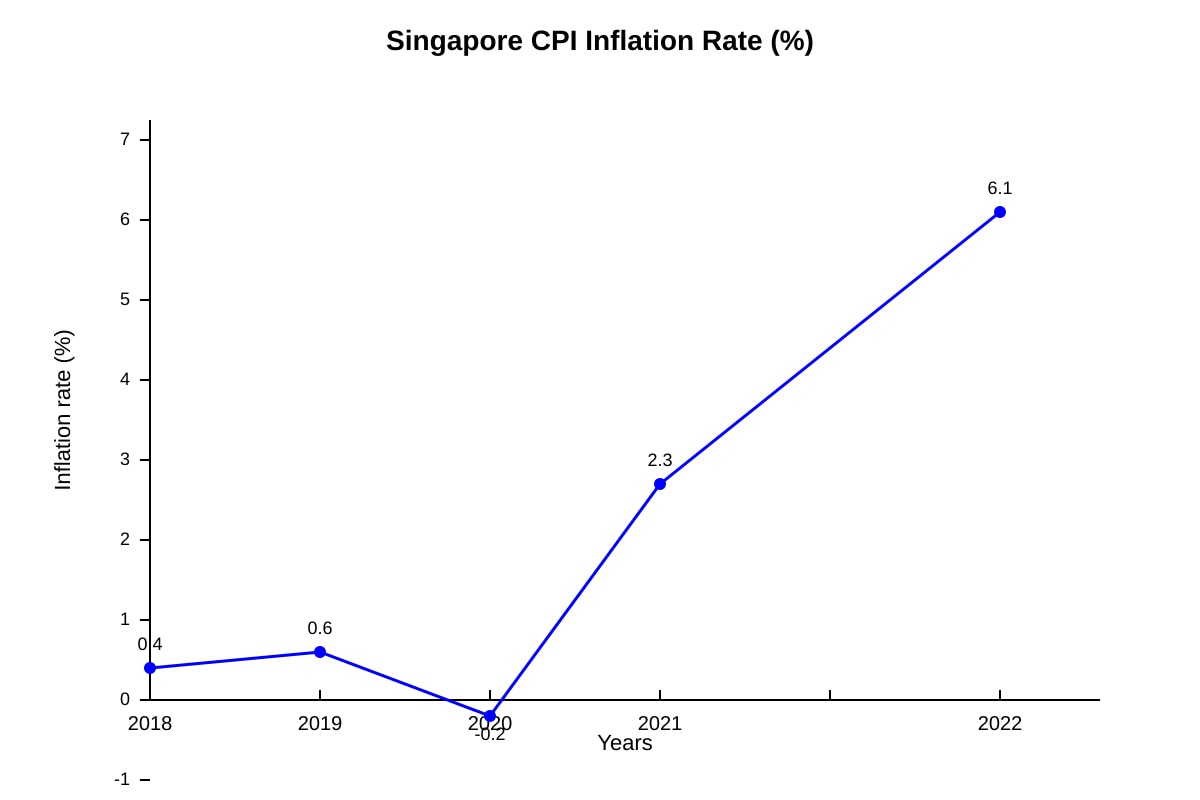
Inflation was low (0.4–0.6%) in 2018–2019, turned negative (-0.2%) in 2020, then rose sharply to 2.3% (2021) and 6.1% (2022).
Marking: 1 mark early low/negative, 1 mark sharp rise.
Q9 [4 marks]
Implication 1: Higher inflation reduces consumers' real purchasing power, especially if wages do not adjust (2 marks). Implication 2: Raises cost of living and may prompt monetary tightening, slowing growth (2 marks).
Marking: 2 marks each with reasoning.
Q10 [4 marks]
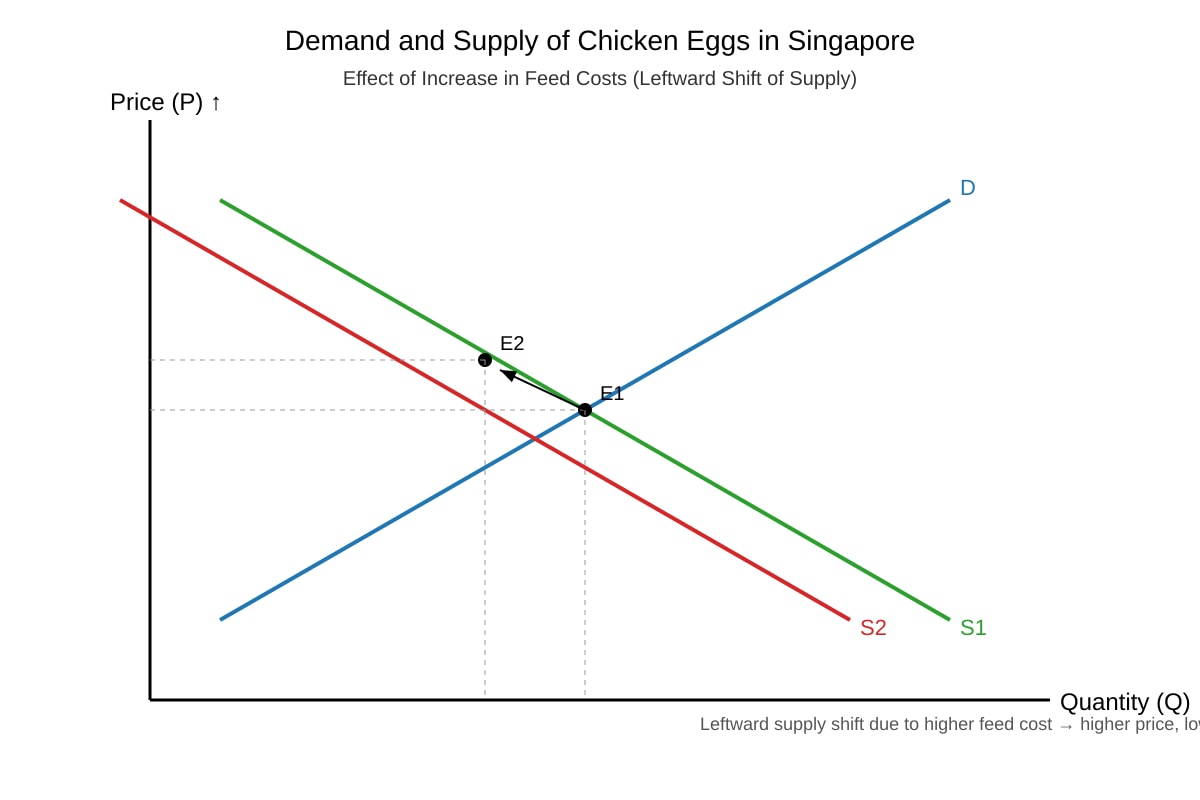
Supply curve shifts left (S1→S2) due to higher feed costs. At new equilibrium E2, price rises (P up) and quantity falls (Q down). Producers supply less at each price; consumers face higher prices and lower availability.
Marking: 1 shift, 1 price up, 1 quantity down, 1 explanation.
Q11 [3 marks]
A country may recover faster due to strong external demand (e.g., Singapore's export rebound). From Table 2, Singapore grew 7.6% in 2021 vs Malaysia 3.1%, likely from trade rebound.
Marking: 1 reason, 2 applied to data.
Q12 [6 marks]
Argument yes: Higher university spending builds human capital, raising long-term productivity and income (3 marks). Argument no: Living standards also depend on health, environment, GDP; university spending may not help if jobs lacking (3 marks). Conclusion with trade-off.
Marking: 3+3 descriptors, evaluation expected.
Q13 [4 marks]
Movement from X (inside PPC) to Y (on PPC) indicates previously under-utilised resources (e.g., unemployment in 2020) became fully employed by 2022. Shows improvement in productive efficiency.
Marking: 2 marks explanation of movement, 2 marks resource use meaning.
Q14 [5 marks]
Singapore rebounded faster in 2021 (7.6% vs 3.1%) but Malaysia overtook in 2022 (5.0% vs 3.6%). Policy: fiscal stimulus or reopening support could aid recovery (e.g., jobs support scheme).
Marking: 2 compare, 3 policy with reasoning.
Section C Answers (24 marks)
Q15 [6 marks]
Education spending builds long-term human capital (2); GDP growth provides immediate goods/services (2); but living standards need both, trade-offs in budget (2 evaluation).
Marking: balanced points + evaluation.
Q16 [3 marks]
Inflation (Fig 1: up to 6.1%) erodes real value of fixed nominal education spending; $14,900 in 2022 buys less than same nominal in 2018.
Marking: 1 inflation, 2 real value effect.
Q17 [2 marks]
Subsidy may lower producer incentive to improve efficiency or cause overproduction and waste.
Marking: 1 consequence, 1 explanation.
Q18 [4 marks]
Volatile GDP (Table 2) implies unstable income/jobs, harder planning. Small open economies face external shocks. Stability needs buffers.
Marking: 2 volatility link, 2 stability analysis.
Q19 [5 marks]
Government may spend on education (long-term) but neglect macro stability (inflation). Trade-off: limited budget; must balance. Use extracts.
Marking: 2 trade-off, 3 applied.
Q20 [4 marks]
Useful: shows trends, comparisons. Limited: no income distribution, non-material living standards. Data partial.
Marking: 2 useful, 2 limitations.