AI Generated Exam Paper
A Level H1 Economics Practice Paper 3
Free A Level H1 Econs Practice Paper 3, HY3 AI version, with questions, answers, and A Level-style practice for Singapore students.
These static practice materials are generated from the site's syllabus and paper-generation workflow, with source and model context shown so students and parents can evaluate the material before use.
Questions
TuitionGoWhere Practice Paper - Economics H1 A-Level
TuitionGoWhere Practice Paper (AI) — Version 3 of 5
Subject: Economics H1
Level: A-Level
Paper: Practice Paper (Data Response Focus)
Duration: 1 hour 30 minutes
Total Marks: 40
Name: ________________________
Class: ________________________
Date: ________________________
Instructions:
- This practice paper contains 20 questions based on data response skills for H1 Economics.
- Answer all questions in the spaces provided.
- Use an approved calculator if needed.
- Marks for each question are shown in brackets.
- Section marks sum to the total of 40 marks.
Section A: Data Interpretation (Questions 1–8) [16 marks]
Extract 1: Government Healthcare Spending (2020–2024)
| Year | Singapore Healthcare Spending (% of GDP) | Malaysia Healthcare Spending (% of GDP) |
|---|---|---|
| 2020 | 4.1 | 3.8 |
| 2021 | 4.3 | 3.9 |
| 2022 | 4.6 | 4.0 |
| 2023 | 4.8 | 4.2 |
| 2024 | 5.0 | 4.3 |
Table 1: Comparative healthcare spending as percentage of GDP.
- With reference to Table 1, compare the healthcare spending as a percentage of GDP between Singapore and Malaysia from 2020 to 2024. [2]
- Describe the trend in Singapore’s healthcare spending from 2020 to 2024. [2]
- Using Table 1, calculate the percentage point increase in Singapore’s healthcare spending from 2020 to 2024. [1]
- Suggest one reason why Malaysia’s healthcare spending remained lower than Singapore’s over the period. [1]
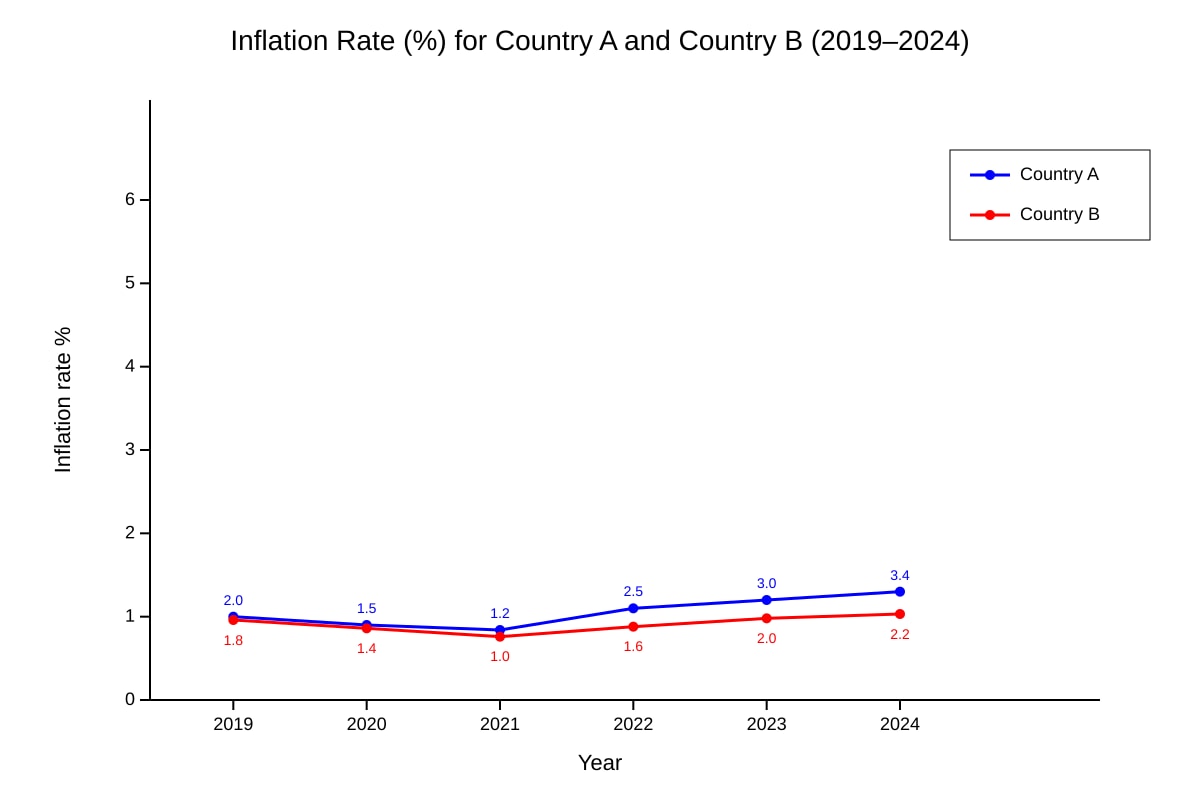
Image pending generation: graph for Q5.
- Using Figure Q5-fig1, compare the inflation rates of Country A and Country B from 2021 to 2024. [2]
- With reference to Extract 1, explain one possible economic implication of rising healthcare spending as a share of GDP. [2]
- State one limitation of using percentage of GDP to compare healthcare spending between countries. [1]
- Using Table 1, which country had the larger average annual increase in healthcare spending share? Show your working. [3]
Section B: Microeconomic Data Response (Questions 9–14) [12 marks]
Extract 2: In 2023, the price of ride-hailing trips in Country X rose by 15%, and the number of trips taken fell by 24%. A survey found few substitute apps available.
- Calculate the price elasticity of demand (PED) for ride-hailing trips using the data in Extract 2. [2]
- Explain what the PED value in Q9 suggests about the nature of demand for ride-hailing trips. [2]
- With reference to Extract 2, explain why the PED value might be as calculated. [2]
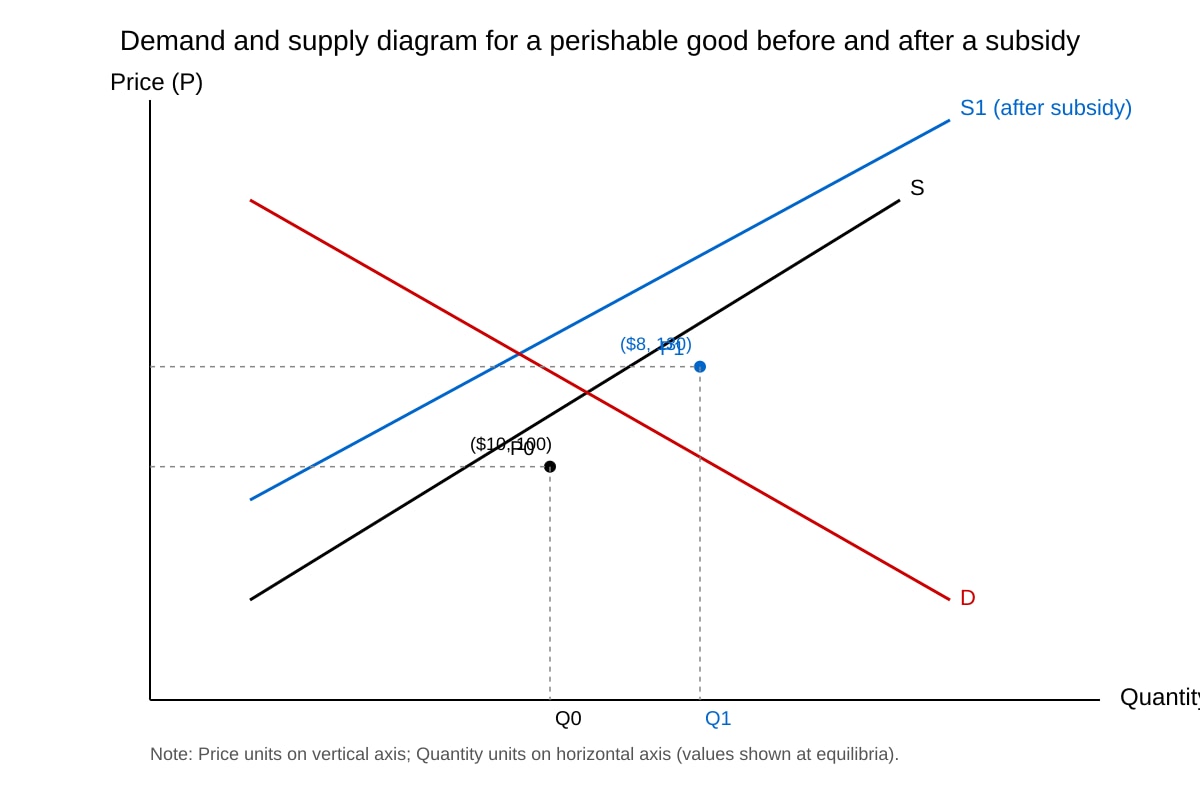
Image pending generation: diagram for Q12.
- Using Figure Q12-fig2, explain how the subsidy affects consumer expenditure on the perishable good. [2]
- Define the term “opportunity cost” and give one example from a government’s perspective in healthcare. [2]
- Using Extract 2, explain how a lack of substitutes affects total revenue for ride-hailing firms after the price rise. [2]
Section C: Macroeconomic & Policy Evaluation (Questions 15–20) [12 marks]
Extract 3: GDP and Unemployment (Country Z, 2020–2024)
| Year | Real GDP Growth (%) | Unemployment Rate (%) |
|---|---|---|
| 2020 | -5.0 | 4.5 |
| 2021 | 6.2 | 3.8 |
| 2022 | 4.1 | 3.2 |
| 2023 | 2.0 | 3.5 |
| 2024 | 1.5 | 3.9 |
Table 2: Macroeconomic indicators for Country Z.
- Using Table 2, describe the relationship between real GDP growth and unemployment rate in Country Z from 2020 to 2024. [2]
- With reference to Table 2, explain whether the standard of living in Country Z likely improved from 2020 to 2022. [2]
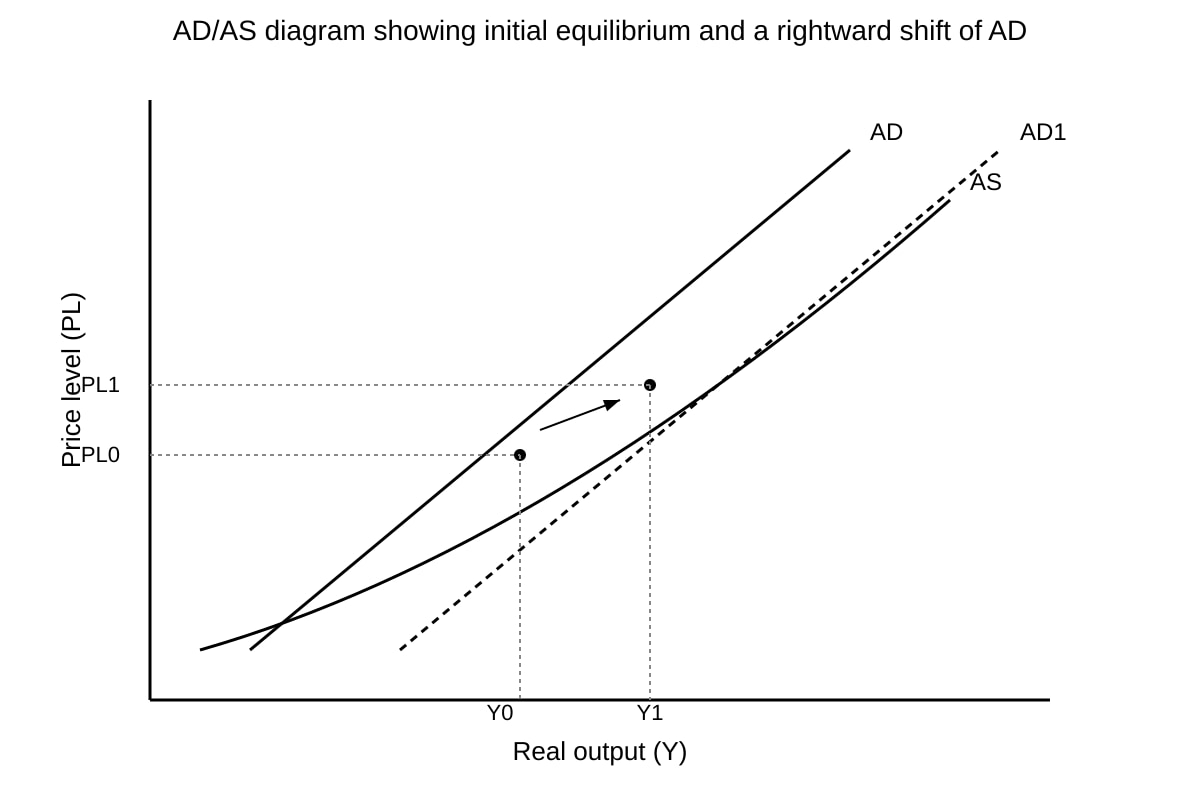
Image pending generation: graph for Q17.
- Using Figure Q17-fig3, explain how a rise in government spending may affect unemployment in Country Z. [2]
- Identify one microeconomic policy from syllabus that could correct a positive externality in education, and explain its effect. [2]
- Evaluate whether a maximum price on healthcare is effective in achieving equity. Use Extract 1 data in your answer. [2]
- Discuss one unintended consequence of heavy government intervention in the healthcare market. [2]
Answers
TuitionGoWhere Practice Paper - Economics H1 A-Level (Answers)
Version 3 of 5 — Answer Key
Section A: Data Interpretation (16 marks)
Q1 [2 marks]
- Both countries increased healthcare spending as % of GDP from 2020 to 2024. [1]
- Singapore rose from 4.1% to 5.0% (+0.9 pp) while Malaysia rose from 3.8% to 4.3% (+0.5 pp); Singapore consistently higher and increased faster. [1] Teaching note: Compare both series with magnitudes and use comparative language.
Q2 [2 marks]
- Increased every year from 4.1% (2020) to 5.0% (2024). [1]
- Rise was steady and accelerating slightly after 2021. [1] Teaching note: Direction + rate described with years.
Q3 [1 mark]
- 5.0 − 4.1 = 0.9 percentage points. [1]
Q4 [1 mark]
- Malaysia may have lower income per capita or prioritises other sectors (e.g., education) over healthcare. [1]
Q5 [2 marks]
- Both countries had falling inflation 2021→2022 then rising to 2024. [1]
- Country A inflation was consistently higher than B (e.g., 3.4% vs 2.2% in 2024). [1]
Q6 [2 marks]
- Higher share may mean less available for other sectors (opportunity cost). [1]
- Or: indicates ageing population raising fiscal burden. [1]
Q7 [1 mark]
- Does not show absolute spending or population size; PPP differences ignored. [1]
Q8 [3 marks]
- Singapore avg annual increase = (5.0−4.1)/4 = 0.225 pp/yr [1.5]
- Malaysia = (4.3−3.8)/4 = 0.125 pp/yr [1]
- Singapore larger. [0.5]
Section B: Microeconomic Data Response (12 marks)
Q9 [2 marks]
- PED = %ΔQd / %ΔP = (−24%) / (+15%) = −1.6 [2]
Q10 [2 marks]
- |PED| = 1.6 > 1 → demand is price elastic. [1]
- Consumers responsive to price change. [1]
Q11 [2 marks]
- Few substitutes → but 24% drop suggests necessity with limited alternatives yet responsive. [1]
- May be because long-run adjustments possible. [1]
Q12 [2 marks]
- Original CE = 10×100 = 1000; new = 8×130 = 1040. [1]
- Consumer expenditure rises from 1000 to 1040 due to subsidy. [1]
Q13 [2 marks]
- OC = next best forgone alternative. [1]
- E.g., building hospital means less funds for education. [1]
Q14 [2 marks]
- PED elastic → price rise reduces Qd by larger %, TR = P×Q falls. [1]
- With few substitutes, still lost revenue. [1]
Section C: Macroeconomic & Policy Evaluation (12 marks)
Q15 [2 marks]
- Negative relationship: GDP growth recovery 2021 coincides with falling unemployment. [1]
- 2023–24 slowdown with rising unemployment. [1]
Q16 [2 marks]
- Real GDP growth positive 2021–22, unemployment fell → likely improved. [1]
- But % GDP healthcare rise may burden households. [1]
Q17 [2 marks]
- AD↑ → Y↑ → firms hire more → unemployment falls. [1]
- Diagram shows Y0 to Y1. [1]
Q18 [2 marks]
- Subsidy on education → lowers cost, increases uptake (positive externality). [1]
- Corrects under-consumption. [1]
Q19 [2 marks]
- Max price improves equity by affordability (Extract 1: SG high spend). [1]
- But shortages, low quality possible. [1]
Q20 [2 marks]
- E.g., waiting lists, black market, inefficiency. [2 for any one explained]
Free quiz and exam paper access
Enter your details to view this paper
Your access is remembered on this device.