AI Generated Exam Paper
A Level H1 Economics Practice Paper 2
Free A Level H1 Econs Practice Paper 2, LongCat AI version, with questions, answers, and A Level-style practice for Singapore students.
These static practice materials are generated from the site's syllabus and paper-generation workflow, with source and model context shown so students and parents can evaluate the material before use.
Questions
TuitionGoWhere Practice Paper - Economics H1 A-Level
TuitionGoWhere Practice Paper (AI)
Subject: Economics H1 Level: A-Level Paper: Practice Paper — Data Response Duration: 1 hour 30 minutes Total Marks: 50 Name: ___________________________ Class: ___________________________ Date: ___________________________
Instructions
- Answer all questions in Section A and Section B.
- Read each case study carefully before attempting the questions.
- Where data is provided, you must reference the relevant table, figure, or extract in your answers.
- For questions requiring diagrams, draw clearly and label fully.
- Quality of written communication will be assessed in extended-response questions.
- The number of marks for each question is shown in brackets [ ].
Section A: Case Study 1 — Singapore's Labour Market and Inflation (25 marks)
Read the following case study and answer Questions 1–10.
Source A: Singapore's Unemployment Rate and CPI Inflation Rate, 2018–2023
Table 1: Selected Economic Indicators for Singapore
| Year | Overall Unemployment Rate (%) | CPI-All Items Inflation Rate (%) | Resident Unemployment Rate (%) | GDP Growth Rate (%) |
|---|---|---|---|---|
| 2018 | 2.1 | 0.4 | 2.9 | 3.4 |
| 2019 | 2.3 | 0.6 | 3.1 | 0.7 |
| 2020 | 3.0 | -0.2 | 4.1 | -5.4 |
| 2021 | 2.7 | 2.3 | 3.5 | 7.6 |
| 2022 | 2.1 | 6.1 | 2.7 | 3.6 |
| 2023 | 2.0 | 4.8 | 2.6 | 1.1 |
Source: Singapore Department of Statistics, MTI
Source B: Excerpt from Monetary Authority of Singapore (MAS) Policy Statement, October 2022
"The global economy has experienced a significant surge in inflationary pressures driven by supply chain disruptions, elevated energy prices, and strong post-pandemic demand recovery. In Singapore, the CPI-All Items inflation rate rose to 6.1% in 2022, the highest in over a decade. The MAS has responded by appreciating the Singapore dollar nominal effective exchange rate (S$NEER) policy band to moderate imported inflation. Meanwhile, the labour market has remained resilient, with the overall unemployment rate declining to 2.1% in 2022 despite the inflationary environment. However, resident unemployment at 2.7% suggests that Singaporean workers in certain sectors, particularly manufacturing and services, continue to face structural adjustment challenges."
Source C: Sectoral Employment Changes in Singapore, 2021–2023
Table 2: Change in Employment by Sector (Thousands)
| Sector | 2021 | 2022 | 2023 |
|---|---|---|---|
| Manufacturing | +5.2 | +3.1 | -1.8 |
| Construction | -3.5 | +8.2 | +6.4 |
| Services (excluding domestic) | +32.4 | +48.6 | +28.3 |
| - Financial Services | +4.1 | +5.8 | +3.2 |
| - Retail Trade | +2.8 | +6.1 | +1.4 |
| - Food & Beverages | +1.9 | +7.2 | +2.6 |
| - Information & Communications | +6.3 | +8.4 | +5.1 |
Source: Ministry of Manpower, Singapore
Question 1
With reference to Table 1, describe the trend in Singapore's overall unemployment rate from 2018 to 2023. [2 marks]
Question 2
With reference to Table 1, compare the resident unemployment rate with the overall unemployment rate from 2020 to 2023. Suggest one reason for the difference between the two rates. [3 marks]
Question 3
Using Table 1, identify the year in which Singapore experienced deflation. Explain what deflation means and state one consequence of deflation for the Singapore economy. [3 marks]
Question 4
With reference to Source B, explain how an appreciation of the Singapore dollar nominal effective exchange rate (S$NEER) can help to reduce imported inflation. [3 marks]
Question 5
Using Table 2, compare the employment changes in the Manufacturing sector and the Services sector (excluding domestic) from 2021 to 2023. [3 marks]
Question 6
With reference to Table 2, calculate the total employment change in the Services sector (excluding domestic) from 2021 to 2023. Show your working. [2 marks]
Question 7
Using evidence from Sources A and B, explain the likely type of inflation Singapore experienced in 2022. [4 marks]
Question 8
With reference to Table 1, explain the relationship between GDP growth and unemployment from 2020 to 2022. [3 marks]
Question 9
Using the information from all three sources, discuss whether the Singapore government should be more concerned about unemployment or inflation in 2023. Justify your answer. [2 marks]
Section B: Case Study 2 — Market Failure in the Palm Oil Industry (25 marks)
Read the following case study and answer Questions 10–20.
Source D: The Palm Oil Industry and Environmental Externalities
Palm oil is the world's most widely used vegetable oil, found in approximately 50% of packaged products in supermarkets. Global palm oil production has increased from 20 million tonnes in 1995 to over 75 million tonnes in 2023. Indonesia and Malaysia together account for approximately 85% of global production.
The rapid expansion of palm oil plantations has led to widespread deforestation in Southeast Asia. Between 2001 and 2020, Indonesia lost over 26 million hectares of forest, with palm oil cultivation being a leading driver. Deforestation contributes to biodiversity loss, increased carbon dioxide emissions, and air pollution from forest fires (haze).
The social cost of palm oil production includes:
- Loss of habitat for endangered species such as orangutans and Sumatran tigers
- Health costs from transboundary haze affecting millions in the region
- Displacement of indigenous communities
- Contribution to climate change through carbon emissions
Despite these negative externalities, palm oil remains highly economically productive. A single hectare of oil palm can produce up to 4 tonnes of oil per year, compared to 0.7 tonnes for rapeseed and 0.4 tonnes for soybeans. Palm oil directly employs over 6 million workers in Indonesia and Malaysia and supports the livelihoods of millions more smallholder farmers.
Source E: Market for Palm Oil
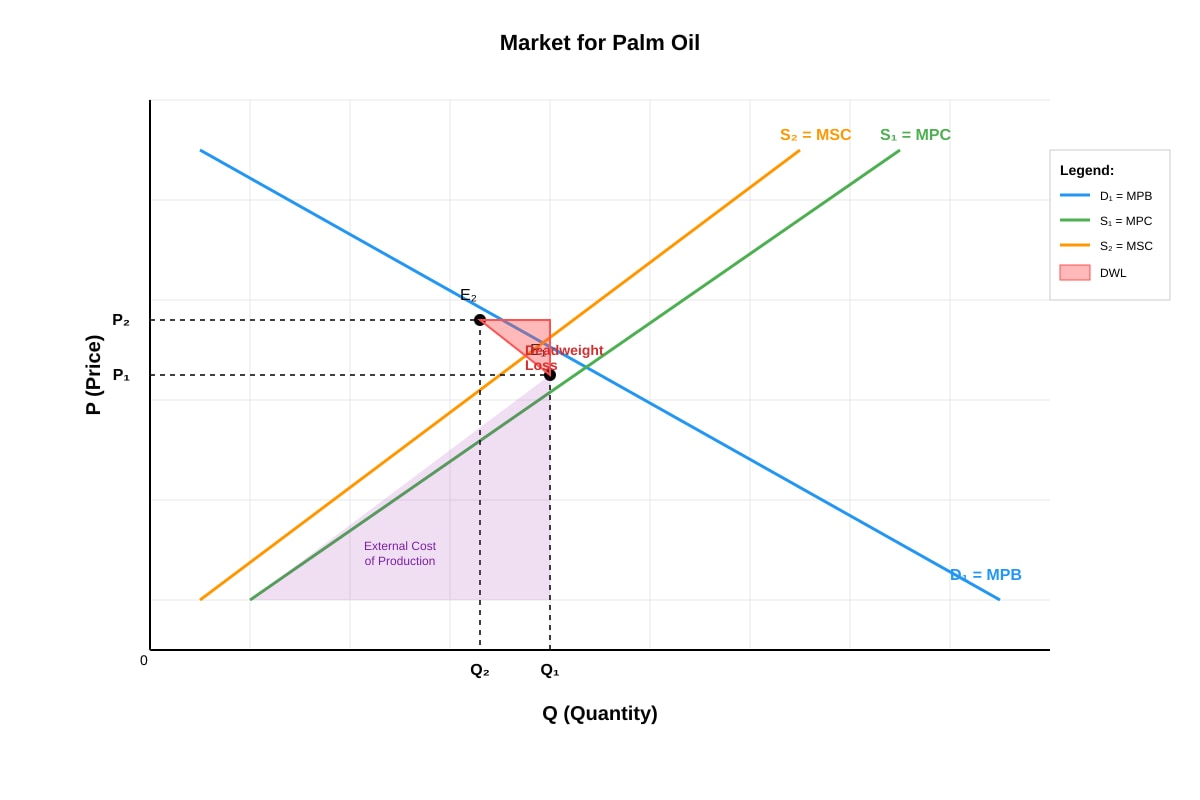
Generated graph for Q10.
Source F: Government Interventions in the Palm Oil Sector
Table 3: Government Policies in Selected Palm Oil Producing Countries
| Country | Policy Type | Description | Year Introduced |
|---|---|---|---|
| Indonesia | Moratorium | Temporary ban on new palm oil plantation permits in primary forests and peatlands | 2018 |
| Malaysia | Tax | Export tax on crude palm oil when prices exceed threshold | 2008 |
| Indonesia | Subsidy | Biodiesel mandate requiring 30% palm oil blend in diesel fuel (B30) | 2020 |
| EU | Regulation | Renewable Energy Directive limiting palm oil-based biofuels | 2019 |
| Malaysia | Regulation | Malaysian Sustainable Palm Oil (MSPO) certification mandatory for all producers | 2019 |
Question 10
With reference to the diagram in Source E, explain why the market equilibrium quantity (Q1) of palm oil is higher than the socially optimal quantity (Q2). [3 marks]
Question 11
Using Source D, identify two negative externalities associated with palm oil production. For each, explain why it represents a cost to third parties. [4 marks]
Question 12
With reference to Source D, explain why palm oil production might also generate a positive externality. [2 marks]
Question 13
Using Table 3, classify each government policy as either a market-based approach or a regulatory approach. Justify your classification for one of the policies. [3 marks]
Question 14
With reference to Table 3, explain how Indonesia's moratorium on new plantation permits might affect the supply of palm oil and its market price. [3 marks]
Question 15
Using a demand and supply diagram, illustrate and explain the likely impact of the EU's Renewable Energy Directive (limiting palm oil-based biofuels) on the market for palm oil. [4 marks]
Question 16
With reference to Source D, explain the concept of opportunity cost in the context of using land for palm oil cultivation instead of preserving forests. [2 marks]
Question 17
Using evidence from Sources D and F, evaluate the effectiveness of government intervention in correcting the market failure in the palm oil industry. In your answer, consider at least two different policies and discuss their likely strengths and limitations. [4 marks]
Question 18
Explain why palm oil might also be considered a merit good or a demerit good. Which classification do you think is more appropriate? Justify your answer. [3 marks]
Question 19
Using the concept of price elasticity of demand, explain how the effectiveness of Malaysia's export tax on crude palm oil depends on the PED for palm oil. [3 marks]
Question 20
Discuss whether the Singapore government should impose a tax on products containing palm oil sold in Singapore. Consider both the economic benefits and limitations of such a policy. [4 marks]
End of Practice Paper
This is an AI-generated practice paper by TuitionGoWhere. It is not an official past-year examination paper. Content is syllabus-aligned and designed for practice purposes.
Answers
TuitionGoWhere Practice Paper — Economics H1 A-Level
Answer Key and Marking Scheme
Paper: Practice Paper — Data Response Total Marks: 50
Section A: Case Study 1 — Singapore's Labour Market and Inflation
Question 1
Describe the trend in Singapore's overall unemployment rate from 2018 to 2023. [2 marks]
Answer:
- Singapore's overall unemployment rate rose from 2.1% in 2018 to a peak of 3.0% in 2020 [1 mark], before declining steadily to 2.0% in 2023 [1 mark].
Marking Notes:
- 1 mark for identifying the rise to a peak in 2020.
- 1 mark for identifying the subsequent decline to 2023.
- Award 1 mark if only one direction of change is described (partial answer).
- Do not award marks for simply restating data points without describing the trend.
Question 2
Compare the resident unemployment rate with the overall unemployment rate from 2020 to 2023. Suggest one reason for the difference between the two rates. [3 marks]
Answer:
- The resident unemployment rate was consistently higher than the overall unemployment rate throughout 2020–2023 [1 mark]. For example, in 2020 the resident rate was 4.1% compared to the overall rate of 3.0%, and in 2023 the resident rate was 2.6% compared to 2.0% [1 mark for a valid paired comparison].
- One reason: The overall unemployment rate includes non-residents (foreign workers) who may be more willing to accept lower wages or less desirable working conditions, or who may be repatriated during economic downturns, thus lowering the overall rate relative to the resident rate [1 mark].
Marking Notes:
- 1 mark for stating that resident unemployment is higher.
- 1 mark for a specific data comparison using figures from the table.
- 1 mark for a valid reason explaining the difference.
- Accept alternative valid reasons: e.g., foreign workers concentrated in sectors less affected by downturns; structural mismatch affecting residents more; non-residents leaving Singapore during recessions.
Question 3
Identify the year in which Singapore experienced deflation. Explain what deflation means and state one consequence of deflation for the Singapore economy. [3 marks]
Answer:
- Singapore experienced deflation in 2020, when the CPI-All Items inflation rate was -0.2% [1 mark].
- Deflation is a sustained decrease in the general price level of goods and services (negative inflation rate) [1 mark].
- One consequence: Deflation may lead to deferred consumption as consumers delay purchases in anticipation of further price falls, reducing aggregate demand and potentially worsening the economic downturn / or: Deflation increases the real value of debt, making it more burdensome for borrowers [1 mark].
Marking Notes:
- 1 mark for correctly identifying 2020.
- 1 mark for a correct definition of deflation (must refer to falling general price level, not just falling prices of one good).
- 1 mark for a valid consequence. Accept: deferred consumption, increased real debt burden, lower business profits leading to unemployment, deflationary spiral.
Question 4
Explain how an appreciation of the Singapore dollar nominal effective exchange rate (S$NEER) can help to reduce imported inflation. [3 marks]
Answer:
- An appreciation of the S$NEER means the Singapore dollar strengthens against a weighted basket of currencies of Singapore's main trading partners [1 mark].
- This makes imports cheaper in domestic currency terms, since fewer Singapore dollars are needed to purchase the same quantity of foreign goods [1 mark].
- Since Singapore is highly dependent on imports (especially food and raw materials), cheaper imported goods reduce the overall price level, thereby moderating imported inflation [1 mark].
Marking Notes:
- 1 mark for explaining what S$NEER appreciation means.
- 1 mark for linking appreciation to cheaper imports.
- 1 mark for connecting cheaper imports to lower inflation in Singapore's context.
- Students who mention that MAS manages the S$NEER through exchange rate policy should be credited.
Question 5
Compare the employment changes in the Manufacturing sector and the Services sector (excluding domestic) from 2021 to 2023. [3 marks]
Answer:
- The Services sector experienced consistently positive employment growth across all three years, increasing by 32,400 in 2021, 48,600 in 2022, and 28,300 in 2023 [1 mark].
- The Manufacturing sector experienced positive growth in 2021 (+5,200) and 2022 (+3,100), but saw a decline of 1,800 in 2023 [1 mark].
- Overall, the Services sector contributed far more to employment growth than Manufacturing, and while Manufacturing experienced a contraction in 2023, Services continued to add jobs, albeit at a slower rate than in 2022 [1 mark].
Marking Notes:
- 1 mark for describing the Services sector trend.
- 1 mark for describing the Manufacturing sector trend.
- 1 mark for a comparative statement highlighting the difference between the two sectors.
- Award partial marks if only one sector is described.
Question 6
Calculate the total employment change in the Services sector (excluding domestic) from 2021 to 2023. Show your working. [2 marks]
Answer:
- Working: 32,400 + 48,600 + 28,300 = 109,300 [1 mark for correct working, 1 mark for correct answer].
Marking Notes:
- 1 mark for showing the correct addition of all three years.
- 1 mark for the correct final answer of 109,300.
- Award 1 mark if the working is correct but the final arithmetic is wrong (error carried forward).
Question 7
Explain the likely type of inflation Singapore experienced in 2022. [4 marks]
Answer:
- Singapore likely experienced cost-push inflation in 2022 [1 mark].
- Source B states that inflationary pressures were driven by "supply chain disruptions" and "elevated energy prices" [1 mark for evidence from source].
- Supply chain disruptions increase the cost of production for firms (higher input costs), while elevated energy prices raise costs across the economy. These are supply-side factors that shift the short-run aggregate supply curve to the left, causing the price level to rise [1 mark for economic reasoning].
- Additionally, the strong post-pandemic demand recovery mentioned in Source B could have contributed to demand-pull inflation, but the primary drivers cited are supply-side factors, making cost-push the dominant type [1 mark for synthesis/evaluation].
Marking Notes:
- 1 mark for identifying cost-push inflation.
- 1 mark for referencing specific evidence from Source B.
- 1 mark for explaining the economic mechanism (SRAS shift / rising costs).
- 1 mark for acknowledging the dual nature or demonstrating evaluative reasoning.
- Accept "demand-pull" if well justified with reference to post-pandemic demand recovery, but cost-push is the stronger answer given the evidence.
Question 8
Explain the relationship between GDP growth and unemployment from 2020 to 2022. [3 marks]
Answer:
- In 2020, GDP growth was -5.4% (contraction) and unemployment rose to 3.0%, consistent with Okun's Law that a negative output gap is associated with higher unemployment [1 mark].
- In 2021, GDP grew strongly at 7.6% (recovery) and unemployment fell to 2.7%, showing that economic recovery led to job creation [1 mark].
- In 2022, GDP growth moderated to 3.6% and unemployment continued to fall to 2.1%, suggesting a lagged but continued positive relationship between economic growth and employment [1 mark].
Marking Notes:
- 1 mark for describing the 2020 relationship (negative growth, high unemployment).
- 1 mark for describing the 2021 recovery relationship.
- 1 mark for describing the 2022 relationship or for referencing Okun's Law / the inverse relationship.
- Award marks for demonstrating understanding of the inverse relationship between GDP growth and unemployment, even if Okun's Law is not explicitly named.
Question 9
Discuss whether the Singapore government should be more concerned about unemployment or inflation in 2023. Justify your answer. [2 marks]
Answer:
- In 2023, unemployment was at 2.0% (very low, near full employment), while inflation was at 4.8% (significantly above the historical average of ~1-2%) [1 mark for referencing data].
- The government should be more concerned about inflation in 2023, as it remained elevated and erodes consumers' purchasing power, disproportionately affecting lower-income households. Unemployment was already at a healthy level, suggesting the labour market was not the primary concern [1 mark for justified judgement].
Marking Notes:
- 1 mark for referencing relevant data from Table 1.
- 1 mark for a clear, justified conclusion.
- Accept the opposite view (unemployment) if well justified, e.g., if the student argues about structural unemployment or underemployment not captured by the headline figure.
Section B: Case Study 2 — Market Failure in the Palm Oil Industry
Question 10
Explain why the market equilibrium quantity (Q1) of palm oil is higher than the socially optimal quantity (Q2). [3 marks]
Answer:
- At the market equilibrium (Q1), the price P1 is determined by the intersection of marginal private cost (MPC) and marginal private benefit (MPB = demand) [1 mark].
- However, palm oil production generates negative externalities (deforestation, carbon emissions, haze), meaning the marginal social cost (MSC) exceeds the marginal private cost [1 mark].
- The socially optimal quantity Q2 occurs where MSC = MSB. Since MSC > MPC, the socially optimal quantity Q2 is less than Q1, meaning the market overproduces palm oil relative to the social optimum [1 mark].
Marking Notes:
- 1 mark for explaining market equilibrium using MPC and MPB.
- 1 mark for identifying that negative externalities cause MSC > MPC.
- 1 mark for concluding that Q2 < Q1 due to the divergence between private and social costs.
- The answer must reference the diagram (Source E) to receive full marks.
Question 11
Identify two negative externalities associated with palm oil production. For each, explain why it represents a cost to third parties. [4 marks]
Answer: Externality 1: Deforestation leading to increased carbon dioxide emissions and climate change [1 mark].
- This is a cost to third parties because climate change affects the entire global population through rising sea levels, extreme weather events, and health impacts, none of whom are compensated by palm oil producers [1 mark].
Externality 2: Transboundary haze from forest fires causing air pollution [1 mark].
- This is a cost to third parties because the haze affects the health of millions of people in neighbouring countries (Singapore, Malaysia, Thailand) who suffer respiratory problems and reduced visibility, without being compensated by the plantation companies [1 mark].
Marking Notes:
- 1 mark for each correctly identified negative externality (2 marks total).
- 1 mark for each explanation of why it is a cost to third parties (2 marks total).
- Accept other valid externalities from Source D: biodiversity loss, displacement of indigenous communities.
- The explanation must clearly identify who the third parties are and how they are affected.
Question 12
Explain why palm oil production might also generate a positive externality. [2 marks]
Answer:
- Palm oil production generates employment for over 6 million workers in Indonesia and Malaysia and supports the livelihoods of millions of smallholder farmers [1 mark].
- These workers and their families benefit from income, skills development, and improved standards of living, which are positive spillover effects not captured in the market price of palm oil. Additionally, the economic development in rural areas may lead to improved infrastructure and services for the wider community [1 mark].
Marking Notes:
- 1 mark for identifying a positive externality (employment, rural development, economic growth).
- 1 mark for explaining why it is a positive spillover effect benefiting third parties.
- Accept: palm oil is highly productive per hectare, meaning less land is needed compared to alternatives, potentially reducing overall environmental impact (if well argued).
Question 13
Classify each government policy as either a market-based approach or a regulatory approach. Justify your classification for one of the policies. [3 marks]
Answer:
| Country | Policy | Classification |
|---|---|---|
| Indonesia | Moratorium | Regulatory |
| Malaysia | Export tax | Market-based |
| Indonesia | Biodiesel mandate (B30) | Regulatory |
| EU | Renewable Energy Directive | Regulatory |
| Malaysia | MSPO certification | Regulatory |
[1 mark for at least 3 correct classifications out of 5.]
Justification (example):
- Malaysia's export tax is a market-based approach because it uses a price mechanism (tax) to alter the relative price of palm oil exports, thereby influencing the behaviour of producers and consumers through market signals rather than direct prohibition [2 marks].
Marking Notes:
- 1 mark for correct classifications (at least 3 out of 5).
- 2 marks for a clear justification of one policy, explaining why it is market-based or regulatory.
- Accept alternative justifications for any of the policies.
- The biodiesel mandate could be argued as either; accept with valid reasoning.
Question 14
Explain how Indonesia's moratorium on new plantation permits might affect the supply of palm oil and its market price. [3 marks]
Answer:
- The moratorium restricts the creation of new palm oil plantations, limiting the expansion of palm oil production capacity [1 mark].
- This would cause the supply curve for palm oil to shift to the left (or reduce the rightward shift of supply over time), as fewer new plantations can be established [1 mark].
- With supply constrained and demand unchanged (or growing), the equilibrium price of palm oil would rise [1 mark].
Marking Notes:
- 1 mark for explaining the restriction on new plantations.
- 1 mark for linking this to a leftward shift in supply (or reduced supply growth).
- 1 mark for concluding that the price would rise.
- Award 1 mark if the student draws a correct diagram without explanation.
Question 15
Using a demand and supply diagram, illustrate and explain the likely impact of the EU's Renewable Energy Directive on the market for palm oil. [4 marks]
Answer:
- The EU's directive limiting palm oil-based biofuels reduces the demand for palm oil from EU countries, as palm oil can no longer be used as readily in biofuel production [1 mark].
- This causes the demand curve for palm oil to shift to the left (from D1 to D2) [1 mark — or 1 mark for a correctly drawn diagram showing leftward demand shift].
- The new equilibrium shows a lower price (P2 < P1) and a lower quantity (Q2 < Q1) [1 mark].
- Diagram: A standard demand-supply diagram with D1 shifting left to D2, S unchanged, showing new equilibrium at lower P and Q [1 mark for correct diagram].
<image_placeholder> id: Q15-ans-fig1 type: graph linked_question: Q15 description: Demand and supply diagram for palm oil market showing the impact of the EU directive. Initial demand curve D1 and supply curve S intersect at equilibrium P1, Q1. Demand curve shifts left to D2, creating new equilibrium at P2, Q2 where P2 < P1 and Q2 < Q1. labels: P (price, vertical axis), Q (quantity of palm oil, horizontal axis), D1, D2, S, P1, P2, Q1, Q2 values: P2 < P1, Q2 < Q1 must_show: Leftward shift of demand curve, original and new equilibrium points, all curves and axes labelled </image_placeholder>
Marking Notes:
- 1 mark for explaining reduced demand from EU.
- 1 mark for identifying leftward demand shift.
- 1 mark for stating lower equilibrium price and quantity.
- 1 mark for a correctly drawn and labelled diagram.
- Award 3 marks maximum if no diagram is drawn.
Question 16
Explain the concept of opportunity cost in the context of using land for palm oil cultivation instead of preserving forests. [2 marks]
Answer:
- Opportunity cost is the value of the next best alternative forgone when a choice is made [1 mark].
- When land is used for palm oil cultivation, the opportunity cost is the environmental benefits that the preserved forest would have provided, such as carbon sequestration, biodiversity conservation, clean air, and protection of indigenous communities' livelihoods [1 mark].
Marking Notes:
- 1 mark for a correct definition of opportunity cost.
- 1 mark for applying it specifically to the palm oil vs. forest context.
- Accept other valid examples of what is forgone (e.g., ecotourism revenue, flood prevention services).
Question 17
Evaluate the effectiveness of government intervention in correcting the market failure in the palm oil industry. Consider at least two different policies and discuss their likely strengths and limitations. [4 marks]
Answer:
Policy 1: Indonesia's Moratorium (Regulatory)
- Strength: Directly prevents further deforestation by legally prohibiting new plantations in primary forests and peatlands, addressing the root cause of the negative externality [1 mark].
- Limitation: It is temporary and does not address existing plantations. Enforcement is challenging in remote areas, and illegal clearing may continue. It may also reduce the income of smallholder farmers who depend on expansion [1 mark — accept any one valid limitation].
Policy 2: Malaysia's Export Tax (Market-based)
- Strength: Raises the cost of exporting palm oil when prices are high, which can reduce production incentives and generate government revenue that could be used for environmental conservation [1 mark].
- Limitation: The tax only applies when prices exceed a threshold, so it may be ineffective during periods of low prices. It may also reduce the competitiveness of Malaysian palm oil in global markets, leading to a loss of market share to Indonesia [1 mark — accept any one valid limitation].
Marking Notes:
- Award 1 mark for each valid strength or limitation, up to 4 marks.
- Must discuss at least two different policies for full marks.
- Award a maximum of 3 marks if only one policy is discussed.
- Award a maximum of 2 marks if only strengths or only limitations are discussed.
- Accept discussion of any policies from Table 3.
Question 18
Explain why palm oil might also be considered a merit good or a demerit good. Which classification do you think is more appropriate? Justify your answer. [3 marks]
Answer:
- Palm oil could be considered a demerit good because consumers may underestimate the negative health effects of excessive consumption (high saturated fat content linked to cardiovascular disease) and the environmental damage caused by its production [1 mark].
- Alternatively, palm oil could be considered a merit good because it is an affordable source of nutrition (rich in vitamin E and calories) that benefits consumers, and its high yield per hectare means it can feed more people with less land compared to alternatives [1 mark].
- Demerit good is more appropriate because the negative externalities (environmental damage, health costs) and information asymmetry (consumers not fully aware of the environmental and health costs) are more significant characteristics of palm oil than its merit good qualities. The market failure arising from negative externalities is the dominant concern [1 mark for justified judgement].
Marking Notes:
- 1 mark for explaining the demerit good argument.
- 1 mark for explaining the merit good argument.
- 1 mark for a clear, justified conclusion.
- Accept the opposite view (merit good) if well justified.
Question 19
Explain how the effectiveness of Malaysia's export tax on crude palm oil depends on the PED for palm oil. [3 marks]
Answer:
- Price elasticity of demand (PED) measures the responsiveness of quantity demanded to a change in price [1 mark].
- If demand for palm oil is price inelastic (|PED| < 1), an export tax that raises the price will lead to a proportionally smaller decrease in quantity demanded. This means the tax will be effective at raising government revenue and will not significantly reduce the quantity of palm oil produced and exported [1 mark].
- If demand for palm oil is price elastic (|PED| > 1), the tax would cause a proportionally larger fall in quantity demanded, making it more effective at reducing production (and thus negative externalities) but less effective at raising revenue, as exports would fall significantly [1 mark].
Marking Notes:
- 1 mark for defining PED.
- 1 mark for explaining the inelastic demand scenario.
- 1 mark for explaining the elastic demand scenario.
- Award 2 marks if only one scenario is discussed but in depth.
Question 20
Discuss whether the Singapore government should impose a tax on products containing palm oil sold in Singapore. Consider both the economic benefits and limitations of such a policy. [4 marks]
Answer:
Benefits:
- A tax on palm oil products would increase the price to consumers, reflecting the negative externalities (deforestation, carbon emissions) associated with palm oil production. This internalises the externality and reduces consumption towards the socially optimal level [1 mark].
- The tax revenue could be used to fund environmental conservation efforts or subsidise sustainable alternatives [1 mark — accept any one valid benefit].
Limitations:
- Singapore is a small country and a minor consumer of palm oil globally, so a domestic tax would have negligible impact on global palm oil demand and production. The negative externality is a global problem requiring international cooperation [1 mark].
- A tax would raise the prices of many everyday products (food, cosmetics, cleaning products), disproportionately affecting lower-income households. It may also be difficult to administer, as palm oil is present in a vast range of products and may be listed under different names on ingredient labels [1 mark — accept any one valid limitation].
Marking Notes:
- Award 1 mark for each valid benefit or limitation, up to 4 marks.
- Must discuss at least one benefit AND one limitation for full marks.
- Award a maximum of 2 marks if only benefits or only limitations are discussed.
- Accept alternative valid arguments, e.g., regressive nature of the tax, difficulty of enforcement, potential for substitution to other vegetable oils that may also have environmental costs.
End of Answer Key
Total Marks: 50
| Section | Topic | Marks |
|---|---|---|
| A | Singapore's Labour Market and Inflation | 25 |
| B | Market Failure in the Palm Oil Industry | 25 |
| Total | 50 |
This answer key is for the AI-generated TuitionGoWhere Practice Paper. It is not an official marking scheme from any examination board.
Free quiz and exam paper access
Enter your details to view this paper
Your access is remembered on this device.