AI Generated Exam Paper
A Level H1 Economics Practice Paper 2
Free A Level H1 Econs Practice Paper 2, HY3 AI version, with questions, answers, and A Level-style practice for Singapore students.
These static practice materials are generated from the site's syllabus and paper-generation workflow, with source and model context shown so students and parents can evaluate the material before use.
Questions
Free quiz and exam paper access
Enter your details to view this paper
Your access is remembered on this device.
Answers
TuitionGoWhere Practice Paper — Economics H1 A-Level (Version 2) Answer Key
Total Marks: 40
Section A: Data Interpretation from Tables (14 marks)
Q1 [2 marks]
Answer: Both health and education spending increased from 2020 to 2024. Health spending rose from 17.5b (increase of 13.8b to 1.6b, about 11.6%). Health grew faster.
Marking: 1 mark for stating both increased with values; 1 mark for comparison of rate (health faster).
Teaching note: Always reference the table and use comparative language ("whereas", "faster than").
Q2 [2 marks]
Working: Population 2020 = 5.69m, 2024 = 6.04m.
% increase = ((6.04 - 5.69) / 5.69) × 100 = (0.35 / 5.69) × 100 ≈ 6.15%.
Answer: ≈ 6.15%.
Marking: 1 mark for correct subtraction and division; 1 mark for correct percentage.
Common mistake: Using wrong base year.
Q3 [2 marks]
Answer: Education spending showed a steady upward trend from 15.4b in 2024, with small yearly increases (e.g., 0.3b, 0.5b).
Marking: 1 mark direction; 1 mark reference to data points.
Q4 [2 marks]
2020: 13.2b / 5.69m = 2,895 per capita.
Answer: Health spending per capita rose from about 2,895.
Marking: 1 mark each year correct.
Q5 [1 mark]
Answer: Ageing population may raise health needs more than education. (Any plausible reason from trend.)
Q6 [2 marks]
Total = Health + Education: 2020=27.0, 2021=28.1, 2022=29.3, 2023=31.1, 2024=32.9. Yes, rose each year.
Marking: 1 mark calculation of totals; 1 mark conclusion.
Q7 [1 mark]
Answer: 2024 gap = 17.5 - 15.4 = 2.1; 2020 gap = 0.6. Smallest gap in 2020.
Section B: Graph and Diagram Interpretation (12 marks)
Q8 [2 marks]
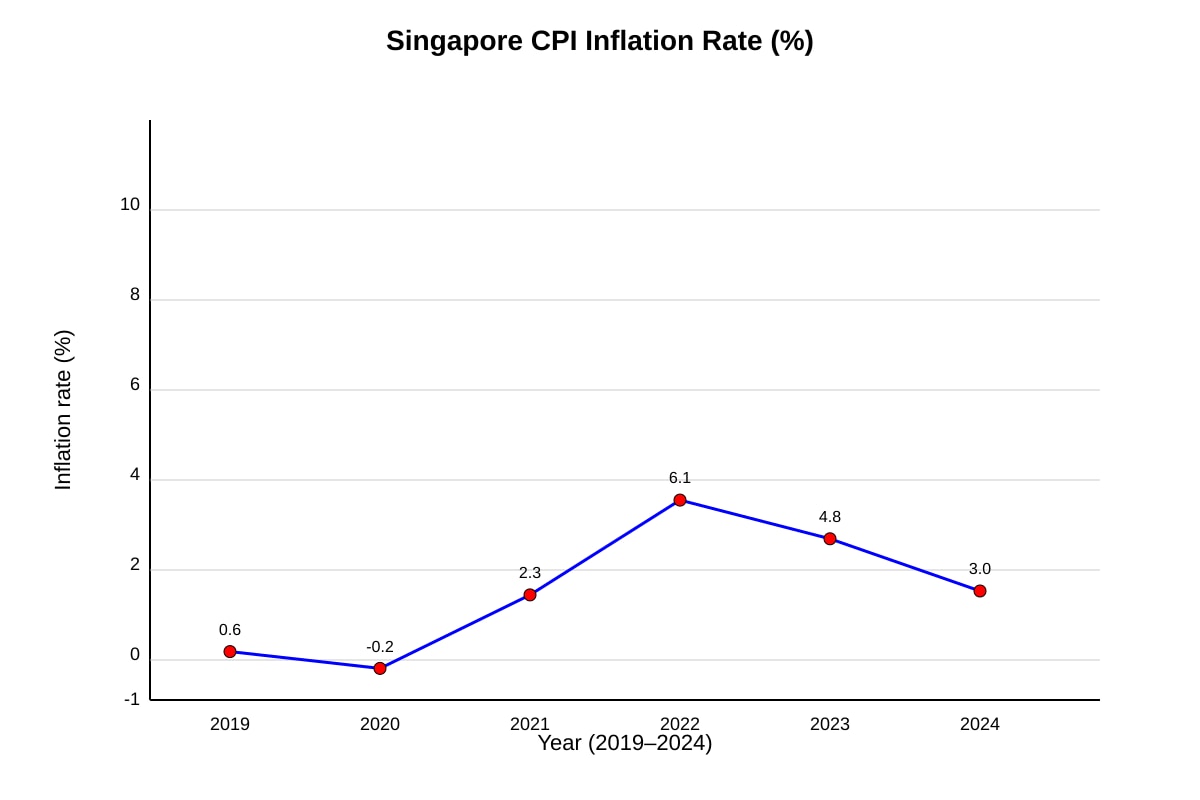
Answer: Inflation was low in 2019 (0.6%), turned negative in 2020 (-0.2%), then rose sharply to 6.1% by 2022, before moderating to 4.8% (2023) and 3.0% (2024).
Marking: 1 mark for describing dip and peak; 1 mark for later moderation.
Q9 [2 marks]
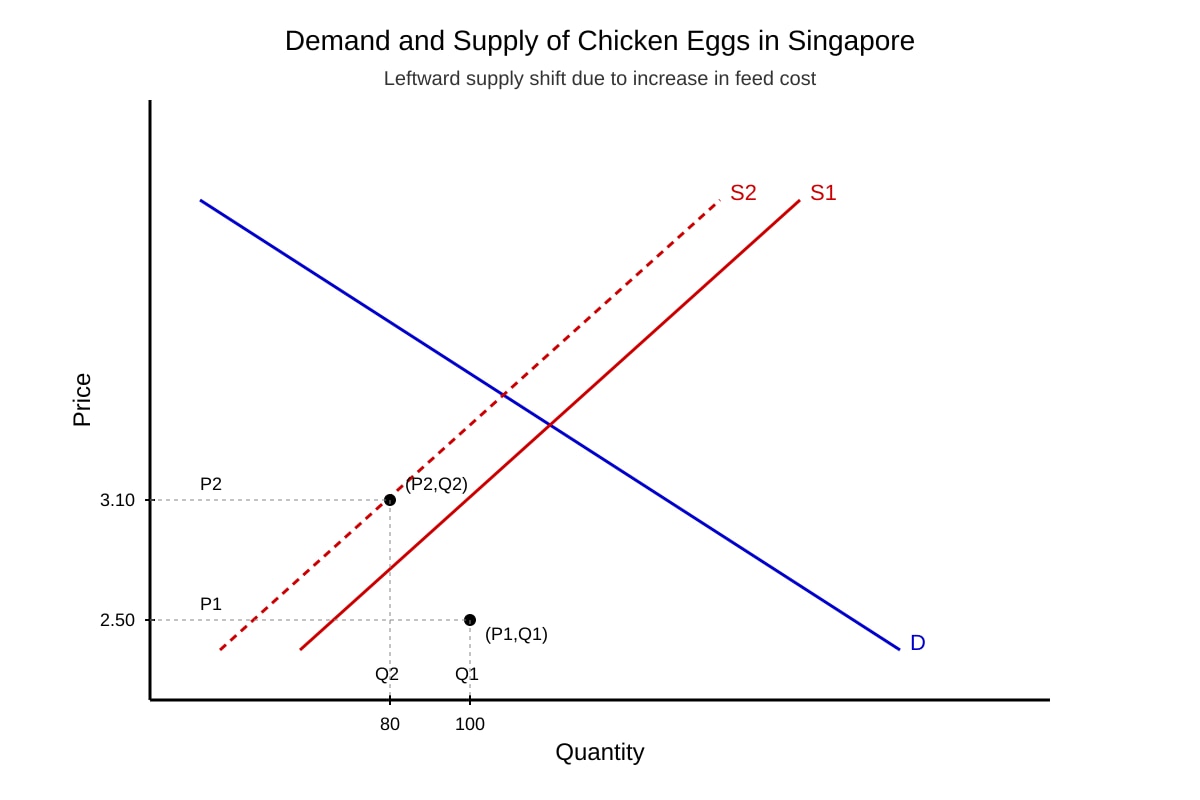
Answer: Leftward supply shift (S1→S2) raises equilibrium price from P1=3.10 and lowers quantity from Q1=100 to Q2=80. Higher feed cost reduces supply.
Marking: 1 mark price up; 1 mark quantity down with reasoning.
Q10 [2 marks]
Answer: Movement from inside PPC to on PPC shows economy moving from unemployment/under-utilisation to full employment of resources, improving productive efficiency.
Marking: 1 mark full employment; 1 mark efficiency.
Q11 [2 marks]
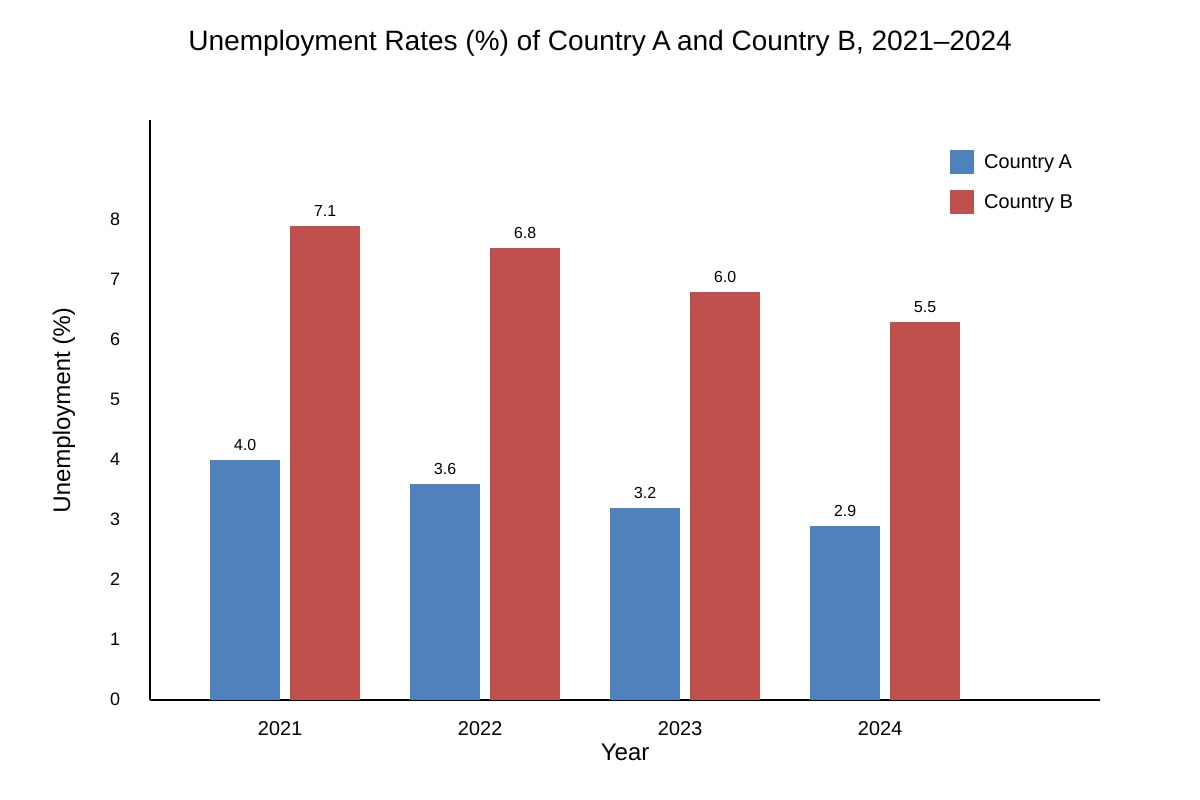
Answer: Country A unemployment fell from 4.0% to 2.9%; Country B from 7.1% to 5.5%. B consistently higher than A; both declined.
Marking: 1 mark each country trend.
Q12 [1 mark]
Answer: B may have less flexible labour market or lower AD.
Q13 [3 marks]
Answer: Population grew 5.69m→6.04m (Extract 1), increasing consumer demand; this may add demand-pull pressure, but inflation fell after 2022 (Fig Q8) due to global easing. Link: more people can raise demand but supply factors dominated.
Marking: 1 mark pop ref, 1 mark inflation ref, 1 mark reasoned link.
Section C: Source-Based Evaluation (14 marks)
Q14 [1 mark]
15% - 8% = 7 percentage points.
Q15 [2 marks]
Intended: Reduce carbon emissions via higher EV adoption (8%→15%).
Marking: 1 mark identify, 1 mark extract link.
Q16 [2 marks]
Unintended: Emissions fell only marginally due to fossil fuel electricity; or inequity as rich benefit.
Marking: 1 mark identify, 1 mark explain.
Q17 [2 marks]
Subsidy lowers producer costs → supply shifts right → lower price, higher Q of EVs.
Marking: 1 mark shift; 1 mark outcome.
Q18 [3 marks]
Answer: Not fully equitable: most buyers high-income (Extract 2), so subsidy regressive. But EV adoption rose. Evaluate: benefit narrow, cost broad.
Marking: 1 mark use extract, 1 mark concept equity, 1 mark evaluation.
Q19 [2 marks]
Alternative: Carbon tax on all vehicles; or improve public transport. Evaluate: broader impact, less regressive.
Marking: 1 mark policy, 1 mark reasoning.
Q20 [2 marks]
Answer: Numbers show adoption rise; text shows why emissions marginal and equity issue. Both needed for full evaluation.
Marking: 1 mark each source type.