AI Generated Exam Paper
A Level H1 Economics Practice Paper 1
Free A Level H1 Econs Practice Paper 1, LongCat AI version, with questions, answers, and A Level-style practice for Singapore students.
These static practice materials are generated from the site's syllabus and paper-generation workflow, with source and model context shown so students and parents can evaluate the material before use.
Questions
TuitionGoWhere Practice Paper - Economics H1 A-Level
TuitionGoWhere Practice Paper (AI)
Subject: Economics H1
Level: A-Level
Paper: Practice Paper — Data Response
Duration: 1 hour 30 minutes
Total Marks: 60
Version: 1 of 5
Name: ________________________
Class: ________________________
Date: ________________________
Instructions
- Answer all questions in the spaces provided.
- Read each source carefully before answering.
- Use economic terminology where appropriate.
- Show all working for calculation questions.
- Quality of written communication will be assessed in extended-response questions.
- You are advised to spend approximately 90 minutes on this paper.
Section A: Data Interpretation (20 marks)
Answer all questions in this section. Refer to the data provided.
Source 1: Singapore and Selected Economies — Key Indicators (2019–2023)
Table 1: Real GDP Growth Rate (%)
| Economy | 2019 | 2020 | 2021 | 2022 | 2023 |
|---|---|---|---|---|---|
| Singapore | 1.3 | −5.4 | 7.6 | 3.6 | 1.1 |
| Malaysia | 4.4 | −5.6 | 3.1 | 8.7 | 3.7 |
| South Korea | 2.2 | −0.7 | 4.3 | 2.6 | 1.4 |
| Thailand | 2.1 | −6.2 | 1.5 | 2.6 | 1.9 |
Source: Adapted from IMF World Economic Outlook, 2024
Table 2: Consumer Price Index (CPI) Inflation Rate (%)
| Economy | 2019 | 2020 | 2021 | 2022 | 2023 |
|---|---|---|---|---|---|
| Singapore | 0.6 | −0.2 | 2.3 | 6.1 | 4.8 |
| Malaysia | 0.7 | −1.2 | 2.5 | 3.4 | 2.5 |
| South Korea | 0.4 | 0.5 | 2.5 | 5.1 | 3.6 |
| Thailand | 0.7 | −0.8 | 1.2 | 6.1 | 1.2 |
Source: Adapted from national statistics offices, 2024
Question 1
With reference to Table 1, compare the real GDP growth rate of Singapore and Malaysia from 2019 to 2023.
(4 marks)
Question 2
Describe the trend in Singapore's real GDP growth rate from 2019 to 2023. Identify the year with the most significant change and suggest one possible reason for this change.
(4 marks)
Question 3
With reference to Table 2, compare the inflation experience of South Korea and Thailand from 2020 to 2023.
(4 marks)
Question 4
Using data from both Table 1 and Table 2, identify one economy that experienced both a sharp fall in real GDP growth and a significant rise in inflation between 2020 and 2022. Briefly explain why these two trends might occur simultaneously.
(4 marks)
Question 5
Calculate the percentage-point change in Singapore's real GDP growth rate from 2020 to 2021. Show your working.
(2 marks)
Question 6
Based on Table 1, which economy showed the most volatile real GDP growth over the period 2019–2023? Justify your answer using data from the table.
(2 marks)
Section B: Source-Based Analysis (25 marks)
Answer all questions in this section. Refer to the source material provided.
Source 2: The Singapore Government's Fiscal Response to COVID-19
In response to the economic disruption caused by the COVID-19 pandemic, the Singapore Government introduced five Budgets between February 2020 and March 2021, committing a total of approximately S100billioninfiscalsupport.KeymeasuresincludedtheJobsSupportScheme(JSS),whichco−fundedupto754,600 of gross monthly wages for local workers, and the Self-Employed Person Income Relief Scheme (SIRS), which provided direct cash payouts to eligible self-employed individuals.
The government also introduced rental relief for small and medium enterprises (SMEs), wage credit schemes to encourage firms to retain older workers, and enhanced training subsidies to support workforce reskilling. These measures were designed to preserve jobs, support household incomes, and maintain business continuity during the circuit breaker period and subsequent phased reopening.
Despite these efforts, Singapore's real GDP contracted by 5.4% in 2020, the worst recession since independence. The unemployment rate rose from 2.3% in 2019 to 3.0% in 2020, while the overall budget deficit widened to approximately 13.9% of GDP. The government drew on past reserves for the second consecutive year, having also tapped reserves in 2020's earlier Budgets.
By 2021, the economy rebounded strongly with real GDP growth of 7.6%, supported by the global recovery in electronics demand and the gradual easing of domestic restrictions. However, the recovery was uneven across sectors: the manufacturing sector grew by 13.2%, while the accommodation and food services sector continued to contract by 6.9%.
Source: Adapted from Ministry of Finance, Singapore Budget 2021; MTI Economic Survey of Singapore, 2021
Question 7
With reference to Source 2, identify two fiscal policy measures introduced by the Singapore Government in response to COVID-19 and explain how each measure aimed to support the economy.
(4 marks)
Question 8
Using information from Source 2, explain why the Singapore Government's fiscal response to COVID-19 could be described as expansionary fiscal policy.
(3 marks)
Question 9
Source 2 states that the recovery in 2021 was "uneven across sectors." Using evidence from the source, explain what this means and suggest one reason why the accommodation and food services sector continued to contract while manufacturing grew.
(4 marks)
Question 10
The source mentions that the government "drew on past reserves." Explain one advantage and one disadvantage of a government drawing on past reserves to finance a budget deficit.
(4 marks)
Question 11
Using a well-labelled aggregate demand and aggregate supply (AD/AS) diagram, illustrate and explain how the COVID-19 pandemic could have caused Singapore's real GDP to contract in 2020.
(6 marks)
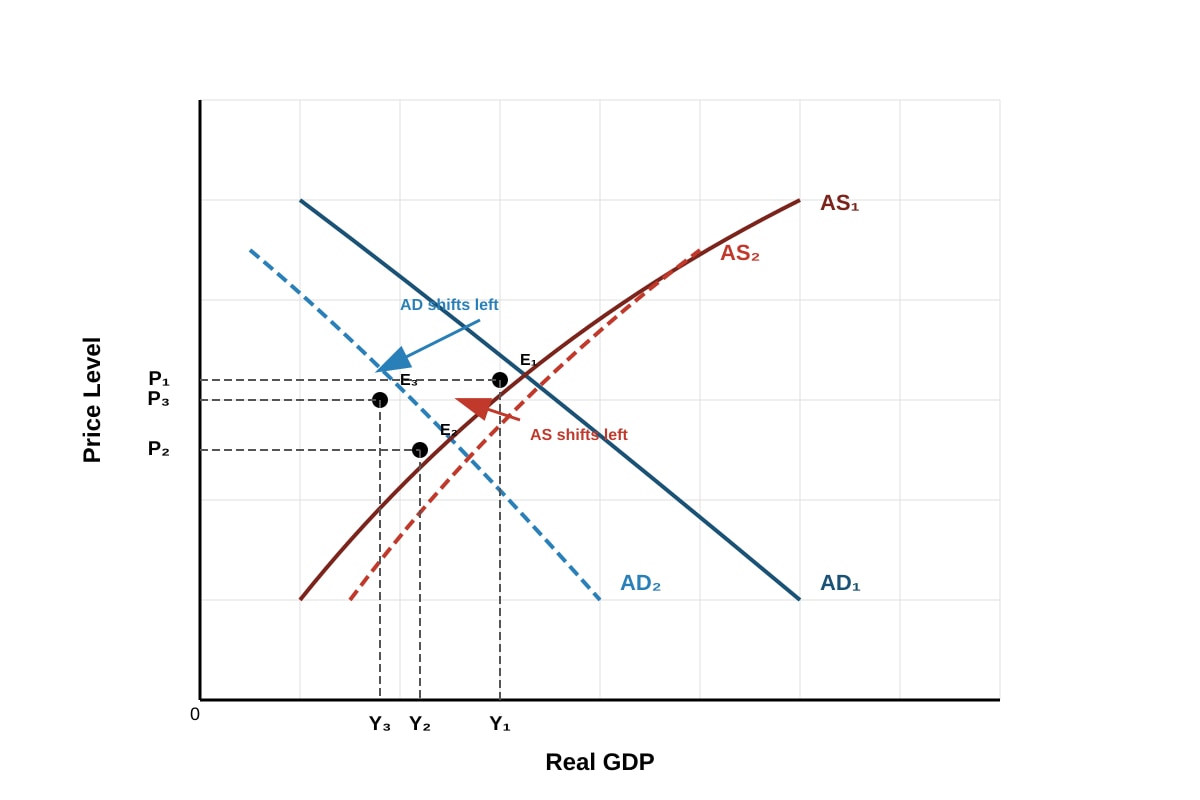
Generated diagram for Q11.
Question 12
Evaluate the effectiveness of the Jobs Support Scheme (JSS) as a policy measure to reduce unemployment during the COVID-19 pandemic. Consider both short-term and long-term perspectives in your answer.
(4 marks)
Section C: Extended Response (15 marks)
Answer the question in this section.
Question 13
In 2022, Singapore experienced a significant rise in inflation, with the CPI inflation rate reaching 6.1%. The Monetary Authority of Singapore (MAS) responded by tightening monetary policy through a series of appreciations of the Singapore dollar nominal effective exchange rate (S$NEER) policy band.
(a) Explain two possible causes of the rise in Singapore's inflation rate in 2022.
(4 marks)
(b) Using a well-labelled AD/AS diagram, illustrate and explain how a tightening of monetary policy (appreciation of the Singapore dollar) could help to reduce inflation.
(6 marks)
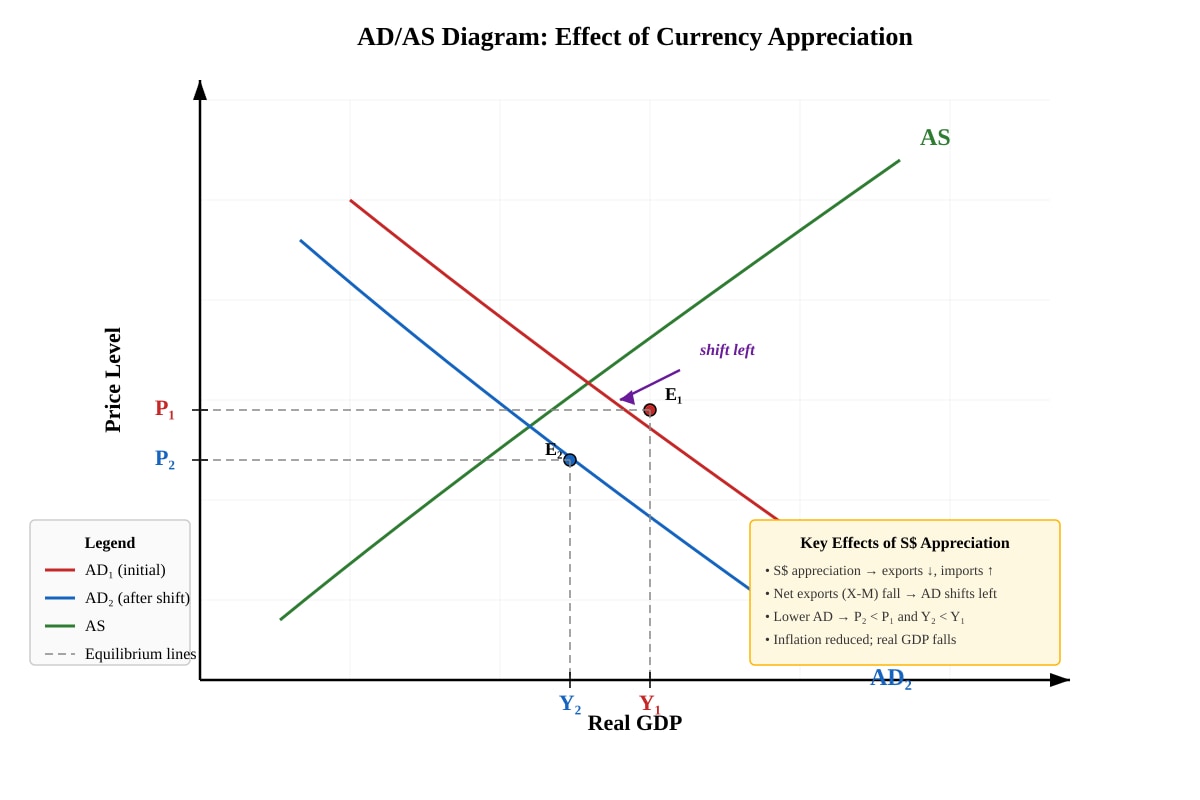
Generated diagram for Q13.
(c) Discuss whether monetary policy alone is sufficient to control inflation in Singapore, or whether the government should also use fiscal policy. Consider the strengths and limitations of each approach.
(5 marks)
End of Practice Paper
Answers
TuitionGoWhere Practice Paper — Economics H1 A-Level
Answer Key and Marking Scheme
Version 1 of 5 | Total Marks: 60
Section A: Data Interpretation (20 marks)
Question 1 — 4 marks
Question: With reference to Table 1, compare the real GDP growth rate of Singapore and Malaysia from 2019 to 2023.
Marking Scheme:
| Marks | Descriptor |
|---|---|
| 1 | Correct identification of data for both economies in at least one year |
| 1 | Correct identification of data for both economies in a second year or period |
| 1 | Use of comparative language (e.g., "whereas," "in contrast," "both," "while") |
| 1 | Valid comparison of the overall pattern or magnitude of change |
Model Answer:
Both Singapore and Malaysia experienced a contraction in real GDP growth in 2020, with Singapore recording −5.4% and Malaysia −5.6% [1 mark]. Both economies recovered in 2021, but Singapore's recovery was stronger at 7.6% compared to Malaysia's 3.1% [1 mark]. In 2022, Malaysia's growth accelerated to 8.7%, significantly higher than Singapore's 3.6%, whereas in 2023 both economies converged at similar growth rates of 1.1% and 3.7% respectively [1 mark]. Overall, Malaysia's growth was more robust in the post-pandemic recovery years (2022–2023), while Singapore experienced a sharper but shorter-lived rebound in 2021 [1 mark].
Common Mistakes:
- Simply listing data points for each year without using comparative language.
- Only describing one economy without comparing it to the other.
- Failing to reference the table explicitly.
Question 2 — 4 marks
Question: Describe the trend in Singapore's real GDP growth rate from 2019 to 2023. Identify the year with the most significant change and suggest one possible reason for this change.
Marking Scheme:
| Marks | Descriptor |
|---|---|
| 1 | Correct description of the overall trend (fluctuation/contraction and recovery) |
| 1 | Identification of the year with the most significant change (2020 or 2020–2021) |
| 1 | Accurate data reference to support the identified change |
| 1 | Plausible reason linked to economic events |
Model Answer:
Singapore's real GDP growth rate fluctuated significantly over the period. It fell from 1.3% in 2019 to −5.4% in 2020, before rebounding sharply to 7.6% in 2021, then moderating to 3.6% in 2022 and 1.1% in 2023 [1 mark]. The most significant change occurred between 2020 and 2021, when growth swung from −5.4% to +7.6%, a change of 13.0 percentage points [1 mark]. This dramatic reversal was due to the economy emerging from the COVID-19 pandemic recession in 2020, followed by a strong recovery in 2021 driven by the global surge in electronics demand and the easing of domestic restrictions [1 mark]. The initial contraction in 2020 was caused by the circuit breaker measures and global supply chain disruptions that severely reduced economic activity [1 mark].
Common Mistakes:
- Describing the trend without specific data references.
- Identifying the wrong year for the most significant change.
- Providing a reason that is not economically plausible or not linked to the data.
Question 3 — 4 marks
Question: With reference to Table 2, compare the inflation experience of South Korea and Thailand from 2020 to 2023.
Marking Scheme:
| Marks | Descriptor |
|---|---|
| 1 | Correct data reference for both economies in at least one year |
| 1 | Correct data reference for both economies in a second year |
| 1 | Use of comparative language |
| 1 | Valid comparison of overall pattern or magnitude |
Model Answer:
Both South Korea and Thailand experienced low or negative inflation in 2020, with South Korea at 0.5% and Thailand at −0.8% [1 mark]. Both economies saw inflation rise significantly in 2021 and peak in 2022, with South Korea reaching 5.1% and Thailand reaching 6.1% [1 mark]. In 2023, both experienced a decline in inflation, but Thailand's inflation fell more sharply to 1.2% compared to South Korea's 3.6% [1 mark]. Overall, Thailand experienced greater inflation volatility, with a wider range from −0.8% to 6.1%, whereas South Korea's inflation was more moderate, ranging from 0.5% to 5.1% [1 mark].
Common Mistakes:
- Only describing one country's inflation without comparison.
- Failing to use comparative connectives.
- Not referencing specific data from the table.
Question 4 — 4 marks
Question: Using data from both Table 1 and Table 2, identify one economy that experienced both a sharp fall in real GDP growth and a significant rise in inflation between 2020 and 2022. Briefly explain why these two trends might occur simultaneously.
Marking Scheme:
| Marks | Descriptor |
|---|---|
| 1 | Correct identification of an economy (Singapore, South Korea, or Thailand) |
| 1 | Accurate data reference showing the fall in GDP growth |
| 1 | Accurate data reference showing the rise in inflation |
| 1 | Plausible explanation of why both trends can occur simultaneously |
Model Answer:
Thailand experienced both a sharp fall in real GDP growth and a significant rise in inflation between 2020 and 2022 [1 mark]. Thailand's real GDP growth fell from 2.1% in 2019 to −6.2% in 2020, while inflation rose from −0.8% in 2020 to 6.1% in 2022 [1 mark for GDP data + 1 mark for inflation data — either economy accepted with correct data]. These two trends can occur simultaneously due to a supply-side shock (cost-push inflation) [1 mark]. For example, global supply chain disruptions and rising commodity prices can increase production costs, shifting the aggregate supply curve leftward. This causes both a fall in real output (contraction in GDP) and a rise in the price level (inflation) — a phenomenon known as stagflation [1 mark].
Common Mistakes:
- Only identifying the economy without providing data.
- Explaining demand-pull inflation only, which would not account for the simultaneous fall in GDP.
- Confusing the direction of the trends.
Question 5 — 2 marks
Question: Calculate the percentage-point change in Singapore's real GDP growth rate from 2020 to 2021. Show your working.
Marking Scheme:
| Marks | Descriptor |
|---|---|
| 1 | Correct working shown |
| 1 | Correct final answer with units |
Model Answer:
Percentage-point change=Growth rate in 2021−Growth rate in 2020
=7.6%−(−5.4%)
=7.6%+5.4%
=13.0 percentage points
Common Mistakes:
- Forgetting that subtracting a negative number requires addition.
- Confusing percentage change with percentage-point change.
- Omitting units (percentage points).
Question 6 — 2 marks
Question: Based on Table 1, which economy showed the most volatile real GDP growth over the period 2019–2023? Justify your answer using data from the table.
Marking Scheme:
| Marks | Descriptor |
|---|---|
| 1 | Correct identification of the most volatile economy (Thailand or Singapore) |
| 1 | Justification using range or specific data points from the table |
Model Answer:
Thailand showed the most volatile real GDP growth [1 mark]. Thailand's growth ranged from −6.2% in 2020 to 2.6% in 2022, a range of 8.8 percentage points. This is wider than Singapore's range of 13.0 percentage points (−5.4% to 7.6%), Malaysia's range of 14.3 percentage points (−5.6% to 8.7%), and South Korea's range of 5.0 percentage points (−0.7% to 4.3%) [1 mark — any valid quantitative justification accepted].
Note: Accept Singapore if the student argues based on the sharpest single-year swing (−5.4% to +7.6% = 13.0 percentage points between consecutive years).
Common Mistakes:
- Identifying an economy without providing data to justify the claim.
- Confusing volatility with the level of growth.
Section B: Source-Based Analysis (25 marks)
Question 7 — 4 marks
Question: With reference to Source 2, identify two fiscal policy measures introduced by the Singapore Government in response to COVID-19 and explain how each measure aimed to support the economy.
Marking Scheme:
| Marks | Descriptor |
|---|---|
| 1 | Identification of first measure (JSS) |
| 1 | Explanation of how first measure supported the economy |
| 1 | Identification of second measure (SIRS / rental relief / wage credit / training subsidies) |
| 1 | Explanation of how second measure supported the economy |
Model Answer:
Measure 1: Jobs Support Scheme (JSS) [1 mark]. The JSS co-funded up to 75% of the first S$4,600 of gross monthly wages for local workers [1 mark]. This aimed to support the economy by reducing the cost of retaining employees for firms, thereby preventing mass layoffs and preserving jobs during the pandemic-induced recession. By maintaining employment, household incomes were supported, which helped sustain consumer spending and aggregate demand [1 mark].
Measure 2: Self-Employed Person Income Relief Scheme (SIRS) [1 mark]. SIRS provided direct cash payouts to eligible self-employed individuals [1 mark]. This aimed to support the economy by providing income support to a vulnerable group of workers who were not covered by the JSS, thereby maintaining their purchasing power and preventing a sharp fall in consumption [1 mark].
Alternative accepted measures: Rental relief for SMEs (reduced business costs, prevented closures), Wage credit schemes (encouraged retention of older workers), Enhanced training subsidies (supported workforce reskilling and productivity).
Common Mistakes:
- Identifying measures without explaining their economic purpose.
- Providing generic explanations not linked to the source.
- Confusing fiscal policy with monetary policy.
Question 8 — 3 marks
Question: Using information from Source 2, explain why the Singapore Government's fiscal response to COVID-19 could be described as expansionary fiscal policy.
Marking Scheme:
| Marks | Descriptor |
|---|---|
| 1 | Correct definition or identification of expansionary fiscal policy (increased government spending and/or reduced taxation) |
| 1 | Reference to specific evidence from the source (S$100 billion commitment, JSS, SIRS, etc.) |
| 1 | Explanation of how the measures represent an increase in government expenditure aimed at stimulating aggregate demand |
Model Answer:
Expansionary fiscal policy involves increasing government spending and/or reducing taxation to stimulate economic activity and boost aggregate demand [1 mark]. The Singapore Government's response qualifies as expansionary because it committed approximately S$100 billion in fiscal support through five Budgets between February 2020 and March 2021 [1 mark]. This included significant increases in government expenditure through schemes such as the Jobs Support Scheme, SIRS, rental relief, and training subsidies — all of which injected money into the economy to support jobs, household incomes, and business continuity during the recession [1 mark].
Common Mistakes:
- Defining expansionary fiscal policy incorrectly (e.g., as reducing government spending).
- Failing to reference specific evidence from the source.
- Not linking the measures to the objective of stimulating aggregate demand.
Question 9 — 4 marks
Question: Source 2 states that the recovery in 2021 was "uneven across sectors." Using evidence from the source, explain what this means and suggest one reason why the accommodation and food services sector continued to contract while manufacturing grew.
Marking Scheme:
| Marks | Descriptor |
|---|---|
| 1 | Explanation of "uneven recovery" (different sectors grew at different rates or in different directions) |
| 1 | Data reference from the source (manufacturing +13.2%, accommodation and food services −6.9%) |
| 1 | Plausible reason related to the nature of the sectors or pandemic restrictions |
| 1 | Development of the reason with economic reasoning |
Model Answer:
An "uneven recovery" means that different sectors of the economy experienced different rates of growth (or contraction) during the recovery period, rather than all sectors recovering at the same pace [1 mark]. The source provides evidence that the manufacturing sector grew by 13.2% in 2021, while the accommodation and food services sector continued to contract by 6.9% [1 mark]. One reason for this divergence is that manufacturing, particularly electronics, benefited from strong global demand as economies reopened and digitalisation accelerated [1 mark]. In contrast, the accommodation and food services sector remained constrained by ongoing social distancing measures, travel restrictions, and reduced consumer confidence in dining out and tourism, which continued to suppress demand for these services [1 mark].
Common Mistakes:
- Not explaining what "uneven recovery" means in economic terms.
- Failing to use specific data from the source.
- Providing a reason that is not economically plausible.
Question 10 — 4 marks
Question: The source mentions that the government "drew on past reserves." Explain one advantage and one disadvantage of a government drawing on past reserves to finance a budget deficit.
Marking Scheme:
| Marks | Descriptor |
|---|---|
| 1 | One valid advantage identified |
| 1 | Development/explanation of the advantage |
| 1 | One valid disadvantage identified |
| 1 | Development/explanation of the disadvantage |
Model Answer:
Advantage: Drawing on past reserves allows the government to finance emergency spending without having to borrow or raise taxes, which could further depress economic activity during a recession [1 mark]. This enables the government to implement timely and substantial fiscal support measures (such as the S$100 billion COVID-19 response) without increasing the national debt burden on future generations [1 mark].
Disadvantage: Past reserves are a finite resource, and drawing on them reduces the government's fiscal buffer for future emergencies or economic downturns [1 mark]. Additionally, excessive reliance on reserves may signal fiscal weakness and could undermine investor confidence in the government's long-term fiscal sustainability, potentially leading to higher borrowing costs in the future [1 mark].
Common Mistakes:
- Providing only an advantage or only a disadvantage.
- Failing to develop the point with economic reasoning.
- Confusing past reserves with government borrowing.
Question 11 — 6 marks
Question: Using a well-labelled aggregate demand and aggregate supply (AD/AS) diagram, illustrate and explain how the COVID-19 pandemic could have caused Singapore's real GDP to contract in 2020.
Marking Scheme:
| Marks | Descriptor |
|---|---|
| 2 | Well-labelled AD/AS diagram showing correct shifts (AD leftward and/or AS leftward) |
| 2 | Explanation of demand-side impact (fall in consumption, investment, net exports) |
| 2 | Explanation of supply-side impact (supply chain disruptions, business closures, reduced labour supply) |
Model Answer:
Diagram Requirements: The diagram should show:
- Initial AD₁ and AS₁ curves intersecting at equilibrium (Y₁, P₁)
- AD curve shifting leftward to AD₂ (demand-side shock)
- AS curve shifting leftward to AS₂ (supply-side shock)
- New equilibrium at lower real GDP (Y₃ < Y₁)
- All curves, axes, and equilibrium points clearly labelled
Explanation:
The COVID-19 pandemic caused Singapore's real GDP to contract through both demand-side and supply-side channels [1 mark for identifying both channels].
Demand-side: The pandemic led to a fall in aggregate demand as consumer confidence collapsed, causing households to reduce consumption spending [1 mark]. Investment fell due to heightened uncertainty, and net exports declined as global demand weakened and supply chains were disrupted [1 mark]. This shifted the AD curve leftward from AD₁ to AD₂, reducing both real GDP and the price level.
Supply-side: The circuit breaker measures and social distancing restrictions forced many businesses to close or operate at reduced capacity, reducing the economy's productive capacity [1 mark]. Supply chain disruptions and reduced labour availability (due to illness and movement restrictions) further constrained production, shifting the AS curve leftward from AS₁ to AS₂ [1 mark]. This supply-side shock reduced real GDP further while putting upward pressure on prices.
The combined effect of both AD and AS shifting leftward resulted in a significant contraction in real GDP, as evidenced by the 5.4% decline in 2020 [1 mark].
Common Mistakes:
- Drawing only one shift (AD or AS) when both are relevant.
- Incorrectly labelling the axes or curves.
- Shifting the curves in the wrong direction.
- Failing to link the explanation to the Singapore context.
Question 12 — 4 marks
Question: Evaluate the effectiveness of the Jobs Support Scheme (JSS) as a policy measure to reduce unemployment during the COVID-19 pandemic. Consider both short-term and long-term perspectives in your answer.
Marking Scheme:
| Marks | Descriptor |
|---|---|
| 1 | Explanation of how JSS was effective in the short term |
| 1 | Development of short-term effectiveness with reasoning |
| 1 | Identification of a limitation or long-term concern |
| 1 | Development of the limitation with reasoning |
Model Answer:
Short-term effectiveness: The JSS was highly effective in the short term because it directly subsidised wages, making it financially viable for firms to retain workers rather than lay them off [1 mark]. By co-funding up to 75% of wages, the scheme significantly reduced the cost of labour for businesses during a period of severely reduced revenue, thereby preventing a much larger spike in unemployment [1 mark]. The unemployment rate rose only from 2.3% to 3.0% in 2020, which, while significant, was far less severe than in many other economies that did not implement similar schemes.
Long-term limitations: However, the JSS may have created moral hazard by subsidising firms that were not viable in the long run, potentially delaying necessary structural adjustments in the economy [1 mark]. Additionally, the scheme was costly (part of the S$100 billion fiscal package) and contributed to a large budget deficit (13.9% of GDP), which may constrain future fiscal policy options. There is also the risk that workers remained in unproductive jobs, reducing labour market efficiency and potentially slowing the reallocation of resources to more productive sectors [1 mark].
Common Mistakes:
- Only discussing effectiveness without evaluating limitations.
- Failing to distinguish between short-term and long-term perspectives.
- Not linking the evaluation to the specific context of the JSS.
Section C: Extended Response (15 marks)
Question 13(a) — 4 marks
Question: Explain two possible causes of the rise in Singapore's inflation rate in 2022.
Marking Scheme:
| Marks | Descriptor |
|---|---|
| 1 | First cause identified (demand-pull or cost-push) |
| 1 | Development of first cause with economic reasoning |
| 1 | Second cause identified |
| 1 | Development of second cause with economic reasoning |
Model Answer:
Cause 1: Cost-push inflation from global supply chain disruptions [1 mark]. The ongoing global supply chain disruptions, exacerbated by the Russia-Ukraine conflict, led to significant increases in the prices of key commodities such as oil, gas, and food [1 mark]. As a small, open economy heavily dependent on imports, Singapore was particularly vulnerable to these external price shocks, which increased production costs for firms and were passed on to consumers in the form of higher prices [1 mark].
Cause 2: Demand-pull inflation from economic recovery [1 mark]. As Singapore reopened its economy and domestic restrictions were eased, pent-up consumer demand was released, particularly in sectors such as retail, dining, and travel [1 mark]. This surge in aggregate demand, combined with supply constraints that had not fully normalised, created upward pressure on prices as demand outpaced the economy's ability to supply goods and services [1 mark].
Alternative accepted causes: Tight labour market pushing up wages, global inflationary pressures from expansionary monetary policies in major economies, depreciation of the Singapore dollar (though MAS was tightening), rising housing costs.
Common Mistakes:
- Confusing demand-pull and cost-push inflation.
- Providing causes that are not relevant to Singapore's economic context.
- Failing to develop the explanation with economic reasoning.
Question 13(b) — 6 marks
Question: Using a well-labelled AD/AS diagram, illustrate and explain how a tightening of monetary policy (appreciation of the Singapore dollar) could help to reduce inflation.
Marking Scheme:
| Marks | Descriptor |
|---|---|
| 2 | Well-labelled AD/AS diagram showing leftward shift of AD |
| 2 | Explanation of how currency appreciation reduces net exports |
| 2 | Explanation of how reduced AD lowers the price level (inflation) |
Model Answer:
Diagram Requirements: The diagram should show:
- Initial AD₁ and AS curves intersecting at equilibrium (Y₁, P₁) where P₁ is relatively high
- AD curve shifting leftward to AD₂
- New equilibrium at (Y₂, P₂) where P₂ < P₁ and Y₂ < Y₁
- Arrow showing direction of AD shift
- All curves, axes, and equilibrium points clearly labelled
Explanation:
When MAS tightens monetary policy by allowing the Singapore dollar to appreciate, the stronger currency makes Singapore's exports more expensive for foreign buyers and imports cheaper for domestic consumers [1 mark]. This leads to a fall in net exports (X − M), which is a component of aggregate demand [1 mark]. As net exports fall, aggregate demand decreases, shifting the AD curve leftward from AD₁ to AD₂ [1 mark].
The leftward shift in AD leads to a new equilibrium at a lower price level (P₂ < P₁), which represents a reduction in inflation [1 mark]. However, this comes at the cost of lower real GDP (Y₂ < Y₁), illustrating the trade-off between controlling inflation and maintaining economic growth [1 mark]. This is why monetary policy tightening must be carefully calibrated to avoid causing a recession while still achieving the objective of price stability [1 mark].
Common Mistakes:
- Drawing the AD shift in the wrong direction (rightward instead of leftward).
- Failing to explain the transmission mechanism (appreciation → net exports → AD).
- Not mentioning the trade-off between inflation and output.
- Incorrectly labelling the diagram.
Question 13(c) — 5 marks
Question: Discuss whether monetary policy alone is sufficient to control inflation in Singapore, or whether the government should also use fiscal policy. Consider the strengths and limitations of each approach.
Marking Scheme:
| Marks | Descriptor |
|---|---|
| 1 | Discussion of strengths of monetary policy in controlling inflation |
| 1 | Discussion of limitations of monetary policy |
| 1 | Discussion of how fiscal policy could complement monetary policy |
| 1 | Discussion of limitations of fiscal policy |
| 1 | Overall evaluative judgement with reasoning |
Model Answer:
Strengths of monetary policy: Monetary policy, managed by MAS through the exchange rate framework, is Singapore's primary tool for controlling inflation [1 mark]. It is effective because Singapore is a small, open economy where imports constitute a large share of consumption, so exchange rate adjustments directly influence domestic prices [1 mark]. Additionally, monetary policy can be implemented quickly and adjusted flexibly in response to changing economic conditions.
Limitations of monetary policy: However, monetary policy alone may be insufficient because it primarily addresses demand-pull inflation through reducing aggregate demand [1 mark]. If inflation is driven by supply-side factors (such as global commodity price shocks or supply chain disruptions), monetary policy is less effective because it cannot directly address the root cause of cost-push inflation [1 mark]. Furthermore, tightening monetary policy to control inflation may come at the cost of lower economic growth and higher unemployment.
Role of fiscal policy: Fiscal policy can complement monetary policy by addressing supply-side constraints and supporting vulnerable groups [1 mark]. For example, targeted subsidies can help households cope with rising prices without fuelling demand-pull inflation, while investment in productivity-enhancing infrastructure can increase the economy's productive capacity, helping to reduce cost-push pressures [1 mark]. During the COVID-19 pandemic, fiscal measures such as the JSS and SIRS were essential in supporting the economy in ways that monetary policy alone could not achieve.
Limitations of fiscal policy: However, fiscal policy is subject to implementation lags and political constraints, making it less agile than monetary policy [1 mark]. Additionally, expansionary fiscal policy can itself be inflationary if it increases aggregate demand without corresponding increases in supply.
Overall judgement: In conclusion, while monetary policy is the primary and most effective tool for controlling inflation in Singapore, it is not sufficient on its own [1 mark]. A combination of monetary and fiscal policies is likely to be more effective, with monetary policy managing aggregate demand and fiscal policy addressing supply-side constraints and distributional concerns [1 mark].
Common Mistakes:
- Presenting only one side of the argument without evaluation.
- Failing to distinguish between demand-pull and cost-push inflation.
- Not linking the discussion to Singapore's specific economic context.
- Providing a generic answer without specific policy examples.
Summary of Marks
| Section | Questions | Marks |
|---|---|---|
| A: Data Interpretation | Q1–Q6 | 20 |
| B: Source-Based Analysis | Q7–Q12 | 25 |
| C: Extended Response | Q13(a)–Q13(c) | 15 |
| Total | 60 |
This practice paper was generated by TuitionGoWhere AI. It is designed to complement syllabus study and should be used alongside official past-year papers and school materials.
Free quiz and exam paper access
Enter your details to view this paper
Your access is remembered on this device.