AI Generated Exam Paper
A Level H1 Economics Practice Paper 1
Free A Level H1 Econs Practice Paper 1, HY3 AI version, with questions, answers, and A Level-style practice for Singapore students.
These static practice materials are generated from the site's syllabus and paper-generation workflow, with source and model context shown so students and parents can evaluate the material before use.
Questions


Free quiz and exam paper access
Enter your details to view this paper
Your access is remembered on this device.
Answers
TuitionGoWhere Practice Paper - Economics H1 A-Level (Answer Key)
Version 1 of 5 — Total Marks: 40
Section A: Data Interpretation (16 marks)
Q1 [2 marks]
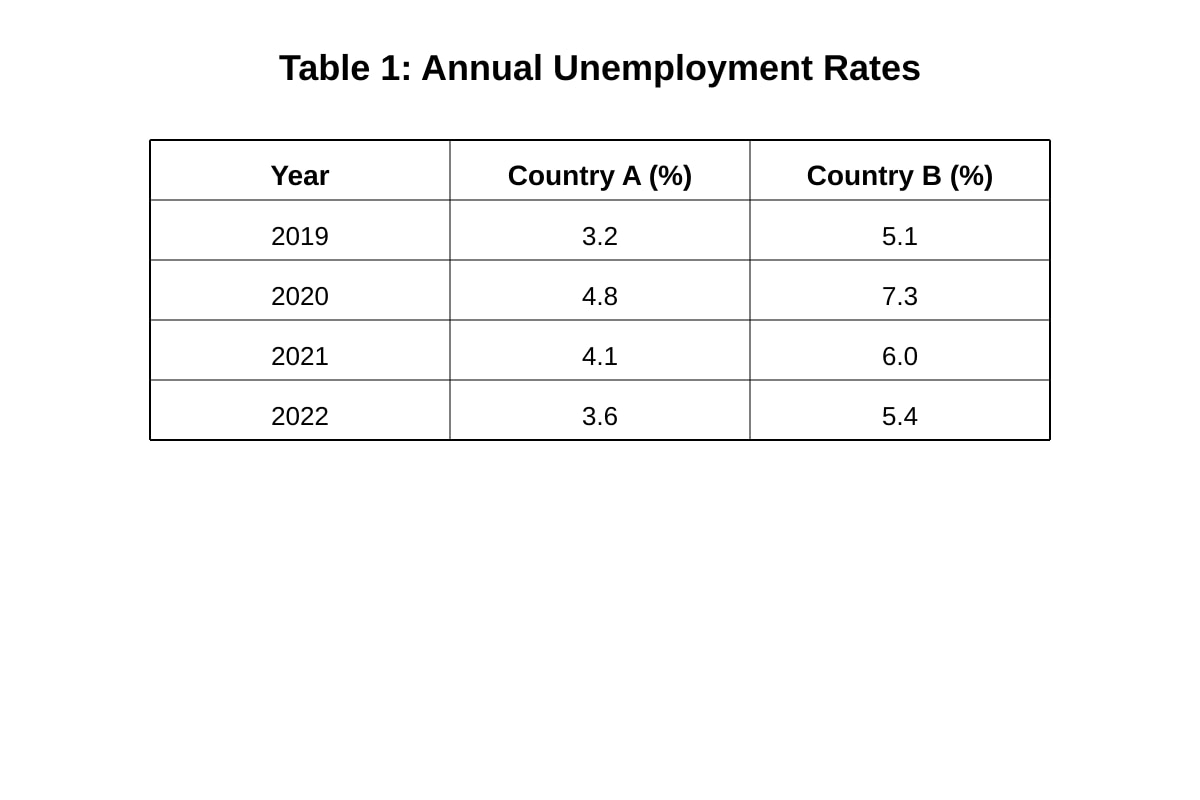
- Country A unemployment was lower than Country B in all years (e.g., 2019: 3.2% vs 5.1%) [1].
- Both fell from 2020 peaks by 2022, but Country B remained higher (5.4% vs 3.6%) [1]. Teaching note: Compare both levels and trend using comparative language. Common mistake: stating only one country.
Q2 [2 marks]
- Real GDP growth for Country A fell from 2019 to 2020, then recovered from 2021 to 2022 [1].
- Overall volatile but returned near pre-pandemic levels [1]. Teaching note: Describe direction and turning point.
Q3 [2 marks]
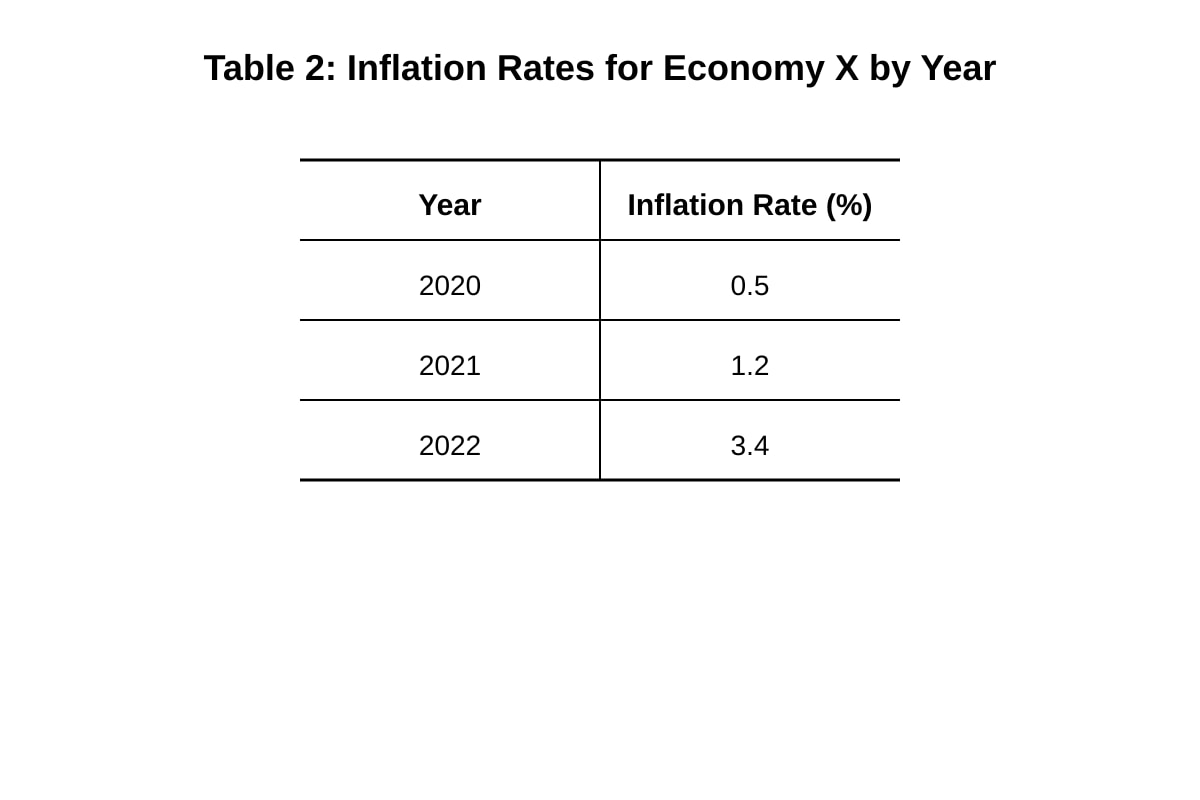
- Inflation rose from 0.5% in 2020 to 3.4% in 2022 [1].
- More than six-fold increase indicating accelerating inflation [1]. Teaching note: Use table values explicitly.
Q4 [2 marks]
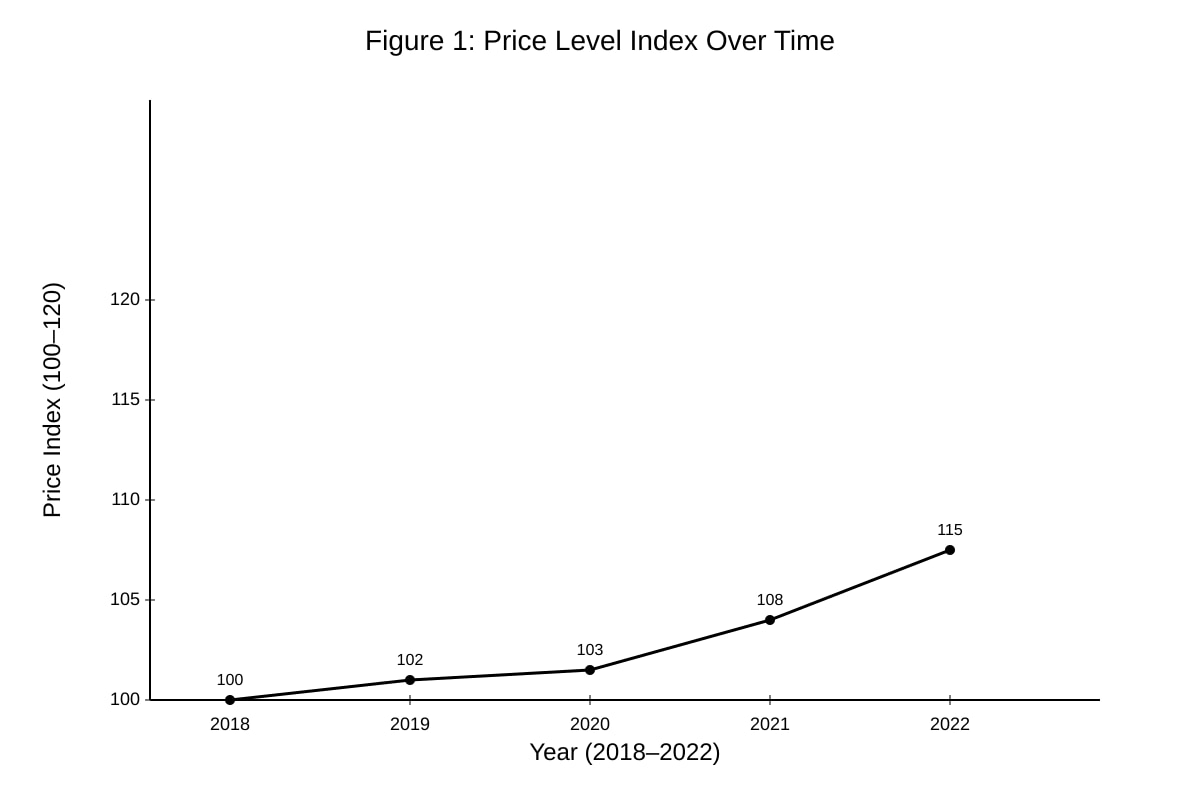
- Price level rose steadily from 100 (2018) to 103 (2020) then accelerated to 115 by 2022 [1].
- Shows increasing inflation rate [1]. Teaching note: Read graph values, note change in slope.
Q5 [2 marks]
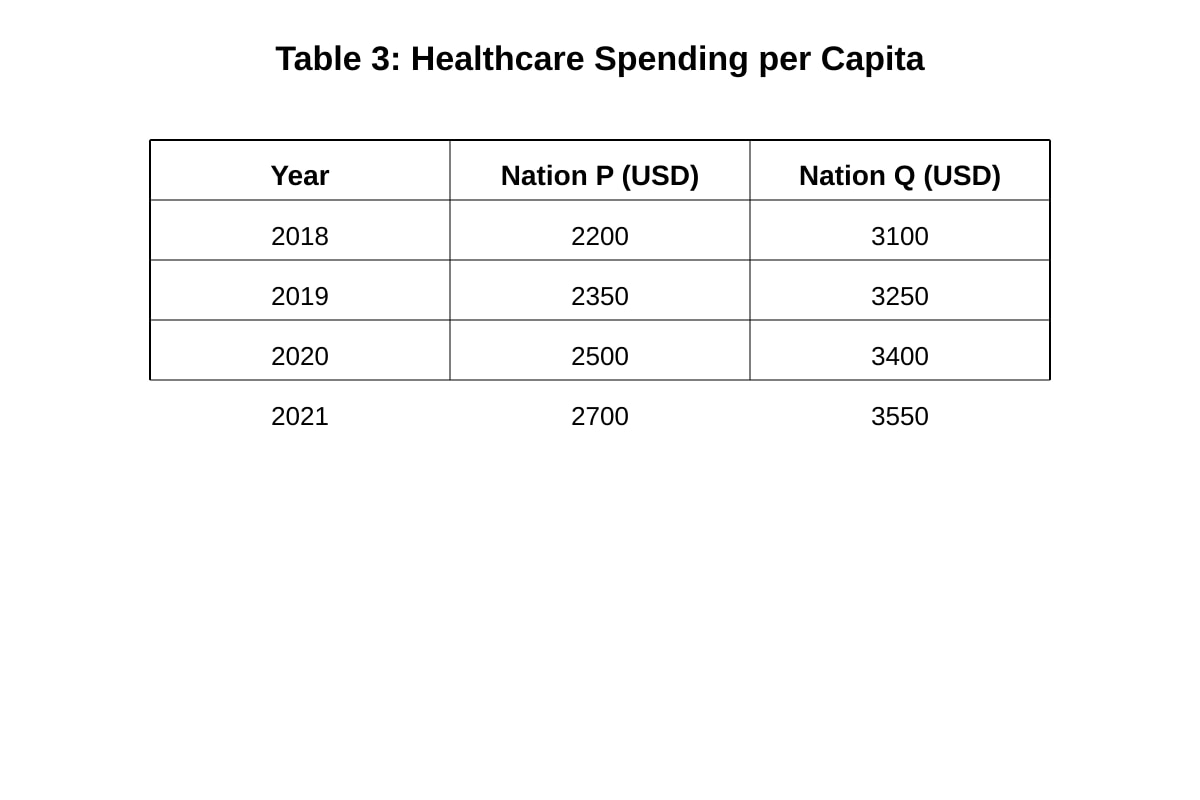
- Nation Q spent more per capita than Nation P each year (e.g., 2021: 2700) [1].
- Both increased, but gap persisted (~$850) [1]. Teaching note: Compare levels and trend.
Q6 [2 marks]
- Exports fluctuated: rose 2017–18, fell 2019–20, then rose to 450b in 2021 [1].
- Net increase over period [1]. Teaching note: Bar heights show variation.
Q7 [2 marks]
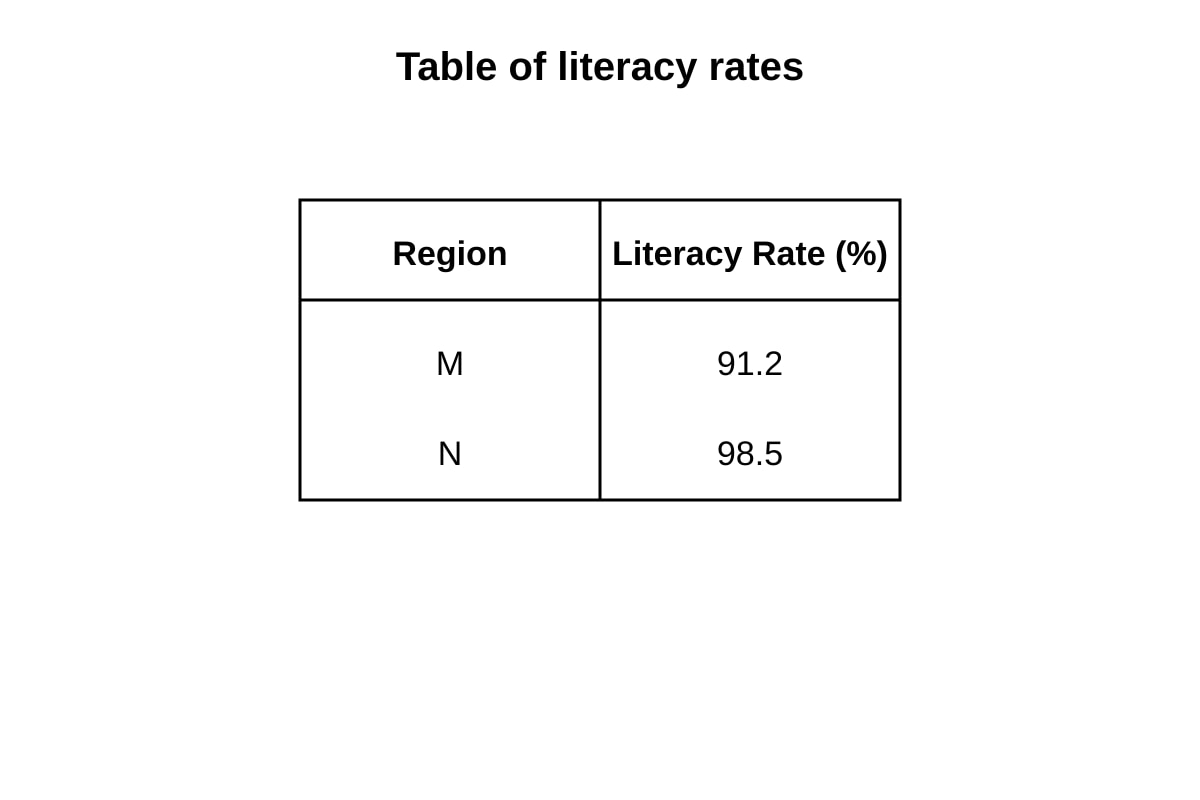
- Region N (98.5%) higher than Region M (91.2%) [1].
- Difference of 7.3 percentage points [1]. Teaching note: Simple comparison with values.
Q8 [2 marks]
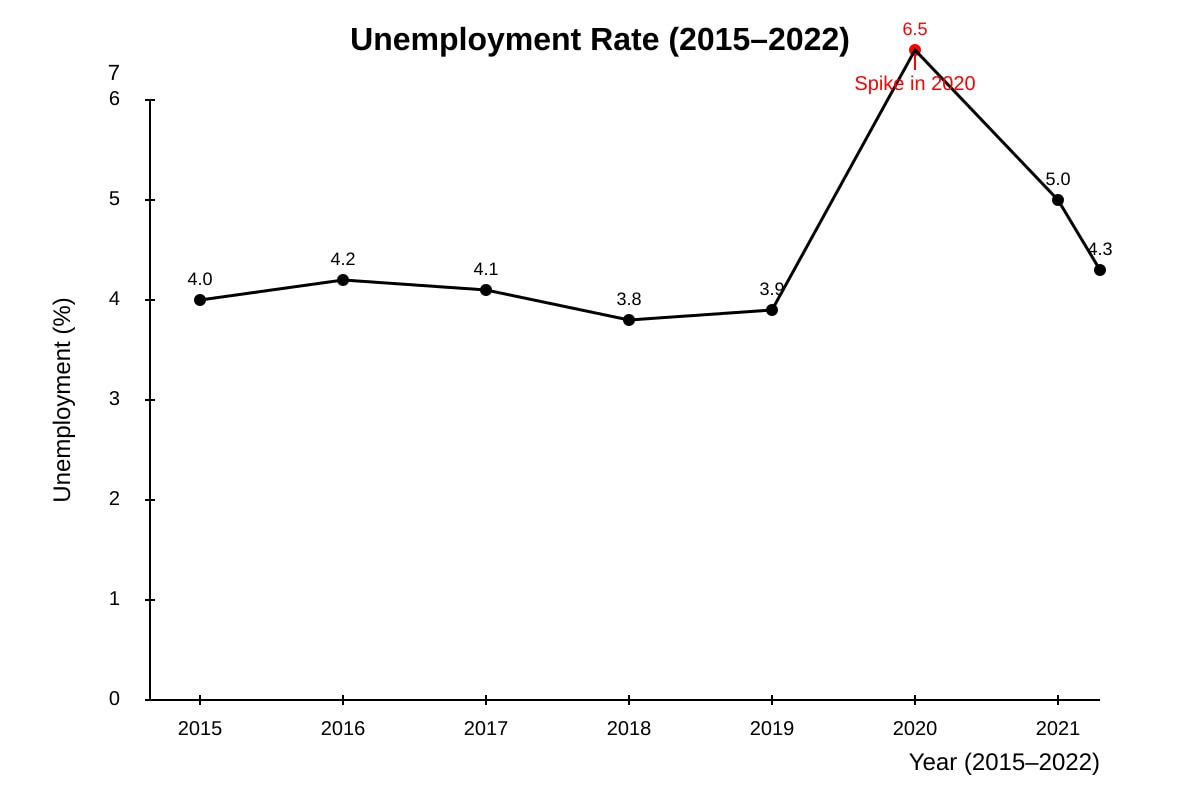
- Cyclical pattern due to 2020 spike (6.5%) from normal ~4% [1].
- Observation: sharp rise then fall back [1]. Teaching note: Spike indicates cyclical shock.
Section B: Source-Based Analysis (12 marks)
Q9 [2 marks]
- Producers receive higher price and may sell more at supported price [1]; revenue increases [1]. Teaching note: Min price above eq → benefit farmers.
Q10 [2 marks]
- Consumers face higher rice prices [1]; switch to imports reduces choice or raises reliance [1]. Teaching note: Unintended: behaviour change.
Q11 [2 marks]
- High PES (>1) because capacity adjustable quickly [1]; supply responsive to price [1]. Teaching note: Time to adjust = key PES determinant.
Q12 [2 marks]
- Low PES (<1) due to training time [1]; supply inelastic short run [1]. Teaching note: Contrast with Q11.
Q13 [2 marks]
- GDP fell (480b) [1]; unemployment rose (3%→5%) [1]. Teaching note: Identify two from extract.
Q14 [2 marks]
- Reduce unemployment / stimulate growth [1]; e.g., expansionary policy [1]. Teaching note: Link to worsened indicators.
Section C: Applied Data Response (12 marks)
Q15 [2 marks]
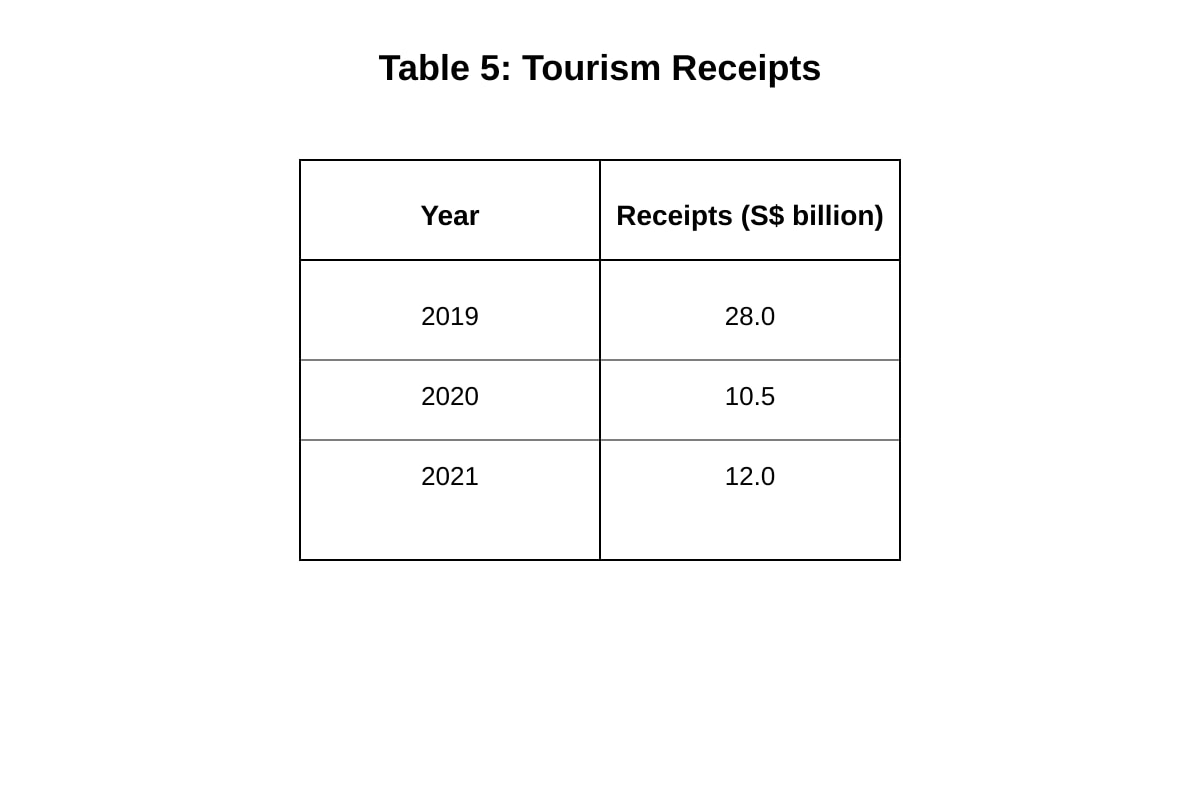
- % change = (12.0−28.0)/28.0 × 100 = −57.1% [2 for calculation]. Working: (New−Old)/Old×100. Teaching note: Tourism dropped sharply in 2020, partial recovery.
Q16 [2 marks]
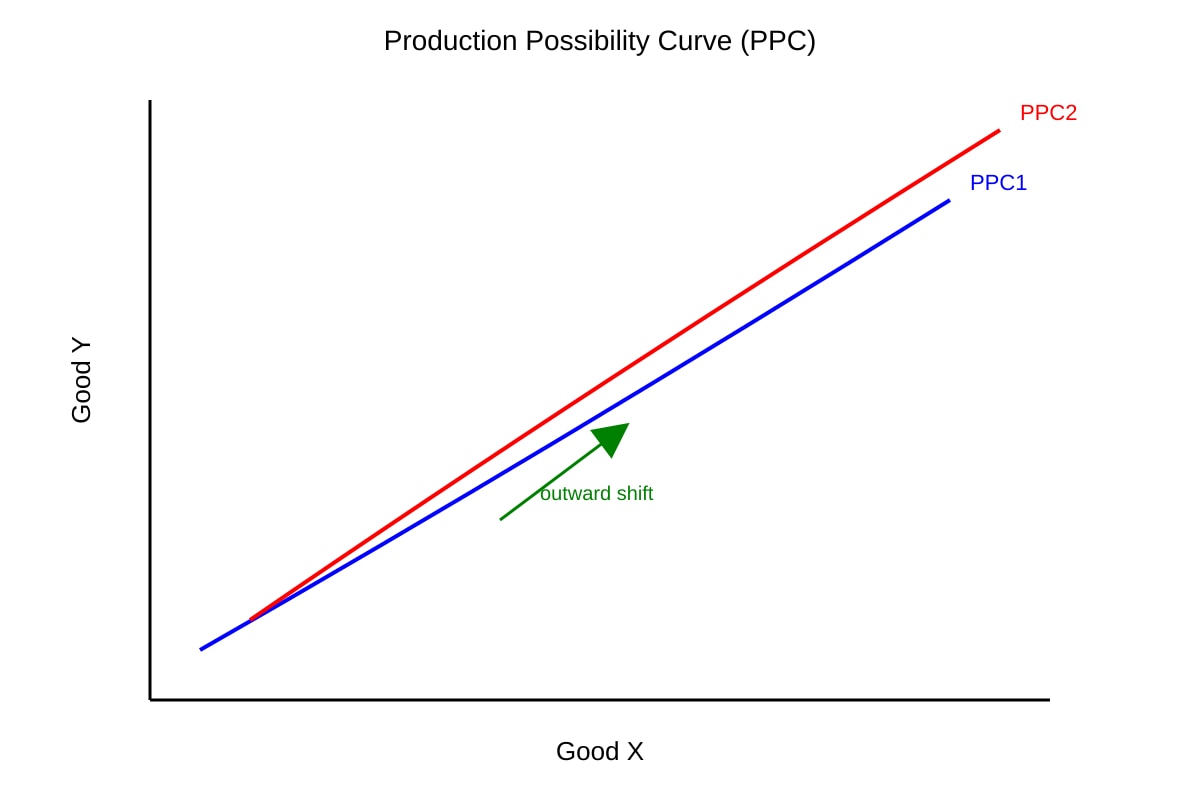
- Outward shift due to resource growth or tech improvement [1]; e.g., more labour [1]. Teaching note: PPC shift = capacity increase.
Q17 [2 marks]
- 2020 deficit (200−210=−10b) [1]; 2022 surplus (230−225=+5b) [1]. Teaching note: Trade balance = X−M.
Q18 [2 marks]
- Negative externality reduced but prices rose [1]; net welfare ambiguous [1]. Teaching note: Trade-off in policy.
Q19 [2 marks]
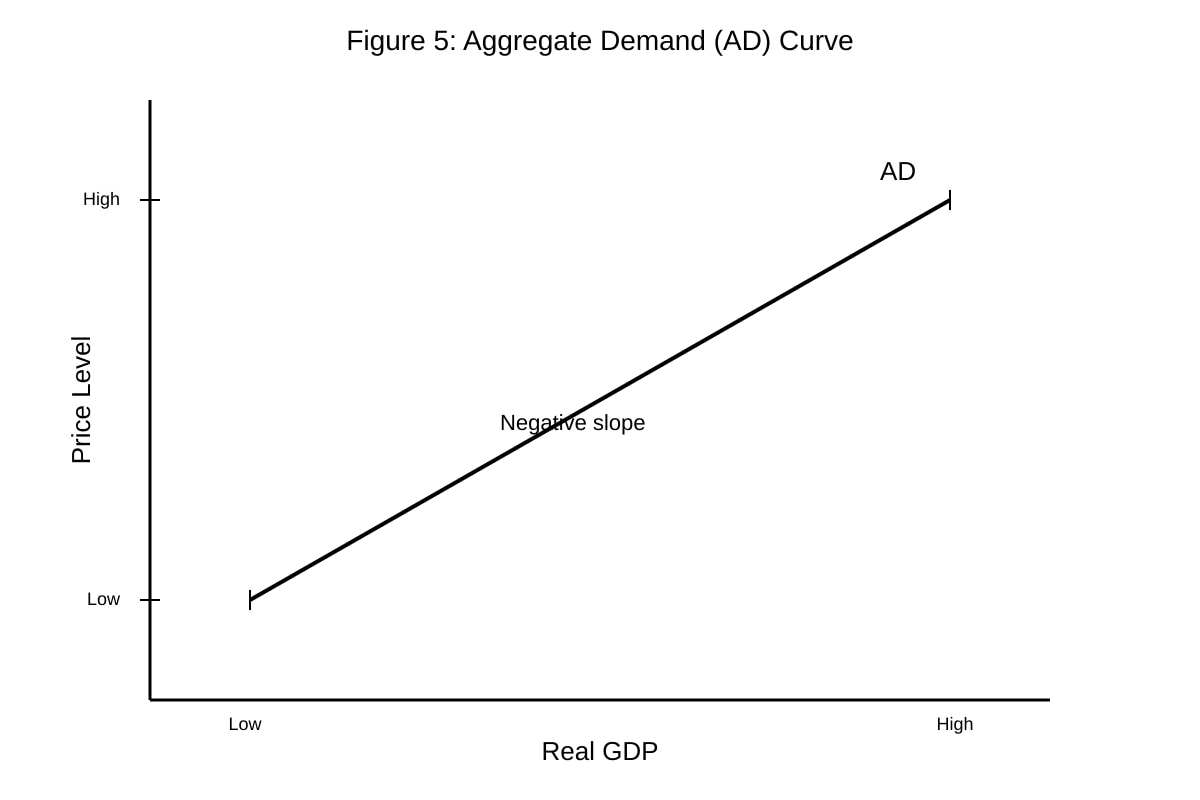
- Inverse relationship: higher price → lower real GDP [1]; downward sloping AD [1]. Teaching note: AD negative slope from wealth/interest effects.
Q20 [2 marks]
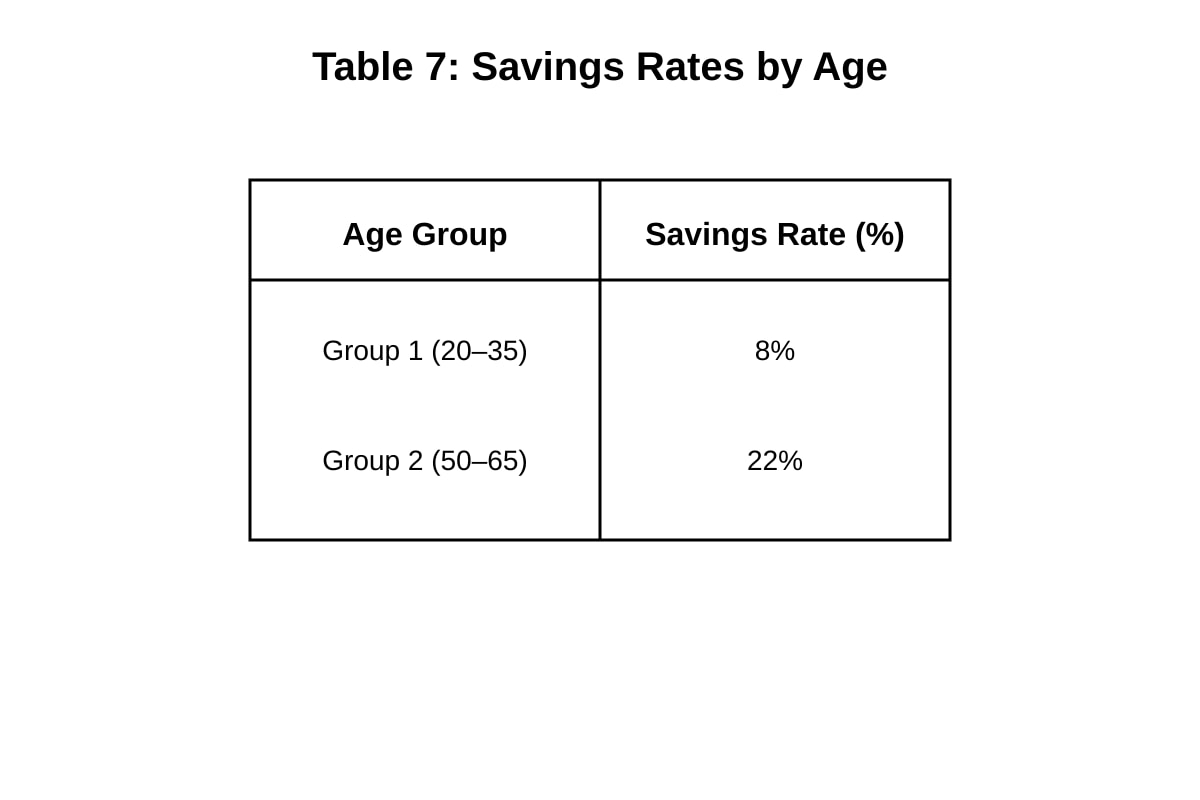
- Older group saves more due to near retirement / lower commitments [1]; life-cycle reason [1]. Teaching note: Age affects saving behaviour.