From Real Exams Exam Paper
A Level H1 Economics Practice Paper 5
Free A Level H1 Econs Practice Paper 5, LongCat Exam version, with questions, answers, and A Level-style practice for Singapore students.
These static practice materials are generated from the site's syllabus and paper-generation workflow, with source and model context shown so students and parents can evaluate the material before use.
Questions
TuitionGoWhere Practice Paper — Economics H1 A-Level
TuitionGoWhere Secondary School (AI)
| Subject: | Economics |
| Level: | A-Level H1 |
| Paper: | Practice Paper — Data Response |
| Version: | 5 of 5 |
| Duration: | 1 hour 30 minutes |
| Total Marks: | 60 |
| Name: | ______________________________ |
| Class: | ______________________________ |
| Date: | ______________________________ |
Instructions
- Answer all questions in the spaces provided.
- Write your answers in blue or black ink.
- The number of marks for each question is shown in brackets [ ].
- You are advised to spend approximately 90 minutes on this paper.
- Where diagrams are required, draw clearly and label all axes, curves, and equilibrium points.
- Use economic terminology precisely in all responses.
Section A: Data Interpretation (20 marks)
Refer to the following data for Questions 1–5.
Source: Singapore Ministry of Trade and Industry — Economic Survey of Singapore 2023 (Extract)
Table 1: Key Economic Indicators for Singapore, 2019–2023
| Indicator | 2019 | 2020 | 2021 | 2022 | 2023 |
|---|---|---|---|---|---|
| Real GDP Growth (%) | 1.3 | -4.1 | 8.9 | 3.6 | 1.1 |
| Unemployment Rate (%) | 2.3 | 3.0 | 2.7 | 2.1 | 2.0 |
| Inflation Rate (CPI, %) | 0.6 | -0.2 | 2.3 | 6.1 | 4.8 |
| Government Health Expenditure (% of GDP) | 1.8 | 2.9 | 2.5 | 2.1 | 2.3 |
| Exports of Goods (S$ billion) | 478 | 452 | 540 | 580 | 525 |
Table 2: Singapore Government Healthcare Spending by Sector, 2019–2023 (S$ billion)
| Sector | 2019 | 2020 | 2021 | 2022 | 2023 |
|---|---|---|---|---|---|
| Public Hospitals | 5.2 | 7.8 | 7.1 | 6.3 | 6.5 |
| Primary Care (Polyclinics) | 1.8 | 2.4 | 2.3 | 2.1 | 2.2 |
| Community Care | 0.6 | 1.5 | 1.4 | 1.1 | 1.3 |
| Total | 7.6 | 11.7 | 10.8 | 9.5 | 10.0 |
Question 1 [2 marks]
With reference to Table 1, compare the real GDP growth rate of Singapore between 2020 and 2021.
Question 2 [2 marks]
With reference to Table 1, describe the trend in the unemployment rate from 2019 to 2023.
Question 3 [3 marks]
With reference to Table 2, compare the government healthcare spending on public hospitals and community care from 2019 to 2023.
Question 4 [5 marks]
Using the data from Table 1, explain two possible reasons for the change in Singapore's inflation rate between 2021 and 2022.
Question 5 [8 marks]
With reference to both tables, analyse how the Singapore government's healthcare spending responded to the economic conditions between 2019 and 2023. In your answer, identify patterns in the data and explain the likely economic rationale for the changes.
Section B: Diagram and Application (20 marks)
Question 6 [4 marks]
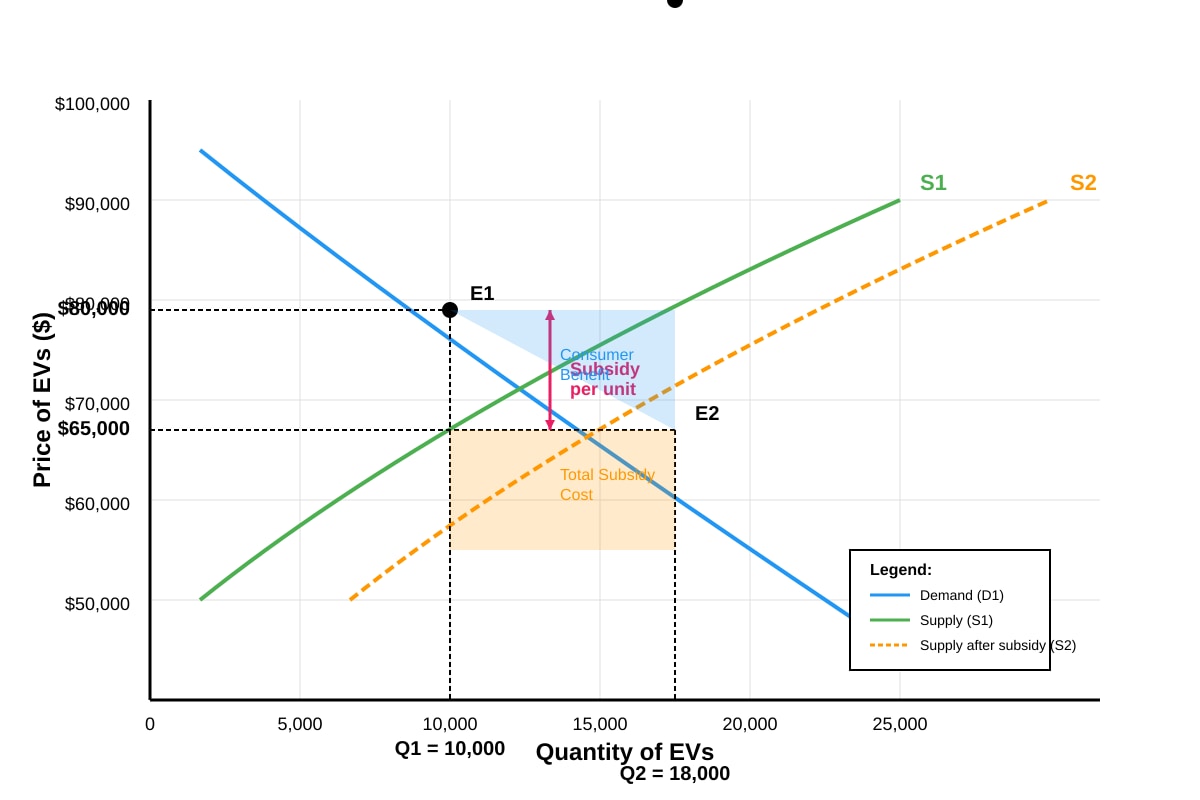
The diagram below shows the market for electric vehicles (EVs) in Singapore. The government introduces a subsidy to encourage EV adoption.
Generated diagram for Q6.
(a) With reference to the diagram, state the change in the equilibrium price and quantity of EVs after the subsidy. [1 mark]
(b) Explain how the subsidy affects consumers and producers of EVs. [3 marks]
Question 7 [4 marks]
The following table shows the price and quantity demanded for rice in a low-income country.
| Price per kg ($) | Quantity Demanded (million kg) |
|---|---|
| 1.00 | 50 |
| 1.50 | 45 |
| 2.00 | 38 |
| 2.50 | 30 |
| 3.00 | 20 |
(a) Calculate the price elasticity of demand (PED) when the price rises from 1.50to2.00. Use the midpoint (arc elasticity) method. Show your working. [2 marks]
(b) State whether demand is elastic or elastic over this price range and explain what this means for total consumer expenditure on rice. [2 marks]
Question 8 [5 marks]
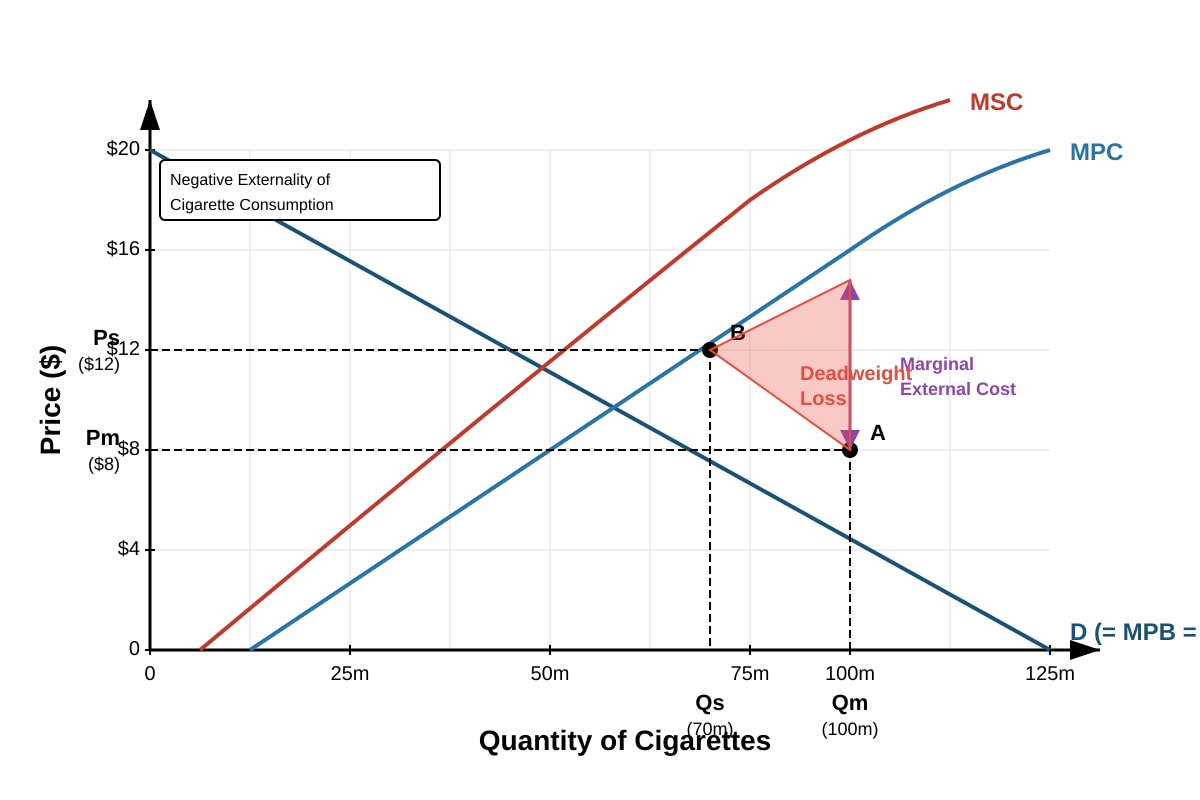
The diagram below illustrates the market for cigarettes, which generate negative externalities.
Generated diagram for Q8.
(a) Identify the market equilibrium quantity and the socially optimal quantity from the diagram. [1 mark]
(b) Explain why the market equilibrium quantity exceeds the socially optimal quantity. [2 marks]
(c) Calculate the deadweight loss if the marginal external cost per pack is constant at $4 and the difference between Qm and Qs is 30 million packs. Show your working. [2 marks]
Question 9 [7 marks]
Read the following extract and answer the question that follows.
Extract: The Rise of Remote Work and Its Economic Impact
The COVID-19 pandemic accelerated the adoption of remote work globally. In Singapore, the proportion of workers working from home at least part of the week rose from 15% in 2019 to 42% in 2022. This shift has had significant economic effects. Commercial office vacancy rates in Singapore's Central Business District (CBD) rose from 4.2% in 2019 to 8.7% in 2023. Average commercial rents fell by 12% over the same period. Meanwhile, demand for suburban co-working spaces increased by 35% between 2020 and 2023.
The shift also affected the labour market. Firms reported savings of approximately S1,200peremployeepermonthonoffice−relatedcosts.However,somefirmsnoteda5–82 billion in digital infrastructure to support hybrid work arrangements.
Using economic concepts, evaluate the likely impact of the rise in remote work on the market for commercial office space and on overall economic efficiency in Singapore. In your answer, consider both the demand and supply sides of the market and discuss any potential market failures.
Section C: Policy Evaluation (20 marks)
Question 10 [6 marks]
The Singapore government is considering two policy options to reduce traffic congestion in the city centre:
- Option A: Increase the Certificate of Entitlement (COE) quota for electric vehicles while maintaining current COE prices for petrol vehicles.
- Option B: Introduce a congestion charge of $5 per entry into the CBD during peak hours.
Using economic theory, compare the likely effectiveness of these two policies in reducing traffic congestion. In your answer, consider the impact on different groups of consumers and the potential limitations of each policy.
Question 11 [6 marks]
Read the following extract and answer the question that follows.
Extract: Singapore's Carbon Tax
Singapore introduced a carbon tax in 2019 at 5pertonneofCO2equivalent(tCO2e)foremissionsexceeding25,000tCO2eperyear.In2024,thegovernmentraisedthecarbontaxto25 per tCO₂e, with plans to increase it to 50–80 per tCO₂e by 2030. The tax applies to approximately 50 large emitters, covering about 80% of Singapore's greenhouse gas emissions.
The government has stated that revenue from the carbon tax will be used to fund green initiatives and support businesses in transitioning to cleaner technologies. Critics argue that the tax increases production costs, reducing the international competitiveness of Singapore's petrochemical and refining industries, which account for approximately 18% of total exports.
Supporters counter that the tax incentivises firms to adopt energy-efficient technologies, leading to long-term cost savings and positioning Singapore as a leader in the green economy.
Evaluate the likely economic effects of Singapore's carbon tax on firms and the economy. In your answer, consider both the short-run and long-run impacts, and discuss whether the benefits are likely to outweigh the costs.
Question 12 [8 marks]
The table below shows selected data for two countries, Country X and Country Y.
| Indicator | Country X | Country Y |
|---|---|---|
| GDP per capita (US$) | 12,500 | 48,000 |
| Gini Coefficient | 0.38 | 0.45 |
| Government Education Spending (% of GDP) | 5.2 | 3.8 |
| Healthcare Spending (% of GDP) | 8.1 | 4.2 |
| Inflation Rate (%) | 1.2 | 3.5 |
| Current Account Balance (% of GDP) | -2.1 | +4.3 |
Using the data above and your knowledge of economics, evaluate which country is likely to achieve a higher standard of living in the long run. In your answer, consider multiple dimensions of the standard of living, discuss the limitations of using GDP per capita alone, and analyse how government policy choices may influence future outcomes.
End of Paper
Section A Total: 20 marks | Section B Total: 20 marks | Section C Total: 20 marks | Grand Total: 60 marks
Answers
TuitionGoWhere Practice Paper — Economics H1 A-Level
Answer Key — Version 5 of 5
Section A: Data Interpretation (20 marks)
Question 1 [2 marks]
Answer: In 2020, Singapore's real GDP growth rate was -4.1% (a contraction), whereas in 2021, it was +8.9% (a strong expansion). This represents a significant swing of 13.0 percentage points from contraction to growth, reflecting the sharp economic downturn caused by the COVID-19 pandemic in 2020 followed by a strong rebound in 2021 as the economy reopened.
Mark scheme:
- 1 mark: Correct identification of both values (-4.1% and +8.9%) with reference to Table 1.
- 1 mark: Clear comparative language used (e.g., "whereas," "in contrast," "compared to") showing the direction and magnitude of change.
Common mistakes:
- Stating only one year's figure without comparison.
- Failing to reference Table 1 explicitly.
- Describing the two figures separately rather than comparing them directly.
Question 2 [2 marks]
Answer: The unemployment rate rose from 2.3% in 2019 to a peak of 3.0% in 2020, before declining steadily to 2.1% in 2022 and further to 2.0% in 2023. Overall, the trend shows an initial increase during the pandemic period (2019–2020), followed by a sustained recovery from 2020 to 2023, with the 2023 rate falling below the 2019 pre-pandemic level.
Mark scheme:
- 1 mark: Correct identification of the peak (3.0% in 2020) and the general trend of decline from 2020 to 2023.
- 1 mark: Recognition that the 2023 rate (2.0%) is lower than the 2019 rate (2.3%), or equivalent accurate description of the full trend.
Common mistakes:
- Only describing the increase from 2019 to 2020 without mentioning the subsequent decline.
- Stating "unemployment decreased from 2019 to 2023" without acknowledging the 2020 spike.
Question 3 [3 marks]
Answer: Government spending on public hospitals rose from S5.2billionin2019∗∗toapeakof∗∗S7.8 billion in 2020, before declining to S6.5billionin2023∗∗—stillabovethe2019level.Communitycarespendingincreasedmoresharply,from∗∗S0.6 billion in 2019 to S1.5billionin2020∗∗(a1501.3 billion in 2023. Both sectors saw spending peak in 2020 due to the pandemic, but community care spending grew proportionally much more than public hospital spending, reflecting the government's emphasis on managing COVID-19 cases outside acute hospital settings.
Mark scheme:
- 1 mark: Correct data reference for public hospital spending (at least two years cited).
- 1 mark: Correct data reference for community care spending (at least two years cited).
- 1 mark: Clear comparison using comparative language, noting that both peaked in 2020 and that community care saw a proportionally larger increase.
Common mistakes:
- Only describing one sector without comparing.
- Failing to cite specific figures from Table 2.
- Not noting the proportional difference in growth between the two sectors.
Question 4 [5 marks]
Answer: The inflation rate rose significantly from 2.3% in 2021 to 6.1% in 2022. Two possible reasons are:
Reason 1: Demand-pull inflation The strong GDP growth of 8.9% in 2021 and 3.6% in 2022 indicates a rapidly expanding economy as Singapore emerged from the pandemic. Rising aggregate demand — driven by pent-up consumer spending, recovery in the labour market (unemployment falling from 2.7% to 2.1%), and the reopening of the economy — would have put upward pressure on the general price level, leading to demand-pull inflation.
Reason 2: Cost-push inflation The disruption to global supply chains during and after the pandemic would have increased the cost of imported goods and raw materials for Singapore, a highly trade-dependent economy. Rising import costs shift the short-run aggregate supply curve to the left, causing cost-push inflation. Additionally, the strong GDP growth in 2021 may have led to tight labour markets, pushing up wages and further increasing production costs.
Mark scheme:
- 1 mark: Correct identification of the inflation change (2.3% to 6.1%).
- 2 marks: Explanation of demand-pull inflation with reference to the data (e.g., GDP growth, falling unemployment) — 1 mark for identifying the concept, 1 mark for linking to data.
- 2 marks: Explanation of cost-push inflation with reference to the data or Singapore's economic context — 1 mark for identifying the concept, 1 mark for linking to data/context.
Common mistakes:
- Stating reasons without explaining the economic mechanism.
- Not referencing the data from Table 1.
- Confusing demand-pull and cost-push inflation.
Question 5 [8 marks]
Answer: The data reveals a clear pattern of government healthcare spending responding to the economic disruption caused by the COVID-19 pandemic.
Pattern 1: Sharp increase in 2020 Total healthcare spending surged from S7.6billionin2019∗∗to∗∗S11.7 billion in 2020 — a 54% increase. This was driven primarily by public hospital spending (S5.2bn→S7.8bn) and community care (S0.6bn→S1.5bn). This coincided with the GDP contraction of -4.1% and the spike in unemployment to 3.0%, indicating the government increased healthcare spending as a counter-cyclical fiscal measure and in direct response to the health crisis.
Pattern 2: Gradual normalisation from 2021–2022 As the economy recovered (GDP growth of 8.9% in 2021 and 3.6% in 2022), healthcare spending declined to S$9.5 billion in 2022. This reflects the winding down of emergency pandemic measures as the health situation stabilised.
Pattern 3: Slight rebound in 2023 Spending rose slightly to S$10.0 billion in 2023, even as GDP growth slowed to 1.1%. This suggests a structural shift — the government is maintaining higher baseline healthcare spending, possibly due to an ageing population and lessons learned from the pandemic about healthcare system resilience.
Economic rationale: The government's response demonstrates the use of discretionary fiscal policy to address both a public health emergency and an economic downturn. The spending increase in 2020 served a dual purpose: managing the health crisis and providing fiscal stimulus to support aggregate demand during the recession. The sustained higher spending levels post-pandemic suggest recognition of healthcare as a merit good with positive externalities, where government provision is necessary to correct market failure.
Mark scheme:
- 2 marks: Identification of at least two clear patterns in the data with specific figures cited.
- 2 marks: Explanation of the economic rationale linking spending changes to economic conditions (e.g., counter-cyclical policy, pandemic response).
- 2 marks: Use of relevant economic terminology (e.g., fiscal policy, merit good, aggregate demand).
- 2 marks: Coherent analysis that synthesises data from both tables and demonstrates integrated economic thinking.
Level descriptors:
- 6–8 marks: Detailed data reference, clear pattern identification, strong economic reasoning, effective use of terminology, coherent synthesis.
- 3–5 marks: Some data reference, basic pattern identification, limited economic reasoning, some terminology.
- 1–2 marks: Minimal data reference, weak or no economic reasoning.
Section B: Diagram and Application (20 marks)
Question 6 [4 marks]
(a) [1 mark]
Answer: After the subsidy, the equilibrium price of EVs falls from 80,000to65,000, and the equilibrium quantity rises from 10,000 to 18,000 units.
(b) [3 marks]
Answer: The subsidy effectively lowers the cost of production for EV suppliers, shifting the supply curve from S1 to S2. This results in a lower market price (65,000insteadof80,000) and a higher quantity traded (18,000 instead of 10,000).
Effect on consumers: Consumers benefit from the lower price. The price they pay falls by $15,000 per unit, increasing consumer surplus. More consumers can now afford EVs, leading to greater access to the product.
Effect on producers: Producers receive the market price ($65,000) plus the per-unit subsidy, meaning their effective revenue per unit is higher than the market price. This incentivises them to produce more EVs. Producer surplus also increases because they sell more units at a higher effective price.
Mark scheme:
- 1 mark: Consumers benefit from lower prices and increased consumer surplus.
- 1 mark: Producers benefit from higher effective revenue and increased output.
- 1 mark: Clear explanation of the mechanism (subsidy shifts supply curve right, lowering price and raising quantity).
Common mistakes:
- Stating that the subsidy shifts the demand curve (it shifts supply).
- Not distinguishing between the price consumers pay and the effective price producers receive.
Question 7 [4 marks]
(a) [2 marks]
Answer: Using the midpoint (arc elasticity) method:
PED=%ΔP%ΔQd
%ΔQd=(Q2+Q1)/2Q2−Q1×100=(38+45)/238−45×100=41.5−7×100=−16.87%
%ΔP=(P2+P1)/2P2−P1×100=(2.00+1.50)/22.00−1.50×100=1.750.50×100=28.57%
PED=28.57%−16.87%=−0.59
PED = -0.59 (or 0.59 in absolute terms)
Mark scheme:
- 1 mark: Correct formula and substitution.
- 1 mark: Correct final answer (-0.59 or 0.59).
(b) [2 marks]
Answer: Since the absolute value of PED (0.59) is less than 1, demand is price inelastic over this price range. This means that when the price of rice rises, the percentage fall in quantity demanded is proportionally smaller than the percentage rise in price. As a result, total consumer expenditure on rice increases when the price rises. This is significant because rice is a staple food for low-income consumers — a price increase would burden them disproportionately, as they cannot easily reduce consumption.
Mark scheme:
- 1 mark: Correct identification that demand is price inelastic (|PED| < 1).
- 1 mark: Correct explanation that total consumer expenditure rises when price rises (because demand is inelastic).
Common mistakes:
- Forgetting to use the midpoint method and getting a different answer.
- Stating PED is positive (PED for normal goods is always negative due to the law of demand; the negative sign should be included or the absolute value stated).
Question 8 [5 marks]
(a) [1 mark]
Answer:
- Market equilibrium quantity (Qm) = 100 million packs
- Socially optimal quantity (Qs) = 70 million packs
(b) [2 marks]
Answer: The market equilibrium quantity exceeds the socially optimal quantity because cigarettes generate negative externalities (external costs) such as passive smoking, increased healthcare costs, and reduced workplace productivity. In a free market, consumers and producers only consider their private costs and benefits (reflected by the MPC and MPB curves). They do not account for the external costs imposed on third parties. The marginal social cost (MSC) is therefore higher than the marginal private cost (MPC). The socially optimal quantity occurs where MSB = MSC (at Qs = 70 million), but the market overproduces at Qm = 100 million because it ignores the external cost.
Mark scheme:
- 1 mark: Identification of negative externalities as the reason for the divergence.
- 1 mark: Explanation that the market ignores external costs, leading to overproduction relative to the social optimum.
(c) [2 marks]
Answer: Deadweight loss (DWL) is the loss of economic welfare due to overproduction. It is the area of the triangle between the MSC and demand curves from Qs to Qm.
DWL=21×base×height
DWL=21×(Qm−Qs)×MEC
DWL=21×30 million×$4
DWL=$60 million
Mark scheme:
- 1 mark: Correct formula for the area of a triangle.
- 1 mark: Correct final answer ($60 million).
Common mistakes:
- Using the full quantity (100 million) instead of the difference (30 million).
- Forgetting the ½ in the triangle area formula.
Question 9 [7 marks]
Answer:
Impact on the market for commercial office space:
The rise in remote work has significantly affected the commercial office market in Singapore. The increase in remote work (from 15% in 2019 to 42% in 2022) has reduced the demand for traditional office space. Firms require less physical office space when employees work from home, shifting the demand curve for commercial office space to the left. This is evidenced by the rise in CBD vacancy rates from 4.2% to 8.7% and the 12% fall in average commercial rents.
On the supply side, the supply of existing office space is relatively price inelastic in the short run because buildings cannot be easily converted or demolished. The combination of falling demand and relatively inelastic supply leads to a significant fall in equilibrium rental prices and an increase in vacancy rates.
However, the effect is not uniform across all segments. Demand for suburban co-working spaces has increased by 35%, indicating a shift in the type of office space demanded rather than a uniform decline. This represents a structural change in the market.
Impact on overall economic efficiency:
From an efficiency perspective, the shift to remote work has mixed effects:
Potential efficiency gains:
- Firms save approximately S$1,200 per employee per month on office costs, reducing their overheads and potentially improving allocative efficiency.
- Reduced commuting lowers negative externalities such as traffic congestion and air pollution, moving the economy closer to the socially optimal level of commuting.
- The S$2 billion investment in digital infrastructure may improve long-run productive efficiency.
Potential efficiency losses:
- The 5–8% productivity decline in collaborative roles suggests that remote work may create information asymmetries and coordination failures, leading to productive inefficiency.
- The underutilisation of CBD office space represents a misallocation of resources — existing capital is not being used efficiently.
- There may be negative externalities for CBD businesses (restaurants, retail) that depend on office worker footfall.
Market failures: The shift may create market failures. The decline in CBD economic activity could lead to negative externalities for businesses and workers who depend on the office economy. Additionally, the benefits of digital infrastructure investment have characteristics of a public good (non-rivalrous and partially non-excludable), meaning private markets may underprovide it — justifying the government's S$2 billion investment.
Evaluation: The net impact on economic efficiency depends on whether the cost savings and reduced externalities from less commuting outweigh the productivity losses and resource misallocation. In the long run, if firms adapt their work practices and the government's digital infrastructure investment raises productivity, the shift could improve overall efficiency. However, the transition period involves significant adjustment costs and potential market failures that require government intervention.
Mark scheme:
- 2 marks: Analysis of the impact on the commercial office market with reference to demand/supply shifts and data from the extract.
- 2 marks: Discussion of efficiency gains with economic reasoning and reference to the extract.
- 2 marks: Discussion of efficiency losses and/or market failures with economic reasoning.
- 1 mark: Evaluative conclusion that weighs the arguments and reaches a reasoned judgement.
Level descriptors:
- 6–7 marks: Comprehensive analysis, effective use of data, clear economic reasoning, balanced evaluation with a reasoned conclusion.
- 4–5 marks: Good analysis with some data reference and economic reasoning, limited evaluation.
- 1–3 marks: Basic or descriptive response, limited economic analysis, little or no evaluation.
Section C: Policy Evaluation (20 marks)
Question 10 [6 marks]
Answer:
Option A: Increase COE quota for EVs while maintaining petrol vehicle COE prices
This policy would reduce the effective price of EVs relative to petrol vehicles, increasing the demand for EVs along the demand curve (movement along the demand curve for petrol vehicles as consumers substitute). The cross-price elasticity of demand between EVs and petrol vehicles would determine the magnitude of the substitution effect.
Effectiveness: This policy is likely to be moderately effective in reducing congestion. While it encourages a shift to EVs, it does not directly reduce the total number of vehicles on the road. In fact, by making vehicle ownership cheaper for EV buyers, it could increase the total number of vehicles, potentially worsening congestion. The policy addresses the type of vehicles rather than the quantity of traffic.
Impact on consumers: EV buyers benefit from lower costs, but petrol vehicle buyers face unchanged prices. Lower-income consumers who cannot afford EVs (even with a larger COE quota) may not benefit. There is also a potential equity issue as the policy disproportionately benefits higher-income individuals who can afford EVs.
Limitations: The policy does not address the root cause of congestion — the overuse of road space. It may also lead to increased total vehicle numbers, partially offsetting any congestion reduction from cleaner vehicles.
Option B: Introduce a congestion charge of $5 per CBD entry during peak hours
This policy increases the private cost of driving into the CBD during peak hours, effectively shifting the demand curve for CBD road usage to the left. It applies the polluter pays principle by making drivers internalise the external cost of congestion.
Effectiveness: This policy is likely to be more effective at reducing congestion because it directly targets the behaviour of all drivers during peak hours. By raising the cost of driving, it encourages drivers to switch to public transport, carpool, travel at off-peak times, or work from home. The price mechanism rations the scarce road space more efficiently.
Impact on consumers: All drivers face higher costs, but the burden falls disproportionately on lower-income drivers who may have fewer alternatives to driving. Higher-income drivers are less price-sensitive and may continue driving, making the charge potentially regressive. However, revenue from the charge could be reinvested in public transport, benefiting all income groups.
Limitations: The effectiveness depends on the price elasticity of demand for CBD travel. If demand is inelastic (e.g., workers with no alternative transport), the charge may raise revenue but have limited impact on congestion. There is also the risk of displacement — congestion may shift to areas just outside the charging zone.
Comparison: Option B is likely more effective at directly reducing congestion because it targets the quantity of vehicles rather than the type. However, Option A has environmental benefits and may be more politically acceptable. A combination of both policies would likely be most effective.
Mark scheme:
- 2 marks: Analysis of Option A with economic reasoning (substitution effect, impact on total vehicles, equity).
- 2 marks: Analysis of Option B with economic reasoning (polluter pays, PED, regressive impact).
- 1 mark: Clear comparison of the two policies.
- 1 mark: Evaluative judgement on relative effectiveness.
Level descriptors:
- 5–6 marks: Detailed analysis of both policies, clear economic reasoning, effective comparison, reasoned evaluative judgement.
- 3–4 marks: Analysis of both policies with some economic reasoning, limited comparison or evaluation.
- 1–2 marks: Basic description of policies with little economic analysis.
Question 11 [6 marks]
Answer:
Short-run effects on firms:
In the short run, the carbon tax increases the marginal private cost of production for the 50 large emitters, particularly in the petrochemical and refining industries. Firms face higher costs per unit of output, which shifts their supply curve to the left. For firms with price inelastic demand for their products (e.g., petrochemicals with few substitutes), they may be able to pass a significant portion of the tax onto consumers through higher prices. However, for firms facing price elastic demand (e.g., those competing in international markets), they may have to absorb more of the tax, reducing profit margins.
The critics' concern about reduced international competitiveness is valid in the short run. Singapore's petrochemical and refining industries (18% of exports) compete globally, and a higher carbon tax raises their relative production costs compared to competitors in countries without equivalent carbon pricing. This could lead to a fall in export demand and a deterioration of the current account balance.
Long-run effects on firms and the economy:
In the long run, the carbon tax creates a dynamic incentive for firms to invest in energy-efficient technologies and cleaner production methods. As the tax rises to 50–80 per tCO₂e by 2030, the cost of inaction increases, making green investments more attractive. Firms that innovate early may achieve first-mover advantages in the growing global green economy.
The government's commitment to using revenue for green initiatives and business transition support helps mitigate short-run costs and facilitates the structural shift. This is an example of supply-side policy that aims to improve long-run productive efficiency.
Evaluation — do benefits outweigh costs?
The benefits are likely to outweigh the costs in the long run, but the short-run adjustment costs are significant:
Benefits:
- Reduced negative externalities from carbon emissions (improved air quality, health benefits, contribution to climate goals).
- Incentive for innovation and adoption of green technology, potentially creating new industries and export opportunities.
- Singapore positions itself as a green economy leader, attracting sustainable investment.
- Revenue recycling supports the transition.
Costs:
- Short-run loss of competitiveness in carbon-intensive export industries.
- Higher production costs may be passed to consumers as higher prices.
- Risk of carbon leakage — firms relocating production to countries with lower environmental standards.
The net benefit depends on the speed of technological adaptation, the global trajectory of carbon pricing (if other countries follow, Singapore's competitiveness concern diminishes), and the effectiveness of government support for the transition.
Mark scheme:
- 2 marks: Analysis of short-run effects on firms with economic reasoning (cost increase, supply shift, competitiveness).
- 2 marks: Analysis of long-run effects with economic reasoning (innovation, dynamic efficiency, green economy).
- 1 mark: Identification of benefits.
- 1 mark: Identification of costs and evaluative judgement on whether benefits outweigh costs.
Level descriptors:
- 5–6 marks: Comprehensive analysis of short-run and long-run effects, clear economic reasoning, balanced evaluation with reasoned judgement.
- 3–4 marks: Good analysis of effects with some economic reasoning, limited evaluation.
- 1–2 marks: Basic description with little economic analysis.
Question 12 [8 marks]
Answer:
GDP per capita as an initial indicator: Country Y has a significantly higher GDP per capita (US48,000)comparedtoCountryX(US12,500), suggesting a higher average income and potentially higher material standard of living. However, GDP per capita alone is an incomplete measure of the standard of living.
Limitations of GDP per capita:
- It does not account for income distribution. Country Y has a higher Gini coefficient (0.45) than Country X (0.38), indicating greater income inequality. This means the average income in Country Y may be skewed by high earners, and many citizens may have a lower standard of living than the average suggests.
- GDP per capita does not capture non-material aspects of living standards such as healthcare quality, education access, environmental quality, or work-life balance.
- It does not reflect the composition of GDP — whether output is in consumer goods or capital goods, or whether growth is sustainable.
Healthcare and education spending: Country X spends significantly more on both healthcare (8.1% of GDP vs. 4.2%) and education (5.2% of GDP vs. 3.8%). These investments in human capital are critical for long-run improvements in the standard of living. Higher education spending improves workforce productivity and innovation capacity, while higher healthcare spending improves life expectancy and quality of life. These investments suggest Country X is building the foundations for sustained long-run growth and development.
Inflation and macroeconomic stability: Country X has a lower inflation rate (1.2% vs. 3.5%), indicating greater price stability. Lower inflation preserves the purchasing power of incomes and reduces uncertainty for consumers and businesses, contributing to a more stable and predictable standard of living. Country Y's higher inflation may erode real incomes over time, particularly for those on fixed incomes.
Current account balance: Country Y has a current account surplus (+4.3% of GDP), while Country X has a deficit (-2.1%). A surplus may indicate strong export competitiveness and high national savings, which can fund future investment. However, a persistent deficit in Country X could indicate reliance on foreign borrowing, which may be unsustainable. Alternatively, the deficit could reflect high levels of productive investment (imports of capital goods), which could boost future growth.
Evaluation: In the long run, Country X may achieve a higher standard of living despite its lower current GDP per capita. Its greater investment in human capital (healthcare and education), more equitable income distribution (lower Gini), and lower inflation provide a stronger foundation for sustainable and inclusive growth. Country Y's higher GDP per capita is offset by greater inequality, lower social spending, and higher inflation, which may constrain improvements in the standard of living for the majority of its population.
However, this evaluation depends on the efficiency of Country X's government spending and its ability to translate education and healthcare investment into productivity gains. If Country X's spending is inefficient or plagued by corruption, the expected benefits may not materialise. Similarly, if Country Y's current account surplus reflects strong export industries that generate high-quality employment, its growth trajectory may be more robust than the data initially suggests.
Mark scheme:
- 2 marks: Discussion of GDP per capita with identification of its limitations.
- 2 marks: Analysis of healthcare and education spending and their implications for long-run living standards.
- 1 mark: Analysis of inflation differences.
- 1 mark: Analysis of current account balances.
- 2 marks: Evaluative conclusion that weighs multiple factors and reaches a reasoned judgement about which country is likely to achieve a higher standard of living in the long run.
Level descriptors:
- 7–8 marks: Comprehensive analysis of multiple indicators, clear economic reasoning, effective use of data, balanced evaluation with a well-supported conclusion.
- 5–6 marks: Good analysis of several indicators with economic reasoning, some evaluation.
- 3–4 marks: Analysis of some indicators with limited economic reasoning, weak evaluation.
- 1–2 marks: Basic description of data with little or no economic analysis.
Section A Total: 20 marks | Section B Total: 20 marks | Section C Total: 20 marks | Grand Total: 60 marks
Free quiz and exam paper access
Enter your details to view this paper
Your access is remembered on this device.