From Real Exams Exam Paper
A Level H1 Economics Practice Paper 5
Free A Level H1 Econs Practice Paper 5, HY3 Exam version, with questions, answers, and A Level-style practice for Singapore students.
These static practice materials are generated from the site's syllabus and paper-generation workflow, with source and model context shown so students and parents can evaluate the material before use.
Questions
Free quiz and exam paper access
Enter your details to view this paper
Your access is remembered on this device.
Answers
Answer Key – TuitionGoWhere Practice Paper Economics H1 A-Level (Version 5)
Total Marks: 60
Section A: 21 marks | Section B: 21 marks | Section C: 18 marks
Section A Answers (Q1–Q7)
Q1 [2 marks]
- Both primary and university expenditure per student increased from 2020 to 2024. [1]
- University spending remained higher in absolute terms (24,000) than primary (10,000), and the gap widened slightly. [1]
Teaching note: Compare both sectors with connective "both… but". Avoid stating only one row.
Q2 [2 marks]
- Online retail sales increased substantially from 7.8b (2024). [1]
- This is an increase of approx. 86% over three years, showing rapid growth. [1]
Marking: Direction [1], magnitude/rate [1].
Q3 [2 marks]
- Both countries' real GDP growth fell over the period. [1]
- Country A fell from 3.5% to 1.2%, Country B from 2.1% to 0.7%; Country A stayed above B but both declined. [1]
Q4 [2 marks]
- Unemployment rose in both: A 4.0%→5.5%, B 6.5%→8.0%. [1]
- B had persistently higher unemployment than A throughout. [1]
Q5 [2 marks]
- PED is likely elastic (|PED|>1) because 80% switched due to price differences, showing high responsiveness. [1]
- Many substitutes available among platforms increase elasticity. [1]
Formula: PED = %ΔQd / %ΔP; value interpreted via extract.
Q6 [2 marks]
- PES for preschool likely inelastic (|PES|<1) in short run. [1]
- 2-year training limits quick supply expansion despite demand. [1]
Q7 [3 marks]
Working:
% increase = (10,000 – 8,200) / 8,200 × 100
= 1,800 / 8,200 × 100
= 21.95% ≈ 22.0% [3 for correct method and answer, 2 if minor calc error, 1 for formula only]
Teaching: %Δ = (new−old)/old ×100.
Section B Answers (Q8–Q14)
Q8 [3 marks]
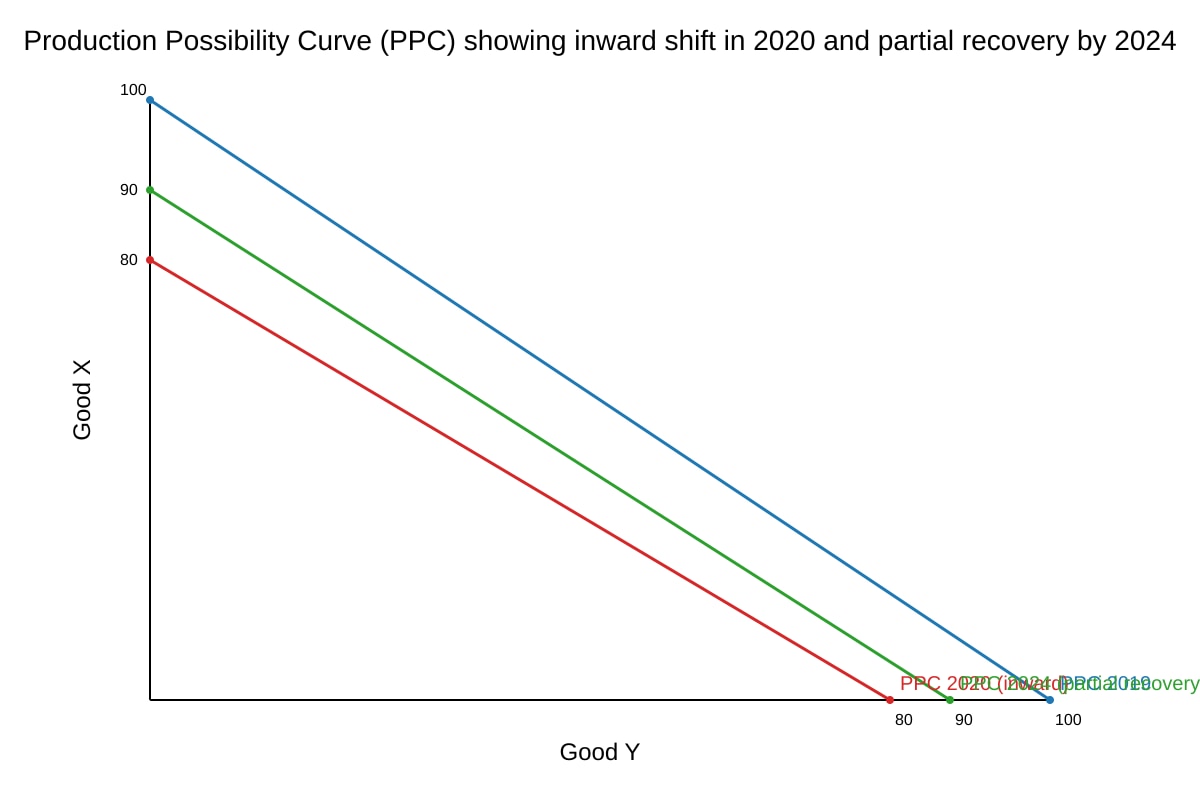
- PPC shows max combos of X and Y with full resource use. [1]
- 2020 curve inside 2019 shows under-utilisation (unemployment). [1]
- Points inside PPC = resources idle, e.g. labour not employed. [1]
Q9 [2 marks]
- 2020→2024 curve moved outward partially (from (80,0) to (90,0)). [1]
- Indicates recovery in productive capacity, not full 2019 level. [1]
Q10 [3 marks]
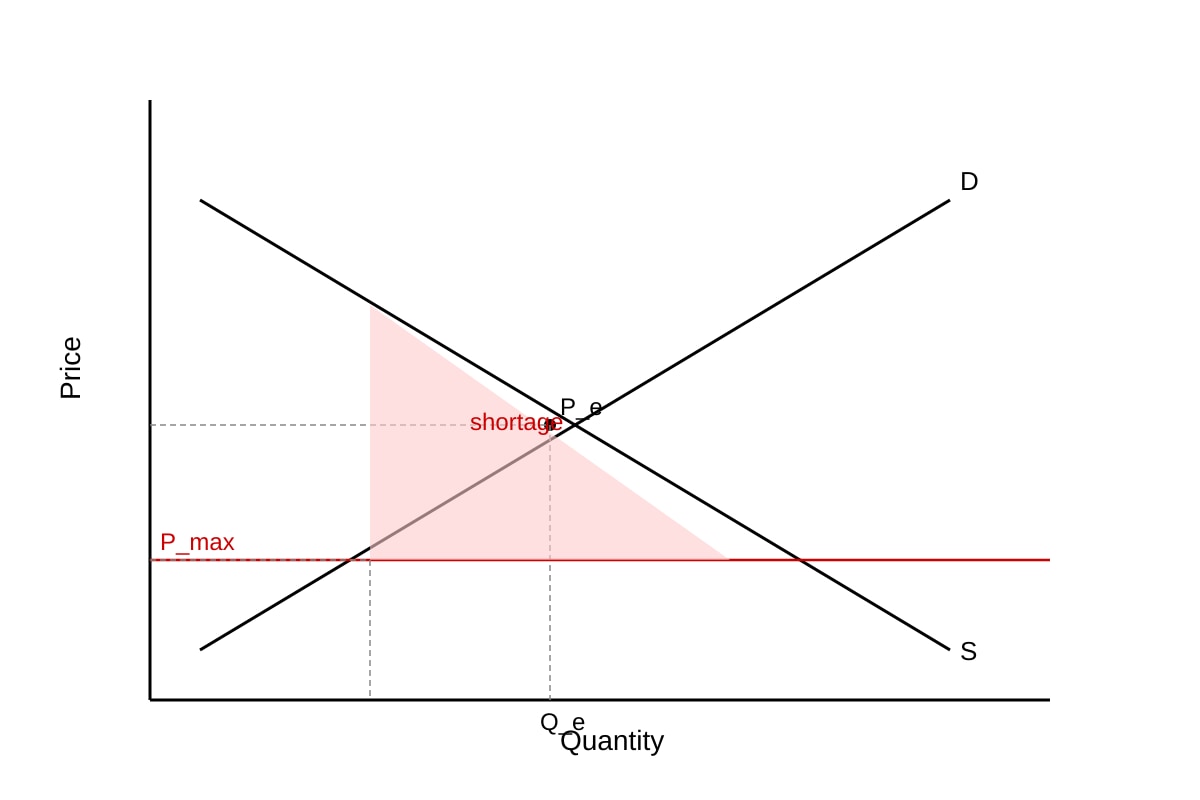
- Diagram: D downward, S upward, intersect at P_e,Q_e. [1]
- P_max horizontal below P_e. [1]
- Shortage = Qd – Qs at P_max, shaded. [1]
Q11 [3 marks]
- AD = C+I+G+(X−M); fall in I shifts AD left. [1]
- New equilibrium at lower real GDP and price. [1]
- Diagram shows AD1→AD2 left, output falls. [1]
Q12 [2 marks]
- GDP growth fell (3.5→1.2%) so firms hire less. [1]
- Cyclical unemployment rose as demand contracted. [1]
Q13 [3 marks]
- Subsidy lowers producer cost, S shifts right. [1]
- Equilibrium price falls, quantity rises. [1]
- Diagram with S1→S2 right, P↓ Q↑. [1]
Q14 [3 marks]
- B's unemployment rose to 8%, GDP growth fell to 0.7% → likely worse living std. [1]
- But no income/health data; material living std proxy only. [1]
- Evaluation: multi-indicator needed; partial conclusion. [1]
Section C Answers (Q15–Q20)
Q15 [3 marks]
- Tax internalises externality, MSB=MSC nearer social optimum. [1]
- Revenue funds correction; but may hit low-income. [1]
- Effectiveness needs enforcement, inelastic demand limits effect. [1]
Q16 [3 marks]
- Equity: primary gap smaller, fair access. [1]
- Efficiency: university yields higher skilled return. [1]
- Trade-off: budget limit means prioritisation; evaluate both. [1]
Q17 [3 marks]
- Elastic demand: price cut raises total revenue (%Qd↑ > %P↓). [1]
- Platform competition forces price cuts, revenue may rise if volume grows. [1]
- But if all cut, margin falls; eval. [1]
Q18 [2 marks]
- Parents may lack info on quality → over/under demand. [1]
- Market fails to allocate efficient preschool places. [1]
Q19 [3 marks]
- Quota: direct limit, fast but rigid. [1]
- Subsidy: incentivises supply, slow due training. [1]
- Trade-off: cost, speed, distortion. [1]
Q20 [4 marks]
- A: unemployment up but lower than B, GDP growth positive. [1]
- B: higher unemployment, near-zero growth. [1]
- A managed stability better on both indicators. [1]
- Caveat: no inflation/data depth; conclusion qualified. [1]
End of Answer Key. Marks sum: 60.