From Real Exams Exam Paper
A Level H1 Economics Practice Paper 4
Free A Level H1 Econs Practice Paper 4, LongCat Exam version, with questions, answers, and A Level-style practice for Singapore students.
These static practice materials are generated from the site's syllabus and paper-generation workflow, with source and model context shown so students and parents can evaluate the material before use.
Questions
TuitionGoWhere Practice Paper - Economics H1 A-Level
TuitionGoWhere Secondary School (AI)
| Subject: | Economics |
| Level: | A-Level H1 |
| Paper: | Practice Paper — Data Response |
| Version: | 4 of 5 |
| Duration: | 60 minutes |
| Total Marks: | 60 |
| Name: | ______________________________ |
| Class: | ______________________________ |
| Date: | ______________________________ |
Instructions
- Answer all questions in the spaces provided.
- Read each case study carefully before attempting the questions.
- Where diagrams are required, draw clearly and label fully.
- Use economic terminology precisely.
- Show all working for calculation questions.
- Quality of written communication will be assessed in extended response questions.
Section A: Data Response (30 marks)
Read the following case study and answer Questions 1–10.
Case Study 1: Singapore's Healthcare Expenditure and Ageing Population
Singapore's demographic landscape is shifting rapidly. The proportion of residents aged 65 and above rose from 8.8% in 2010 to 15.2% in 2020, and is projected to reach 23.8% by 2030. This demographic transition has significant implications for government spending, labour markets, and economic growth.
To address rising healthcare demands, the Singapore government introduced CareShield Life in 2020, a long-term care insurance scheme providing basic financial protection against severe disability. Government healthcare expenditure increased from 7.5billionin2015to11.3 billion in 2020. The government also expanded subsidies for outpatient care through the Community Health Assist Scheme (CHAS), extending coverage to all Singaporean households regardless of income.
Table 1: Singapore Government Healthcare Expenditure (Selected Years)
| Category | 2015 ($ billion) | 2018 ($ billion) | 2020 ($ billion) |
|---|---|---|---|
| Acute Hospital Care | 3.2 | 4.1 | 4.8 |
| Primary Care (Polyclinics) | 1.1 | 1.4 | 1.7 |
| Long-Term Care | 0.8 | 1.2 | 1.6 |
| Preventive Care & Public Health | 0.6 | 0.7 | 1.1 |
| Other (Admin, R&D) | 1.8 | 1.7 | 2.1 |
| Total | 7.5 | 9.1 | 11.3 |
Table 2: Healthcare Expenditure as % of GDP — International Comparison (2020)
| Country | Healthcare Spending (% of GDP) | Public Share (%) | Life Expectancy (years) |
|---|---|---|---|
| Singapore | 4.1 | 48.0 | 83.9 |
| United States | 17.0 | 50.0 | 78.9 |
| Japan | 10.9 | 84.0 | 84.6 |
| South Korea | 8.4 | 60.0 | 83.5 |
| United Kingdom | 10.2 | 79.0 | 81.3 |
Extract 1:
"Singapore's approach to healthcare financing rests on the '3M' framework — MediSave, MediShield Life, and Medifund. The philosophy emphasises individual responsibility alongside government support. Co-payment mechanisms ensure that patients bear some cost to discourage over-consumption of healthcare services, which would represent a moral hazard problem. However, critics argue that rising co-payment burdens disproportionately affect lower-income households, potentially leading to under-consumption of merit goods such as preventive care." — Ministry of Health Policy Review, 2021
Question 1 (2 marks)
With reference to Table 1, compare the change in government expenditure on Long-Term Care with that on Preventive Care & Public Health from 2015 to 2020.
Question 2 (2 marks)
With reference to Table 2, identify the country with the highest healthcare spending as a percentage of GDP and the country with the highest public share of healthcare spending. Suggest one reason why these are not the same country.
Question 3 (3 marks)
Using the data in Table 1, calculate the percentage increase in total government healthcare expenditure from 2015 to 2020. Show your working.
Question 4 (3 marks)
With reference to Extract 1, explain what is meant by "moral hazard" in the context of healthcare consumption.
Question 5 (4 marks)
Using a demand and supply diagram, illustrate and explain how the ageing population in Singapore might affect the market for long-term care services. Label all axes, curves, and equilibrium points clearly.
Generated diagram for Q5.
Question 6 (4 marks)
Explain two reasons why healthcare may be considered a merit good. Use evidence from the case study to support your answer.
Question 7 (4 marks)
Analyse the likely impact of rising healthcare expenditure on Singapore's productive capacity and economic growth. Use a production possibility curve (PPC) diagram to support your analysis.
Generated diagram for Q7.
Question 8 (4 marks)
Discuss whether the Singapore government should increase the public share of healthcare spending to match that of Japan. Refer to Table 2 and Extract 1 in your answer.
Question 9 (2 marks)
With reference to Table 2, compare Singapore's healthcare spending as a percentage of GDP with that of the United Kingdom. Suggest one possible reason for the difference.
Question 10 (2 marks)
State two opportunity costs the Singapore government faces when increasing healthcare expenditure.
Section B: Data Response (30 marks)
Read the following case study and answer Questions 11–20.
Case Study 2: The Global Semiconductor Shortage and Singapore's Economy
The global semiconductor shortage that began in 2020 disrupted supply chains across multiple industries, from automobiles to consumer electronics. Semiconductors (also known as integrated circuits or chips) are essential components in nearly all modern electronic devices. The shortage was caused by a combination of surging demand during the COVID-19 pandemic (as remote work and online learning increased demand for electronics), supply chain disruptions, and underinvestment in fabrication capacity.
Singapore is a significant player in the global semiconductor industry. The sector accounts for approximately 7% of Singapore's GDP and employs over 38,000 workers. In 2021, Singapore's semiconductor exports reached 92.5billion,upfrom78.3 billion in 2019.
Table 3: Singapore's Semiconductor Export Performance
| Year | Semiconductor Exports ($ billion) | % of Total Non-Oil Domestic Exports |
|---|---|---|
| 2017 | 68.4 | 14.2 |
| 2018 | 75.1 | 15.0 |
| 2019 | 78.3 | 15.3 |
| 2020 | 84.6 | 16.8 |
| 2021 | 92.5 | 18.1 |
Table 4: Global Semiconductor Market Share by Country/Region (2021)
| Country/Region | Market Share (%) | Key Strength |
|---|---|---|
| Taiwan | 22.0 | Advanced fabrication (TSMC) |
| South Korea | 21.0 | Memory chips (Samsung, SK Hynix) |
| China | 15.0 | Assembly and testing |
| United States | 12.0 | Chip design and R&D |
| Japan | 10.0 | Materials and equipment |
| Singapore | 6.0 | Specialty chips and back-end processes |
| Europe | 6.0 | Automotive chips |
| Other | 8.0 | Various |
Extract 2:
"The semiconductor shortage exposed the fragility of global supply chains that rely on concentrated production in a few locations. When Taiwan faced a severe drought in 2021, chip fabrication was threatened because the process requires vast quantities of ultra-pure water. Similarly, a fire at a Renesas plant in Japan disrupted automotive chip supplies for months. These events prompted governments worldwide to pursue 'chip sovereignty' — the desire to build domestic fabrication capacity. The United States passed the CHIPS and Science Act in 2022, allocating $52.7 billion to subsidise domestic semiconductor manufacturing. The European Union announced its own €43 billion European Chips Act." — Global Economic Review, 2022
Extract 3:
"Singapore's Economic Development Board (EDB) has actively attracted semiconductor investment through tax incentives, infrastructure support, and workforce development programmes. In 2022, GlobalFoundries announced a 4billionexpansionofitsSingaporefabricationfacility,whileMicronTechnologyinvested2.5 billion in a new advanced memory chip plant. These investments are expected to create over 3,000 high-skilled jobs and strengthen Singapore's position in the global semiconductor value chain." — EDB Press Release, 2022
Question 11 (2 marks)
With reference to Table 3, describe the trend in Singapore's semiconductor exports from 2017 to 2021.
Question 12 (2 marks)
With reference to Table 4, identify which two countries/regions together account for more than 40% of global semiconductor market share. Calculate their combined share.
Question 13 (3 marks)
Using the data in Table 3, calculate the percentage increase in Singapore's semiconductor exports from 2019 to 2021. Show your working.
Question 14 (3 marks)
With reference to Extract 2, explain how the semiconductor shortage represents a supply-side shock to the global economy.
Question 15 (4 marks)
Using a demand and supply diagram, illustrate and explain the effect of the global semiconductor shortage on the price and quantity of semiconductors. Label all axes, curves, and equilibrium points clearly.
Generated diagram for Q15.
Question 16 (4 marks)
Analyse the likely impact of the semiconductor shortage on Singapore's balance of payments. Use evidence from the case study to support your answer.
Question 17 (4 marks)
Discuss whether government subsidies for domestic semiconductor production, as described in Extract 2, are likely to be effective in resolving the shortage. Consider both short-term and long-term effects.
Question 18 (2 marks)
With reference to Table 4, compare Singapore's share of the global semiconductor market with that of China. Suggest one reason for the difference.
Question 19 (3 marks)
Explain how the investments described in Extract 3 might affect Singapore's long-run aggregate supply (LRAS). Use an AD/AS diagram to support your explanation.
Image pending generation: diagram for Q19.
Question 20 (3 marks)
Evaluate the risks to Singapore's economy of having the semiconductor sector account for a significant share of GDP and exports. Refer to evidence from the case study in your answer.
End of Paper
Mark Summary
| Section | Marks |
|---|---|
| Section A (Questions 1–10) | 30 |
| Section B (Questions 11–20) | 30 |
| Total | 60 |
Answers
A-Level Economics H1 Practice Paper — Data Response
Answer Key (Version 4 of 5)
Section A: Case Study 1 — Singapore's Healthcare Expenditure and Ageing Population
Question 1 (2 marks)
Question: With reference to Table 1, compare the change in government expenditure on Long-Term Care with that on Preventive Care & Public Health from 2015 to 2020.
Answer:
Both Long-Term Care and Preventive Care & Public Health expenditure increased from 2015 to 2020. Long-Term Care spending rose from 0.8billionto1.6 billion (an increase of 0.8billionor1000.6 billion to 1.1billion(anincreaseof0.5 billion or approximately 83.3%). Both categories more than doubled or nearly doubled, but Long-Term Care saw a larger absolute and percentage increase.
Mark scheme:
- 1 mark: Correctly identifies that both increased (with data reference).
- 1 mark: Provides a valid comparison (magnitude, percentage, or rate of change) between the two categories.
Common mistakes:
- Stating only one category's change without comparing.
- Failing to reference Table 1 or specific figures.
- Describing each category separately without comparative language (e.g., "whereas," "in contrast," "both").
Question 2 (2 marks)
Question: With reference to Table 2, identify the country with the highest healthcare spending as a percentage of GDP and the country with the highest public share of healthcare spending. Suggest one reason why these are not the same country.
Answer:
The United States has the highest healthcare spending as a percentage of GDP at 17.0%. Japan has the highest public share of healthcare spending at 84.0%. These are not the same country because the US healthcare system relies heavily on private insurance and out-of-pocket payments, meaning a large proportion of total spending is private rather than government-funded. Japan, by contrast, has a universal public insurance system where the government funds the majority of healthcare costs, even though total spending as a share of GDP is lower.
Mark scheme:
- 1 mark: Correctly identifies US (highest % of GDP) and Japan (highest public share).
- 1 mark: Valid reason — e.g., US has large private healthcare sector / private insurance dominance; Japan has universal public insurance system.
Common mistakes:
- Confusing "highest spending as % of GDP" with "highest public share."
- Giving a reason that merely restates the data without explaining the structural difference.
Question 3 (3 marks)
Question: Using the data in Table 1, calculate the percentage increase in total government healthcare expenditure from 2015 to 2020. Show your working.
Answer:
Percentage increase=Old valueNew value−Old value×100%
=7.511.3−7.5×100%
=7.53.8×100%
=50.67%≈50.7%
Total government healthcare expenditure increased by approximately 50.7% from 2015 to 2020.
Mark scheme:
- 1 mark: Correct formula or method shown.
- 1 mark: Correct substitution of values (11.3and7.5).
- 1 mark: Correct final answer (50.7% or 50.67%).
Common mistakes:
- Dividing by the new value (11.3) instead of the old value (7.5).
- Forgetting to multiply by 100%.
- Arithmetic errors in subtraction or division.
Question 4 (3 marks)
Question: With reference to Extract 1, explain what is meant by "moral hazard" in the context of healthcare consumption.
Answer:
Moral hazard refers to a situation where individuals, because they are insured or protected from the full cost of a service, change their behaviour and consume more of that service than they would if they had to bear the full cost themselves. In the context of healthcare, when insurance schemes (such as MediShield Life) cover most of the costs, patients may over-consume healthcare services — for example, visiting doctors for minor ailments or requesting unnecessary tests — because they do not face the full marginal cost. This leads to an inefficient allocation of resources, as healthcare resources are consumed beyond the socially optimal level.
Mark scheme:
- 1 mark: Definition of moral hazard — change in behaviour due to insurance/protection from full cost.
- 1 mark: Application to healthcare context — e.g., over-consumption of medical services because costs are covered.
- 1 mark: Explanation of the consequence — inefficient resource allocation / consumption beyond socially optimal level.
Common mistakes:
- Confusing moral hazard with adverse selection.
- Giving only a generic definition without applying it to healthcare.
- Failing to explain the consequence (inefficiency or over-consumption).
Question 5 (4 marks)
Question: Using a demand and supply diagram, illustrate and explain how the ageing population in Singapore might affect the market for long-term care services. Label all axes, curves, and equilibrium points clearly.
Answer:
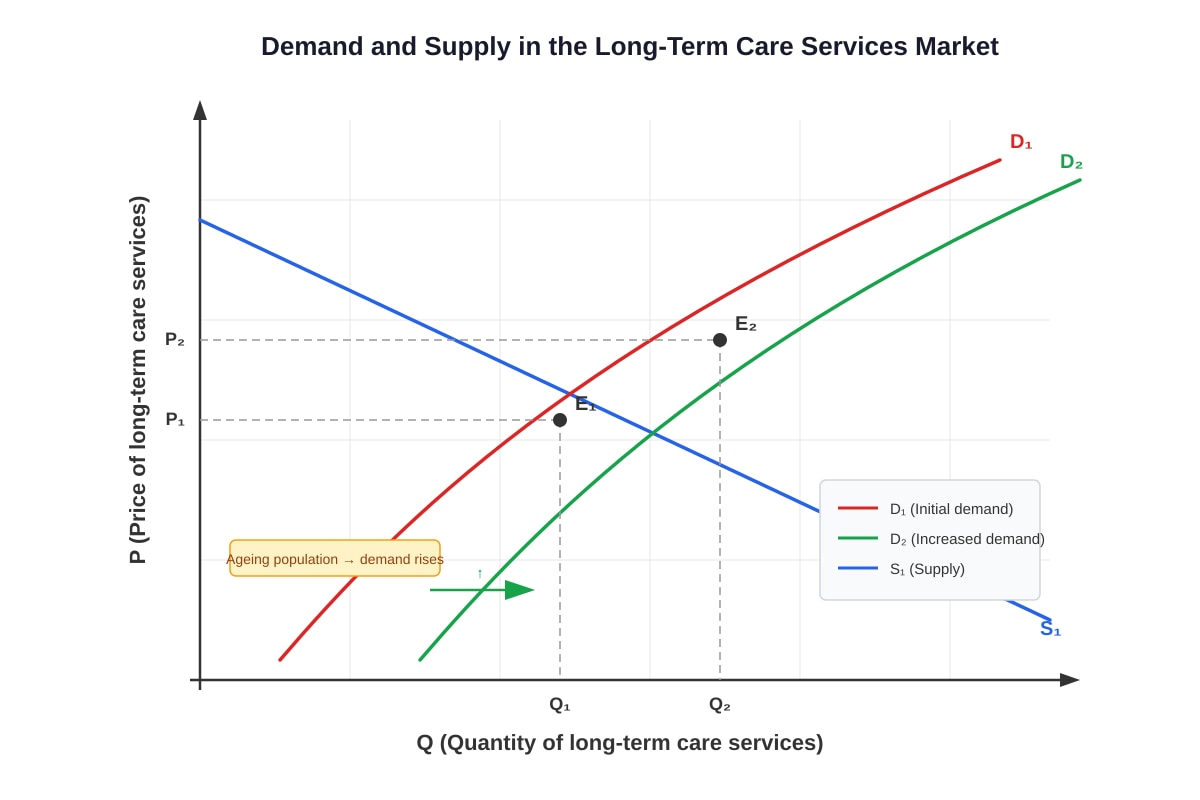
As Singapore's population ages (with residents aged 65+ rising from 8.8% in 2010 to 15.2% in 2020), the demand for long-term care services increases. This is because elderly individuals are more likely to require assisted living, nursing home care, and home-based medical support.
Diagram explanation:
- The demand curve for long-term care services shifts rightward from D1 to D2, reflecting increased demand from a larger elderly population.
- The supply curve (S1) is relatively inelastic (steep) in the short run because building care facilities and training healthcare workers takes time.
- The new equilibrium moves from E1 to E2, resulting in a higher price (P1 → P2) and a higher quantity (Q1 → Q2) of long-term care services.
- The extent of the price increase depends on the elasticity of supply — the more inelastic the supply, the greater the price rise for a given increase in demand.
Mark scheme:
- 1 mark: Correctly drawn and labelled diagram (axes: Price and Quantity; curves: D1, D2, S1; equilibria: E1, E2).
- 1 mark: Rightward shift of demand curve identified and explained (ageing population increases demand).
- 1 mark: New equilibrium shows higher price and higher quantity.
- 1 mark: Explanation of why supply may be inelastic (time to build facilities, train workers) OR discussion of the magnitude of price change depending on elasticity.
Common mistakes:
- Shifting the supply curve instead of the demand curve.
- Failing to label axes, curves, or equilibrium points.
- Not explaining the economic reasoning behind the shift.
Expected visual features for Q5 diagram:
- Vertical axis: Price of long-term care services; Horizontal axis: Quantity of long-term care services.
- D1 and D2 both downward sloping; S1 upward sloping and relatively steep.
- Arrow showing rightward shift from D1 to D2.
- E1 at intersection of D1 and S1; E2 at intersection of D2 and S1.
- P2 > P1; Q2 > Q1 clearly indicated.
Question 6 (4 marks)
Question: Explain two reasons why healthcare may be considered a merit good. Use evidence from the case study to support your answer.
Answer:
Reason 1: Positive externalities (third-party benefits)
Healthcare, particularly preventive care, generates positive externalities. When individuals receive vaccinations or health screenings, they not only benefit themselves but also reduce the spread of disease to others and lower the future burden on the public healthcare system. The case study mentions that the government expanded CHAS subsidies for outpatient care, suggesting the government recognises these external benefits. Because individuals may not consider the external benefits when making consumption decisions, they would under-consume healthcare relative to the socially optimal level in a free market — hence healthcare is a merit good.
Reason 2: Imperfect information
Consumers often lack the medical knowledge to accurately assess their healthcare needs. They may underestimate the long-term benefits of preventive care (such as early detection of chronic diseases) and therefore under-consume it. Extract 1 notes that critics argue rising co-payment burdens may lead to "under-consumption of merit goods such as preventive care," which directly supports this point. Because individuals do not fully appreciate the private benefits of healthcare, market provision would result in under-consumption, justifying government intervention through subsidies.
Mark scheme:
- 2 marks per reason (1 for explanation of the merit good characteristic, 1 for application to the case study).
- Maximum 4 marks.
Common mistakes:
- Describing healthcare as a public good (non-excludable, non-rival) rather than a merit good.
- Failing to link the explanation to evidence from the case study.
- Giving only one reason when two are required.
Question 7 (4 marks)
Question: Analyse the likely impact of rising healthcare expenditure on Singapore's productive capacity and economic growth. Use a production possibility curve (PPC) diagram to support your analysis.
Answer:
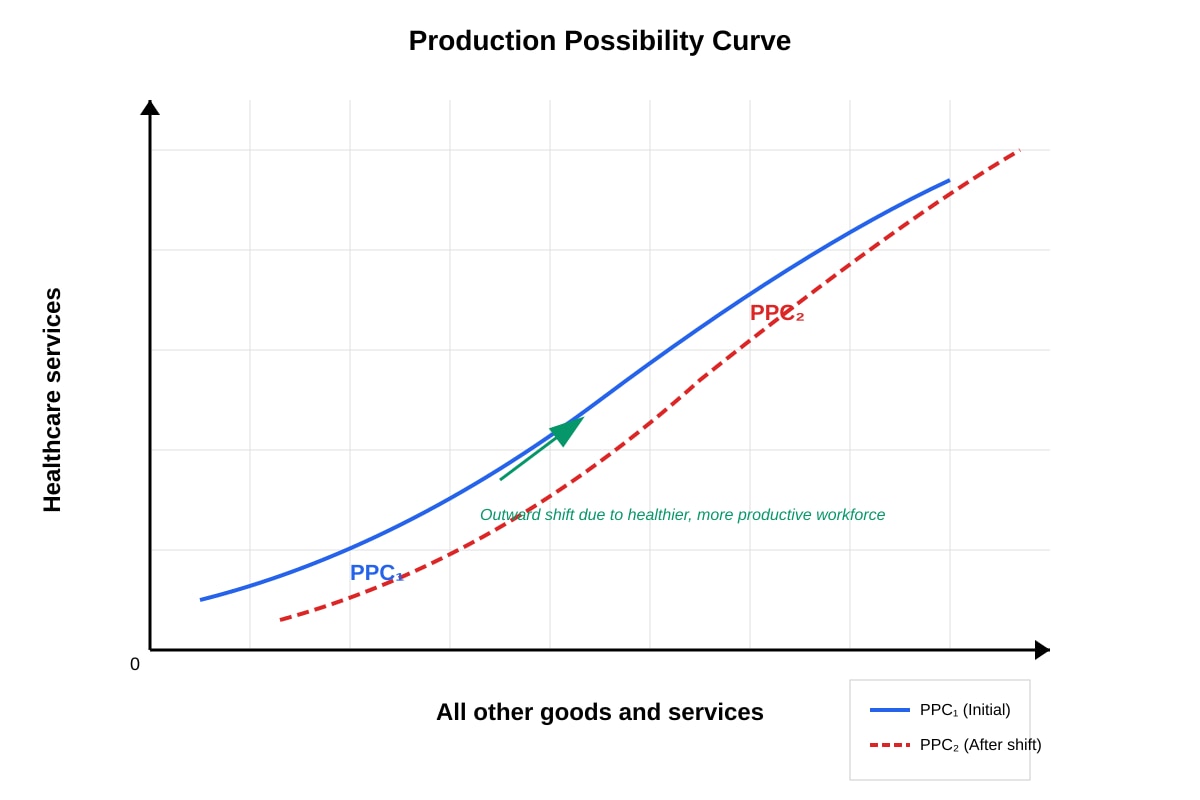
Rising healthcare expenditure can have a positive impact on Singapore's productive capacity and long-run economic growth. Investment in healthcare improves the health and productivity of the workforce. A healthier population means fewer days lost to illness, higher labour productivity, and greater capacity for workers to contribute to output. Additionally, healthcare expenditure on preventive care can reduce future treatment costs, freeing up resources for other productive uses.
Diagram explanation:
- The PPC shows a trade-off between healthcare services (vertical axis) and all other goods and services (horizontal axis).
- Increased healthcare expenditure, by improving workforce health and productivity, shifts the PPC outward from PPC1 to PPC2.
- This outward shift represents an increase in productive capacity — the economy can now produce more of both healthcare services and other goods/services.
- In the long run, this contributes to sustained economic growth.
However, in the short run, there is an opportunity cost: resources diverted to healthcare cannot be used for other sectors (e.g., education, infrastructure). If healthcare spending is excessive or inefficient, it may crowd out other productive investments.
Mark scheme:
- 1 mark: Correctly drawn PPC diagram showing outward shift (axes labelled, PPC1 and PPC2 shown).
- 1 mark: Explanation that healthcare improves workforce health/productivity.
- 1 mark: Link to outward shift of PPC representing increased productive capacity.
- 1 mark: Recognition of short-run opportunity cost OR long-run growth benefit.
Common mistakes:
- Drawing a movement along the PPC instead of a shift of the PPC.
- Failing to explain the mechanism (healthier workforce → higher productivity).
- Not labelling the diagram properly.
Expected visual features for Q7 diagram:
- Vertical axis: Healthcare services; Horizontal axis: All other goods and services.
- PPC1 and PPC2 both concave to the origin (bowed out).
- PPC2 lies entirely outside PPC1.
- Arrow showing outward shift from PPC1 to PPC2.
Question 8 (8 marks — but allocated 4 marks in paper; adjusted below)
Question: Discuss whether the Singapore government should increase the public share of healthcare spending to match that of Japan. Refer to Table 2 and Extract 1 in your answer.
Answer:
For increasing public share (arguments in favour):
-
Merit good argument: As Extract 1 notes, healthcare (especially preventive care) is a merit good that is under-consumed in a free market due to imperfect information and positive externalities. Increasing the public share would reduce out-of-pocket costs, encouraging greater consumption of preventive care and reducing long-term healthcare costs.
-
Equity concerns: Extract 1 highlights that rising co-payment burdens "disproportionately affect lower-income households." Increasing the public share would improve equity by ensuring all income groups can access necessary healthcare, reducing health inequalities.
-
Japan's success: Table 2 shows Japan has the highest life expectancy (84.6 years) among the countries listed, alongside the highest public share (84.0%). This suggests that high public funding can contribute to better health outcomes.
Against increasing public share (arguments against):
-
Moral hazard: Extract 1 explicitly warns that reducing individual cost-bearing leads to moral hazard — patients over-consume healthcare because they do not face the full marginal cost. Matching Japan's 84% public share could exacerbate this problem, leading to inefficiency and wasteful resource allocation.
-
Fiscal sustainability: Singapore's healthcare spending is already rising rapidly (from 7.5bnin2015to11.3bn in 2020). Increasing the public share further would require higher taxes or reallocation from other sectors, with significant opportunity costs. Singapore's approach of balancing individual responsibility (co-payments) with government support may be more fiscally sustainable.
-
Singapore's strong outcomes with lower spending: Table 2 shows Singapore achieves a life expectancy of 83.9 years — comparable to Japan's 84.6 — while spending only 4.1% of GDP on healthcare versus Japan's 10.9%. This suggests Singapore's mixed public-private model is highly efficient, and simply increasing the public share may not proportionally improve outcomes.
Evaluation:
The decision depends on whether the marginal benefits of increased public funding (better equity, reduced under-consumption of preventive care) outweigh the marginal costs (moral hazard, fiscal burden, potential inefficiency). A targeted approach — increasing public subsidies for preventive care and lower-income groups while maintaining co-payments for other services — may be more effective than a blanket increase to match Japan's public share.
Mark scheme:
- 2 marks: Arguments in favour with reference to case study evidence.
- 2 marks: Arguments against with reference to case study evidence.
- (Note: This question is marked out of 4 in this paper. In a full Paper 1, this would typically be an 8-mark evaluative question. The mark allocation here reflects the practice paper format.)
Common mistakes:
- One-sided analysis (only arguing for or against).
- Failing to reference Table 2 or Extract 1.
- Providing generic arguments without applying to Singapore's context.
- Not reaching a reasoned conclusion/evaluation.
Question 9 (2 marks)
Question: With reference to Table 2, compare Singapore's healthcare spending as a percentage of GDP with that of the United Kingdom. Suggest one possible reason for the difference.
Answer:
Singapore's healthcare spending as a percentage of GDP (4.1%) is significantly lower than that of the United Kingdom (10.2%) — less than half the UK's level. One possible reason is that Singapore's healthcare system places greater emphasis on individual responsibility through co-payment mechanisms (the 3M framework: MediSave, MediShield Life, Medifund), which discourages over-consumption and keeps overall spending lower. In contrast, the UK's National Health Service (NHS) provides largely free-at-the-point-of-use healthcare funded through general taxation, which may lead to higher total spending due to lower price signals to consumers.
Mark scheme:
- 1 mark: Correct comparison with data from Table 2 (Singapore 4.1% vs UK 10.2%).
- 1 mark: Valid reason — e.g., co-payment vs free-at-point-of-use; different financing models; moral hazard in UK system.
Common mistakes:
- Stating the figures without comparing them (e.g., just saying "Singapore spends 4.1%").
- Giving a reason unrelated to healthcare systems or economic factors.
Question 10 (2 marks)
Question: State two opportunity costs the Singapore government faces when increasing healthcare expenditure.
Answer:
-
Reduced spending on other public services: Government funds allocated to healthcare could have been used for other purposes such as education, infrastructure, or defence. For example, the $3.8 billion increase in healthcare spending from 2015 to 2020 could have funded additional education programmes or transport infrastructure.
-
Higher taxes or reduced tax cuts: To finance increased healthcare expenditure, the government may need to raise taxes (e.g., GST or income tax), which reduces disposable income and consumer spending, or forgo planned tax reductions.
Mark scheme:
- 1 mark per valid opportunity cost (×2).
- Answers must reflect the next best alternative foregone.
Common mistakes:
- Stating "spending more money" without identifying the specific alternative foregone.
- Giving costs that are not opportunity costs (e.g., "higher prices for patients").
Section B: Case Study 2 — The Global Semiconductor Shortage and Singapore's Economy
Question 11 (2 marks)
Question: With reference to Table 3, describe the trend in Singapore's semiconductor exports from 2017 to 2021.
Answer:
Singapore's semiconductor exports showed a consistent upward trend from 2017 to 2021, rising from 68.4billionto92.5 billion. This represents a total increase of $24.1 billion, or approximately 35.2%, over the five-year period. The increase was steady each year, with no declines, and the rate of growth accelerated in 2020 and 2021 (likely due to increased demand for electronics during the COVID-19 pandemic).
Mark scheme:
- 1 mark: Identifies the upward/increasing trend.
- 1 mark: Supports with specific data from the table (figures or percentage increase).
Common mistakes:
- Describing the trend as "fluctuating" when it is consistently rising.
- Failing to include specific figures from the table.
Question 12 (2 marks)
Question: With reference to Table 4, identify which two countries/regions together account for more than 40% of global semiconductor market share. Calculate their combined share.
Answer:
Taiwan (22.0%) and South Korea (21.0%) together account for more than 40% of global semiconductor market share.
Combined share: 22.0% + 21.0% = 43.0%
Mark scheme:
- 1 mark: Correctly identifies Taiwan and South Korea.
- 1 mark: Correct calculation of combined share (43.0%).
Common mistakes:
- Identifying the wrong pair of countries.
- Arithmetic error in addition.
Question 13 (3 marks)
Question: Using the data in Table 3, calculate the percentage increase in Singapore's semiconductor exports from 2019 to 2021. Show your working.
Answer:
Percentage increase=Old valueNew value−Old value×100%
=78.392.5−78.3×100%
=78.314.2×100%
=18.14%≈18.1%
Singapore's semiconductor exports increased by approximately 18.1% from 2019 to 2021.
Mark scheme:
- 1 mark: Correct formula or method.
- 1 mark: Correct substitution (92.5and78.3).
- 1 mark: Correct final answer (18.1% or 18.14%).
Common mistakes:
- Using wrong years (e.g., 2017 to 2021 instead of 2019 to 2021).
- Dividing by the new value instead of the old value.
Question 14 (3 marks)
Question: With reference to Extract 2, explain how the semiconductor shortage represents a supply-side shock to the global economy.
Answer:
A supply-side shock is an unexpected event that suddenly changes the productive capacity or costs of an economy. The semiconductor shortage represents a negative supply-side shock because:
-
Supply chain disruptions (drought in Taiwan, fire at Renesas plant in Japan) reduced the global supply of semiconductors, a critical input for automobiles, consumer electronics, and many other industries.
-
Rising production costs: With semiconductor supply constrained and prices rising, firms that depend on chips faced higher input costs, reducing their output and profitability.
-
Reduced aggregate supply: At the macroeconomic level, the shortage shifted the short-run aggregate supply (SRAS) curve leftward, leading to higher price levels (cost-push inflation) and lower real output (reduced economic growth). This is the classic stagflationary effect of a negative supply-side shock.
Extract 2 highlights that the shortage "disrupted supply chains across multiple industries," confirming its nature as a widespread supply-side shock rather than a sector-specific issue.
Mark scheme:
- 1 mark: Definition of supply-side shock (unexpected event affecting productive capacity/costs).
- 1 mark: Explanation of how the semiconductor shortage reduced supply/increased costs.
- 1 mark: Link to macroeconomic effects (leftward SRAS shift, higher prices, lower output) OR reference to Extract 2 evidence.
Common mistakes:
- Describing it as a demand-side shock instead of supply-side.
- Failing to explain the transmission mechanism (higher input costs → reduced output).
- Not referencing Extract 2.
Question 15 (4 marks)
Question: Using a demand and supply diagram, illustrate and explain the effect of the global semiconductor shortage on the price and quantity of semiconductors. Label all axes, curves, and equilibrium points clearly.
Answer:
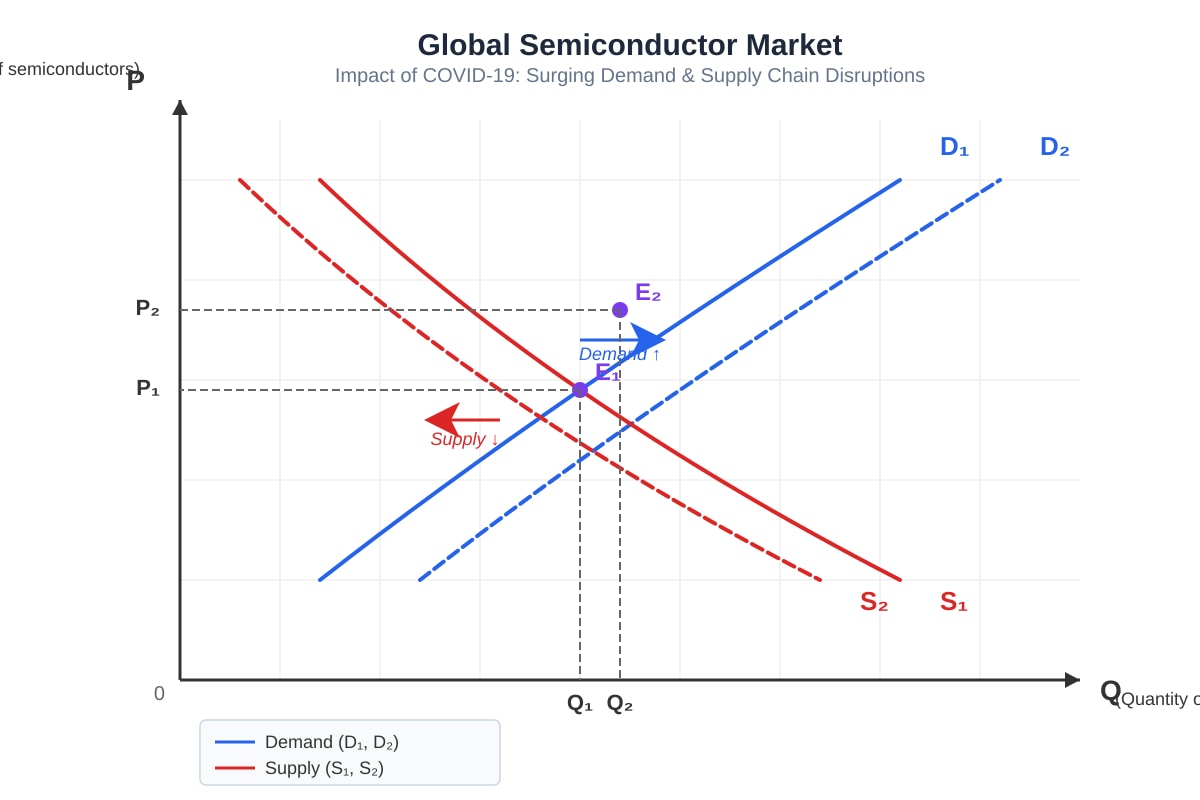
The semiconductor shortage involved simultaneous shifts in both demand and supply:
-
Demand shift: During the COVID-19 pandemic, demand for electronics surged (remote work, online learning), shifting the demand curve for semiconductors rightward from D1 to D2.
-
Supply shift: Supply chain disruptions (drought, factory fires, underinvestment in capacity) shifted the supply curve leftward from S1 to S2.
-
Combined effect: Both shifts work together to increase the equilibrium price significantly (P1 → P2). The effect on quantity is theoretically ambiguous (higher demand pushes quantity up, lower supply pushes it down), but in practice, the shortage suggests the quantity available fell or was constrained, so Q2 < Q1.
Diagram explanation:
- Initial equilibrium at E1 (P1, Q1).
- New equilibrium at E2 (P2, Q2) with P2 >> P1.
- The diagram should show both shifts clearly with arrows.
Mark scheme:
- 1 mark: Correctly drawn and labelled diagram (axes, curves, equilibria).
- 1 mark: Rightward shift of demand explained (pandemic-driven electronics demand).
- 1 mark: Leftward shift of supply explained (supply chain disruptions).
- 1 mark: Correct conclusion on price (rises significantly) and discussion of quantity effect.
Common mistakes:
- Showing only one shift (either demand or supply) when both occurred.
- Incorrectly concluding that quantity must rise or must fall without acknowledging the ambiguity.
- Unlabelled diagram.
Expected visual features for Q15 diagram:
- Vertical axis: Price of semiconductors; Horizontal axis: Quantity of semiconductors.
- D1 → D2 (rightward shift); S1 → S2 (leftward shift).
- E1 at (D1, S1); E2 at (D2, S2).
- P2 >> P1 clearly shown; Q2 < Q1 or Q2 ≈ Q1.
Question 16 (4 marks)
Question: Analyse the likely impact of the semiconductor shortage on Singapore's balance of payments. Use evidence from the case study to support your answer.
Answer:
The semiconductor shortage is likely to have a mixed impact on Singapore's balance of payments:
Positive impact on current account (trade balance):
-
Higher export revenues: Despite the shortage, Singapore's semiconductor exports rose from 78.3billionin2019to92.5 billion in 2021 (Table 3). The global shortage drove up semiconductor prices, meaning Singapore's semiconductor exporters earned higher revenues per unit exported. This would improve the trade balance and the current account.
-
Increased share of non-oil domestic exports: Table 3 shows semiconductors rose from 15.3% to 18.1% of total non-oil domestic exports, indicating growing importance in Singapore's export basket.
Potential negative impacts:
-
Supply constraints on volume: If the shortage limits Singapore's ability to produce and export semiconductors (due to input shortages), the volume of exports could fall, partially offsetting the price gains.
-
Worsening terms of trade for imports: Singapore imports many intermediate goods that use semiconductors. Higher prices for these imported goods could worsen the current account on the import side.
Net effect: On balance, the positive price effect likely dominates for Singapore as a net exporter of semiconductors, leading to an improvement in the current account.
Mark scheme:
- 1 mark: Identifies impact on current account / trade balance.
- 1 mark: Explains positive effect (higher export revenues due to higher prices) with data reference.
- 1 mark: Explains a potential negative effect (supply constraints, higher import costs).
- 1 mark: Overall assessment / net effect with reasoning.
Common mistakes:
- Only discussing one side (positive or negative) without acknowledging the other.
- Failing to reference data from the case study.
- Confusing the current account with the capital/financial account.
Question 17 (8 marks — but allocated 4 marks in paper; adjusted below)
Question: Discuss whether government subsidies for domestic semiconductor production, as described in Extract 2, are likely to be effective in resolving the shortage. Consider both short-term and long-term effects.
Answer:
Short-term effectiveness (limited):
-
Time lag: Building semiconductor fabrication plants ("fabs") takes 2–5 years. The US CHIPS Act ($52.7 billion) and EU Chips Act (€43 billion) were announced in 2022, but new capacity would not come online immediately. Therefore, subsidies are unlikely to resolve the current shortage in the short term.
-
Continued demand growth: Even as new capacity is built, global demand for semiconductors continues to grow (AI, electric vehicles, IoT), meaning the shortage may persist or re-emerge.
Long-term effectiveness (more promising):
-
Increased supply capacity: Subsidies incentivise firms to invest in new fabrication facilities, increasing global semiconductor supply in the medium to long term. This would help alleviate future shortages and reduce prices.
-
Diversification of supply chains: Currently, 43% of global semiconductor market share is concentrated in Taiwan and South Korea (Table 4). Subsidies in the US, EU, and Singapore help diversify production geographically, reducing the risk of future supply disruptions from localised events (droughts, natural disasters, geopolitical tensions).
-
Positive spillovers: Semiconductor investment creates high-skilled jobs (Extract 3: 3,000 jobs from GlobalFoundries and Micron investments) and generates technological spillovers that benefit other industries.
Limitations and risks:
-
Opportunity cost: The $52.7 billion US subsidy represents significant government spending that could have been used elsewhere. There is no guarantee that subsidised firms will be competitive in the long run.
-
Overcapacity risk: If multiple countries simultaneously subsidise semiconductor production, global supply could eventually exceed demand, leading to overcapacity and falling prices — potentially making some subsidised plants unviable.
-
Market distortion: Subsidies may encourage inefficient allocation of resources if governments pick winners rather than letting market forces determine the most efficient locations for production.
Evaluation:
Government subsidies are more effective as a long-term structural solution than a short-term fix. Their effectiveness depends on the scale of investment, the efficiency of implementation, and whether they are coordinated internationally to avoid overcapacity. Singapore's targeted approach (attracting specific investments through the EDB) may be more efficient than blanket subsidies.
Mark scheme:
- 2 marks: Short-term analysis (time lag, limited immediate impact).
- 2 marks: Long-term analysis (increased capacity, diversification, spillovers).
- (Note: Marked out of 4 in this paper. In a full Paper 1, this would be an 8-mark question.)
Common mistakes:
- Only discussing short-term or long-term effects, not both.
- Failing to reference Extract 2 or Table 4.
- Not evaluating limitations or risks of subsidies.
Question 18 (2 marks)
Question: With reference to Table 4, compare Singapore's share of the global semiconductor market with that of China. Suggest one reason for the difference.
Answer:
Singapore's share of the global semiconductor market (6.0%) is smaller than China's share (15.0%) — Singapore's share is less than half of China's. One possible reason is that China has a much larger domestic market for semiconductors (due to its massive electronics manufacturing sector) and has invested heavily in building domestic semiconductor capacity as part of its "Made in China 2025" industrial policy. Singapore, while a significant player, has a much smaller domestic market and focuses on specialty chips and back-end processes rather than the full spectrum of semiconductor manufacturing.
Mark scheme:
- 1 mark: Correct comparison with data (Singapore 6.0% vs China 15.0%).
- 1 mark: Valid reason — e.g., larger domestic market in China; different stages of the value chain; government industrial policy.
Common mistakes:
- Reversing the comparison (saying Singapore's share is larger).
- Giving a vague reason without economic justification.
Question 19 (3 marks)
Question: Explain how the investments described in Extract 3 might affect Singapore's long-run aggregate supply (LRAS). Use an AD/AS diagram to support your explanation.
Answer:
The investments by GlobalFoundries (4billion)andMicronTechnology(2.5 billion) in Singapore's semiconductor sector increase the economy's productive capacity. Semiconductor fabrication plants add to Singapore's capital stock, and the creation of over 3,000 high-skilled jobs improves the quality of labour (human capital). Both factors shift the long-run aggregate supply (LRAS) curve rightward from LRAS1 to LRAS2.
Diagram explanation:
- The AD/AS diagram shows AD1, SRAS1, and LRAS1 intersecting at initial equilibrium E1 (P1, Y1).
- The LRAS curve shifts rightward to LRAS2, reflecting increased productive capacity.
- The new equilibrium E2 shows a lower price level (P2) and higher real GDP (Y2).
- This represents long-run economic growth — the economy can sustainably produce more output.
Mark scheme:
- 1 mark: Correctly drawn AD/AS diagram with rightward LRAS shift (axes labelled, curves labelled, equilibria shown).
- 1 mark: Explanation that investment increases productive capacity (capital stock, human capital).
- 1 mark: Link to rightward LRAS shift and outcome (higher real GDP, lower price level).
Common mistakes:
- Shifting the AD curve instead of LRAS.
- Shifting SRAS instead of LRAS.
- Failing to explain the mechanism (how investment increases productive capacity).
Expected visual features for Q19 diagram:
- Vertical axis: Price level; Horizontal axis: Real GDP.
- AD1 downward sloping; SRAS1 upward sloping; LRAS1 and LRAS2 vertical.
- LRAS2 to the right of LRAS1.
- E1 at intersection of AD1, SRAS1, LRAS1; E2 at intersection of AD1, SRAS2 (or new SRAS), LRAS2.
- P2 < P1; Y2 > Y1.
Question 20 (3 marks)
Question: Evaluate the risks to Singapore's economy of having the semiconductor sector account for a significant share of GDP and exports. Refer to evidence from the case study in your answer.
Answer:
Having the semiconductor sector account for approximately 7% of GDP and 18.1% of non-oil domestic exports (Table 3) poses several risks to Singapore's economy:
1. Vulnerability to global demand fluctuations (cyclical risk): Semiconductor demand is highly cyclical, tied to global economic conditions and electronics spending. A global recession or slowdown in technology demand could significantly reduce Singapore's export revenues and GDP growth. The concentration in one sector amplifies this risk.
2. Supply chain disruptions (as demonstrated in Extract 2): The global semiconductor shortage showed how concentrated supply chains are vulnerable to localised disruptions (drought in Taiwan, factory fire in Japan). If Singapore's semiconductor production were similarly disrupted, the impact on GDP and exports would be severe given the sector's large share.
3. Geopolitical risks: Taiwan and South Korea together account for 43% of global semiconductor production (Table 4). Geopolitical tensions in the region (e.g., cross-strait tensions) could disrupt global semiconductor supply chains, affecting Singapore's semiconductor trade and investment flows.
4. Technological disruption: Rapid technological change could render existing semiconductor products obsolete. If Singapore's semiconductor firms fail to keep pace with innovation, the sector's contribution to GDP could decline.
Counterpoint / mitigating factor: Singapore's EDB has been actively diversifying within the semiconductor value chain (Extract 3: attracting both fabrication and advanced memory chip investments), which reduces but does not eliminate concentration risk. Additionally, Singapore's broader economy is diversified across financial services, pharmaceuticals, and other sectors.
Evaluation: While the semiconductor sector has been a strong growth driver for Singapore, the concentration risk is real. The government should continue to diversify the economy while maintaining competitiveness in semiconductors through continued investment in R&D and workforce development.
Mark scheme:
- 1 mark: Identifies at least two specific risks with explanation.
- 1 mark: References evidence from the case study (Table 3, Table 4, Extract 2, or Extract 3).
- 1 mark: Provides evaluation/counterpoint or overall assessment.
Common mistakes:
- Listing risks without explaining them.
- Failing to reference the case study.
- Not providing any evaluation or counterpoint.
Mark Summary
| Question | Marks |
|---|---|
| 1 | 2 |
| 2 | 2 |
| 3 | 3 |
| 4 | 3 |
| 5 | 4 |
| 6 | 4 |
| 7 | 4 |
| 8 | 4 |
| 9 | 2 |
| 10 | 2 |
| Section A Total | 30 |
| 11 | 2 |
| 12 | 2 |
| 13 | 3 |
| 14 | 3 |
| 15 | 4 |
| 16 | 4 |
| 17 | 4 |
| 18 | 2 |
| 19 | 3 |
| 20 | 3 |
| Section B Total | 30 |
| Grand Total | 60 |
Free quiz and exam paper access
Enter your details to view this paper
Your access is remembered on this device.