From Real Exams Exam Paper
A Level H1 Economics Practice Paper 4
Free A Level H1 Econs Practice Paper 4, HY3 Exam version, with questions, answers, and A Level-style practice for Singapore students.
These static practice materials are generated from the site's syllabus and paper-generation workflow, with source and model context shown so students and parents can evaluate the material before use.
Questions
Free quiz and exam paper access
Enter your details to view this paper
Your access is remembered on this device.
Answers
Answer Key: TuitionGoWhere Practice Paper - Economics H1 A-Level (Version 4)
Section A: Data Interpretation (10 marks)
Q1 [2 marks]
- Both primary and university education spending per student increased from 2020 to 2024. [1]
- University spending was consistently higher and grew from 25,600 (+11,200 to 1,700); university rose by a larger absolute amount. [1]
- Teaching note: Compare both sectors with values and direction. Common mistake: stating only one sector.
Q2 [2 marks]
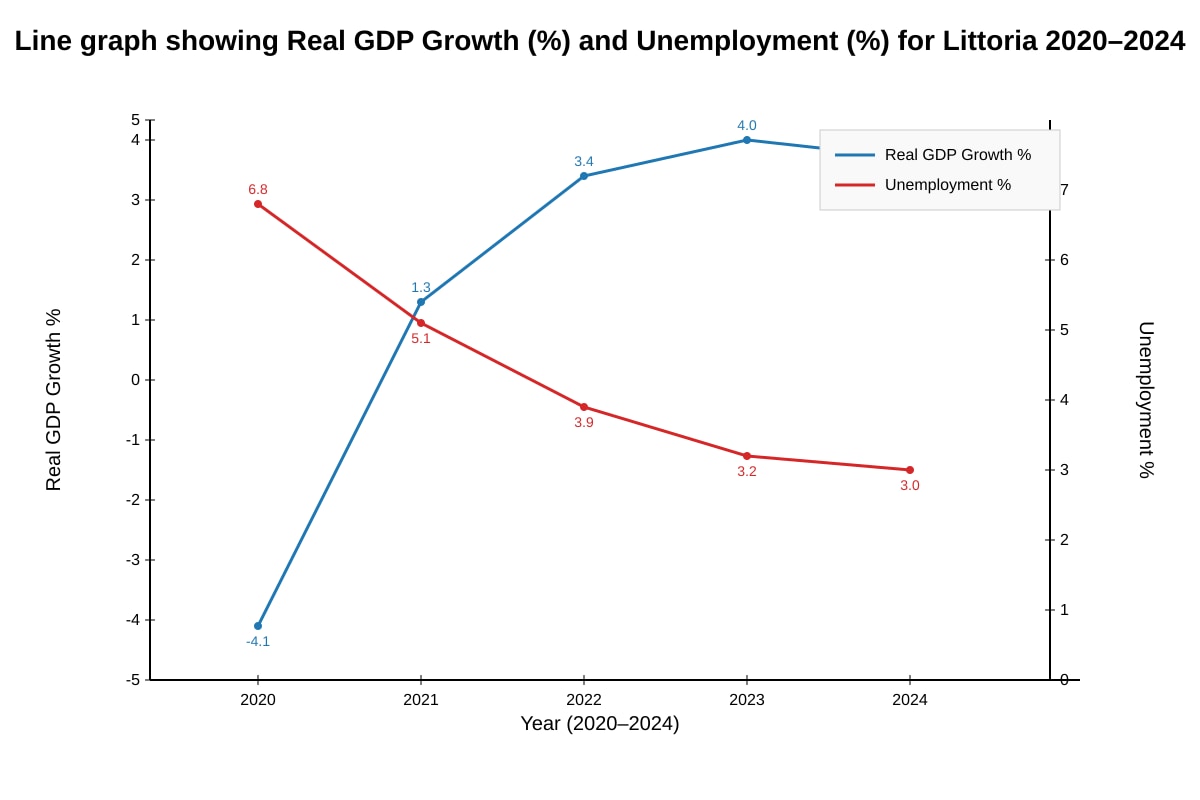
- Unemployment fell from 6.8% (2020) to 3.0% (2024). [1]
- The decline was steady and accelerating after 2021, reaching 3.0% by 2024. [1]
- Teaching note: Direction + rate. Trap: only say "fell" without values.
Q3 [2 marks]
- In 2021, mass package (600m) by $200m. [1]
- By 2024, eco/remote (2400m) by $1000m; composition reversed. [1]
Q4 [2 marks]
- Global travel restrictions in 2020 changed consumer preferences and firm offerings; by 2023 eco-tourism and remote-work visitors rose because firms adapted via digital grants and visitors sought less crowded options. [2] (Any one valid reason from Extract 1)
- Teaching: Link extract evidence to composition shift.
Q5 [2 marks]
- Fig 1 shows an inverse relationship: as Real GDP growth rose (from -4.1% to 4.0%), unemployment fell (6.8% to 3.2%). [1]
- The two lines move in opposite directions across all years. [1]
Section B: Microeconomic Analysis (20 marks)
Q6 [4 marks]
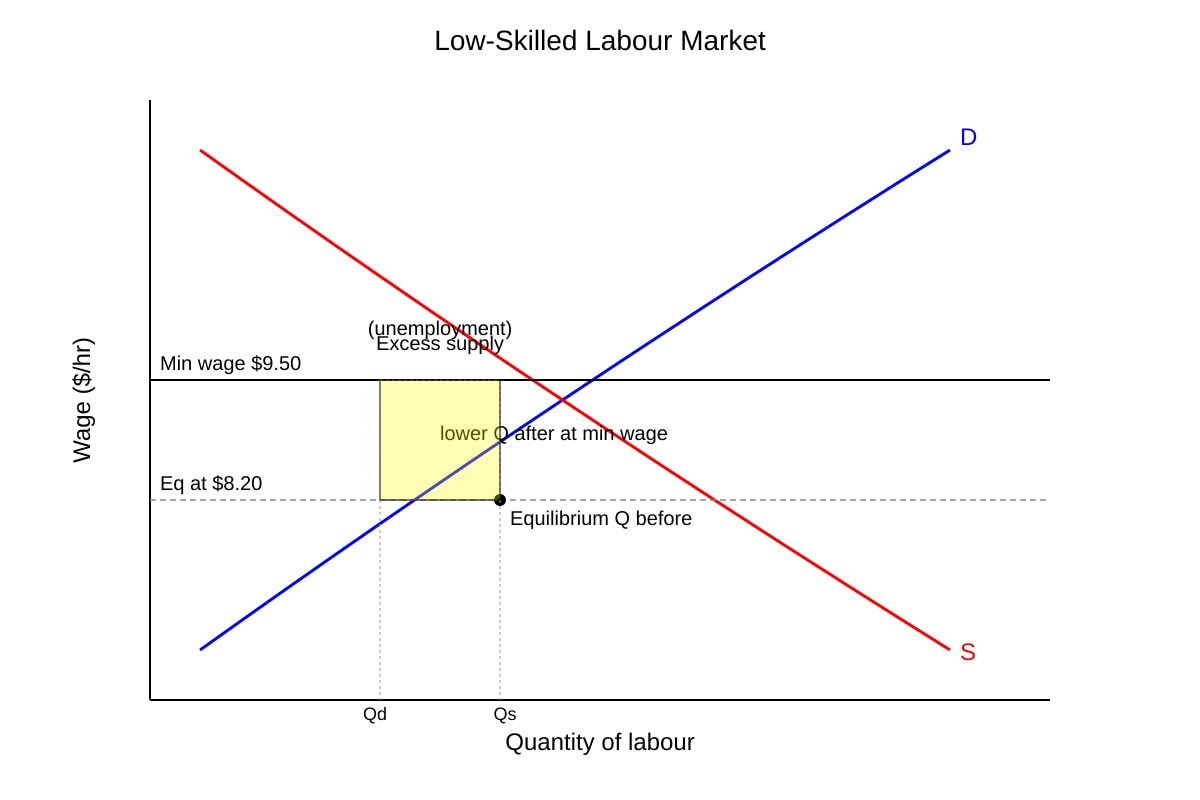
- Diagram: labour demand D, supply S, eq wage 9.50 above eq creates excess supply. [2]
- Explanation: At higher wage, quantity supplied of youth labour rises, quantity demanded falls → unemployment among youth. [2]
- Teaching: Use extract: food services reduced hiring youth. Minimum wage > market clearing causes surplus.
Q7 [2 marks]
- PES likely low (<1) in short run because training places require time to set up (trainers, facilities). [2]
- Teaching: PES = responsiveness of Qs to price; time constraint reduces elasticity.
Q8 [3 marks]
- Wage subsidy lowers effective labour cost to firms, so they retain workers instead of laying off. [1]
- This maintains income and consumption, reducing cyclical unemployment from tourism shock. [1]
- Extract 1: hospitality firms received subsidy, aiding recovery. [1]
Q9 [3 marks]
- Total 2020 = 4200 + 900 = 5100. Total 2024 = 2400 + 3400 = 5800. [1]
- % change = (5800 - 5100)/5100 × 100 = 13.73%. [2]
- Working: 700/5100 = 0.1373 → 13.7% (allow 13.7–13.8)
Q10 [2 marks]
- Possible failure: information failure / under-provision of training (youth lack skills). Subsidy corrects by raising supply of trained workers. [2]
Q11 [4 marks]
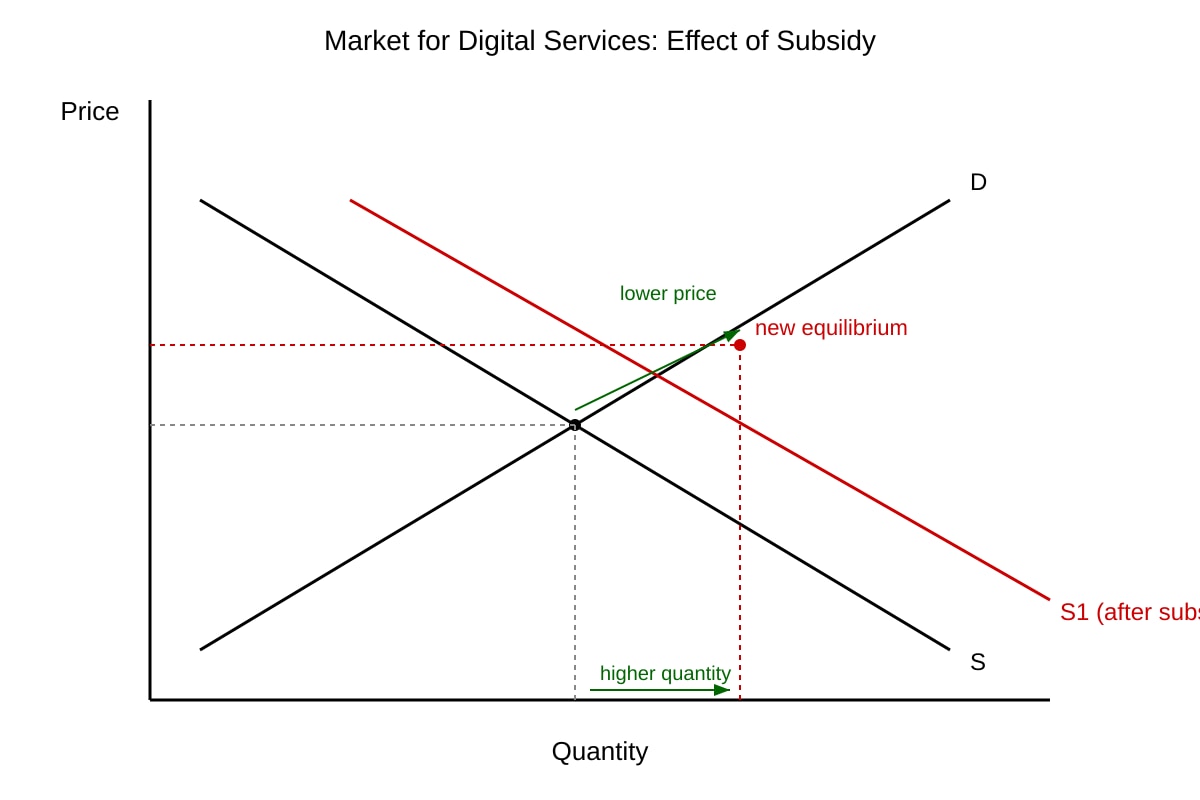
- Diagram: S shifts right to S1 due to subsidy (lowers cost). [2]
- Price falls, quantity of digital services rises. [2]
- Teaching: subsidy is supply-side, not demand.
Q12 [2 marks]
- Equity improved for low-skilled workers earning 8.20 (fairer wage). [1]
- But equity worsened for excluded youth unemployed. [1]
- Teaching: trade-off required by syllabus.
Section C: Macroeconomic & Evaluative (30 marks)
Q13 [2 marks]
- GDP growth: -4.1% (2020) to 4.0% (2023) – recovered. [1]
- Unemployment: 6.8% to 3.2% – fell. [1]
Q14 [3 marks]
- Tourism is export-equivalent; arrival fall cuts consumption & I in hospitality. [1]
- X falls → AD shifts left → real GDP contraction (Table 1: -4.1%). [2]
Q15 [4 marks]
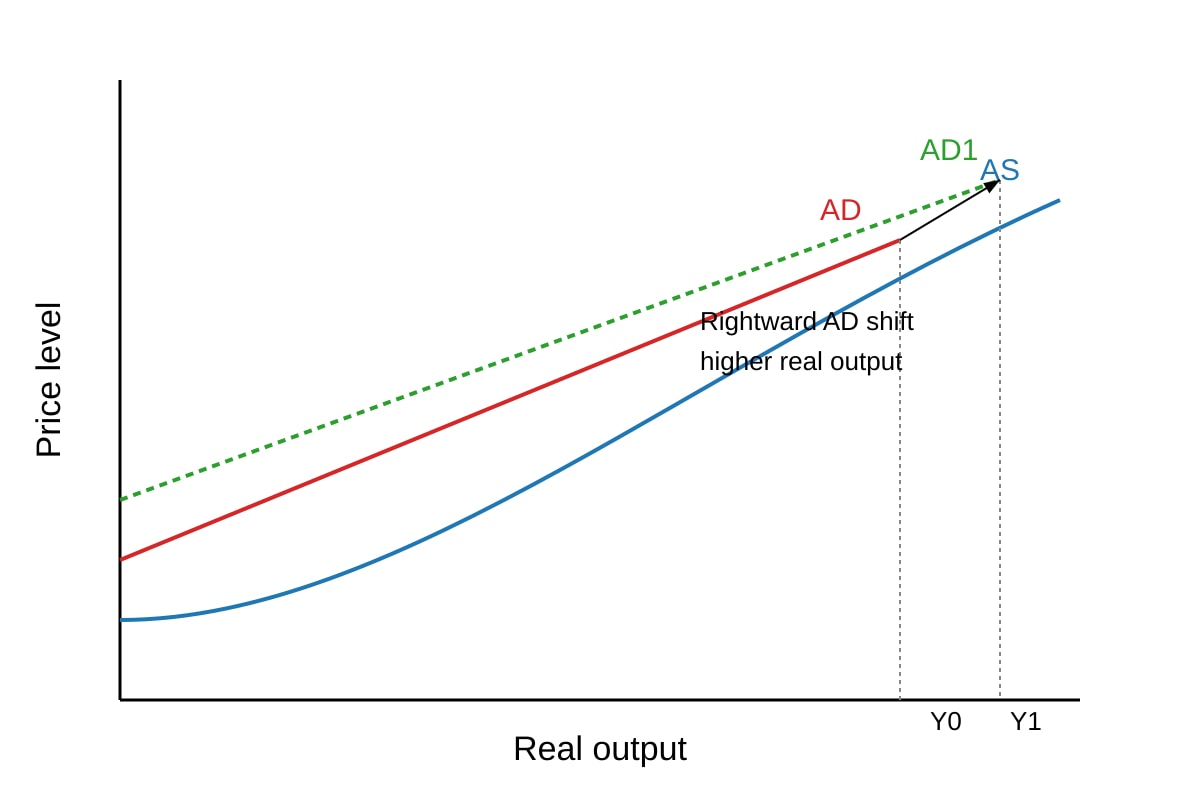
- AD/AS diagram: AD shifts right to AD1. [2]
- Wage subsidy raises disposable income → C rises; digital grants raise I → AD↑, real output↑. [2]
Q16 [8 marks]
- Mark descriptors:
- Use of data: rising education spend, falling unemployment, GDP recovery (2)
- Material living standard: higher GDP, lower unemployment (2)
- Non-material: tourism mix, skills (2)
- Evaluation: ignores inequality, environmental cost of eco-tourism (2)
- Teaching: Must use Table 1 + Extracts, show trade-offs.
Q17 [2 marks]
- Opportunity cost = other goods/services forgone (e.g. primary education or healthcare) when more spent on university. [2]
Q18 [3 marks]
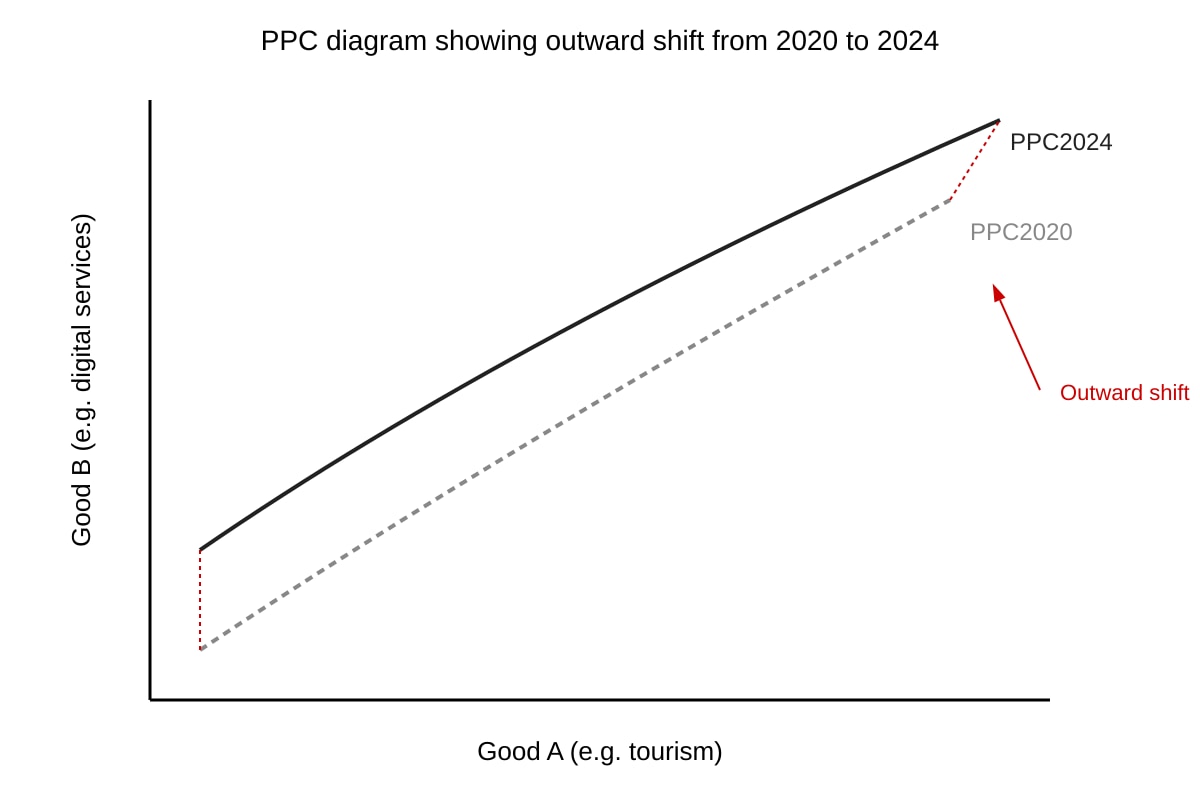
- PPC2020 inside due to unemployment; by 2024 outward shift from tourism recovery + digital adoption raising capacity. [3]
- Diagram must show outward shift.
Q19 [3 marks]
- Unintended: youth unemployment rose (Extract 2). [1]
- Firms substituted to machines/apprentices. [1]
- Net equity effect ambiguous. [1]
Q20 [5 marks]
- Effective: wage subsidy + digital grants aided fast recovery (GDP 4.0%, unemp 3.2%). [2]
- Partial: min wage hurt youth. [1]
- Use evidence from all tables/extracts. [2]
- Teaching: evaluation needs trade-off and data reference.