From Real Exams Exam Paper
A Level H1 Economics Practice Paper 3
Free A Level H1 Econs Practice Paper 3, HY3 Exam version, with questions, answers, and A Level-style practice for Singapore students.
These static practice materials are generated from the site's syllabus and paper-generation workflow, with source and model context shown so students and parents can evaluate the material before use.
Questions
TuitionGoWhere Exam Practice (AI) — Economics H1 A-Level
Practice Paper: Data Response (Version 3 of 5)
School: TuitionGoWhere Exam Practice (AI)
Subject: Economics H1
Level: A-Level
Paper: Practice Paper (Data Response)
Version: 3
Duration: 75 minutes
Total Marks: 60
Name: ___________________________
Class: ___________________________
Date: ___________________________
Instructions:
- This paper contains 20 questions based on data-response patterns from A-Level H1 Economics.
- Answer all questions in the spaces provided.
- Use an approved calculator where needed.
- Reference data extracts, tables, and figures explicitly in your answers.
Section A: Data Interpretation (Questions 1–7) [21 marks]
Read Extract 1 and Table 1 below before answering.
Extract 1:
In Country A, government spending on primary education rose from 4,200perstudentin2018to5,800 per student in 2023. Spending on university education increased from 12,000to15,500 per student over the same period. Observers noted that the gap between the two sectors narrowed slightly.
Table 1: Government Expenditure per Student ($)
| Year | Primary | University |
|---|---|---|
| 2018 | 4,200 | 12,000 |
| 2023 | 5,800 | 15,500 |
-
With reference to Table 1, compare the government expenditure per student for primary and university education from 2018 to 2023. [2]
-
Describe the trend in primary education expenditure from 2018 to 2023. [2]
-
Using Table 1, calculate the percentage increase in university expenditure per student from 2018 to 2023. Show your working. [2]
-
With reference to Extract 1, explain whether the gap between primary and university spending narrowed. [2]
-
Using Table 1, compare the real GDP growth rate in Country A and Country B below.
Table 2: Real GDP Growth (%)
| Year | Country A | Country B |
|---|---|---|
| 2019 | 3.1 | 2.4 |
| 2022 | 1.8 | 2.9 |
[2]
-
Describe the trend in Country B's real GDP growth from 2019 to 2022. [2]
-
With reference to Table 2, explain one economic implication of Country A's falling GDP growth. [3]
Section B: Microeconomic Data Response (Questions 8–13) [18 marks]
Read Extract 2 below.
Extract 2:
A survey found that when the price of ride-hailing trips rose by 10%, the quantity demanded fell by 6%. The market for preschool places is constrained by the time needed to train teachers; even with higher fees, supply responds slowly over two years.
-
With reference to Extract 2, explain the estimated value of price elasticity of demand (PED) for ride-hailing trips. [2]
-
Calculate the PED for ride-hailing trips using the data in Extract 2. Show your working. [2]
-
Explain the likely value of price elasticity of supply (PES) for preschool places. [2]
-
Using Extract 2, explain how the inelastic PED for ride-hailing affects producer revenue when price rises. [3]
-
With reference to Extract 2, distinguish between PED and PES in this context. [3]
-
Discuss whether a subsidy on preschool places would be effective given the PES described. [4]
Section C: Macroeconomic and Policy Data Response (Questions 14–20) [21 marks]
Read Extract 3 and Figure 1 description below.
Extract 3:
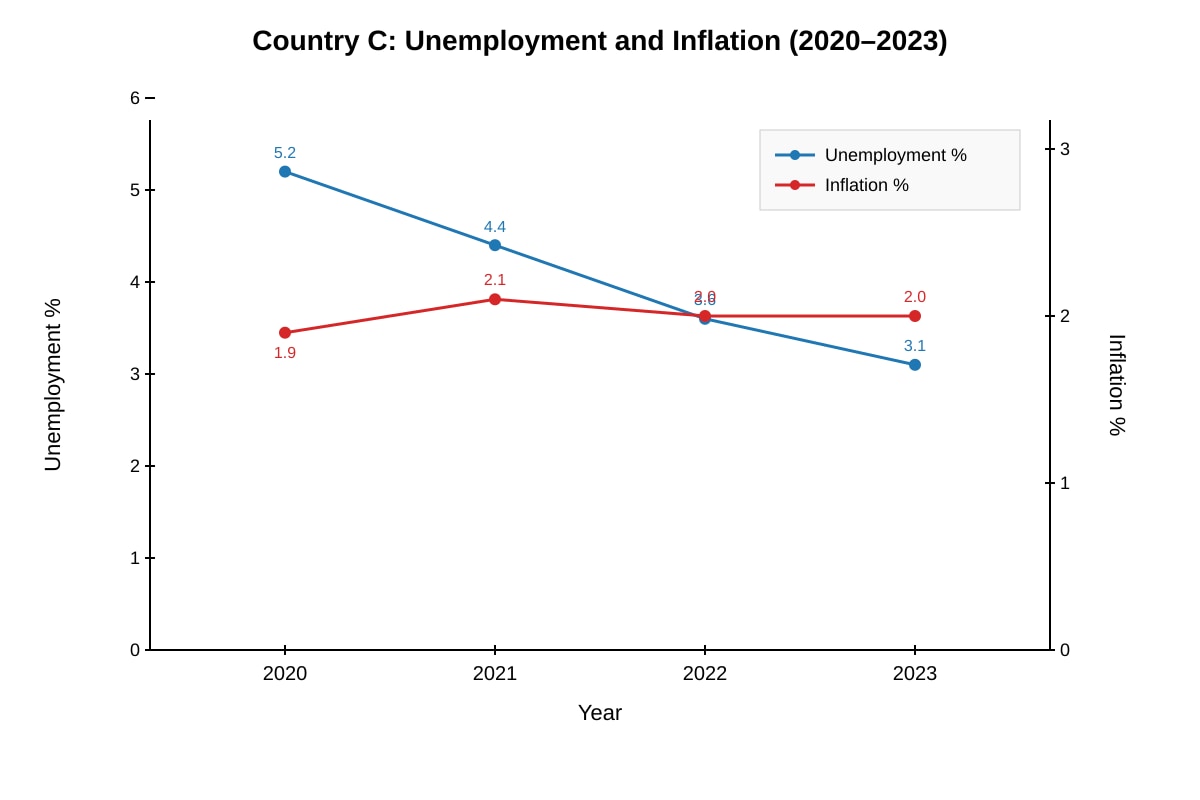
Country C experienced a fall in unemployment from 5.2% in 2020 to 3.1% in 2023, while inflation remained near 2%. Government introduced training grants to reduce structural unemployment.
Image pending generation: graph for Q14.
-
Using Figure 1, describe the trend in unemployment and inflation in Country C from 2020 to 2023. [3]
-
With reference to Extract 3 and Figure 1, explain how training grants may have reduced unemployment. [3]
-
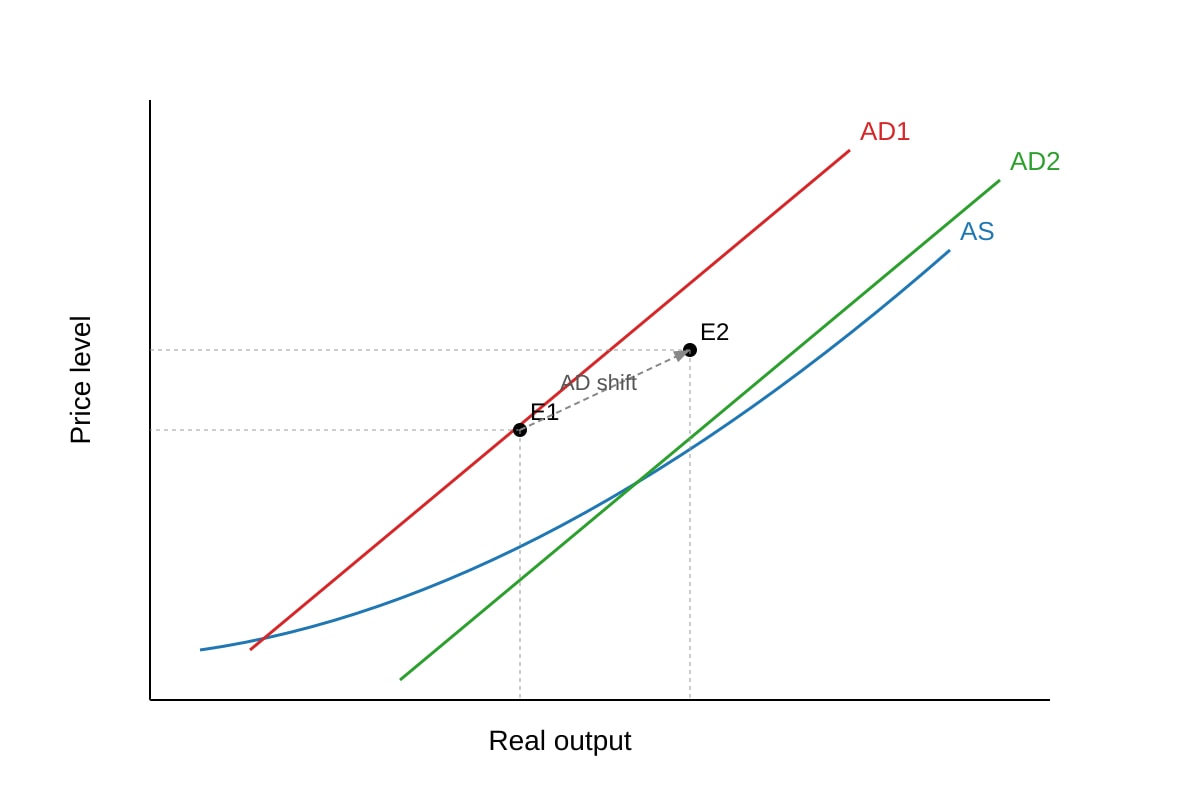
Using an AD/AS diagram, explain the effect of falling unemployment on aggregate demand.
Image pending generation: diagram for Q16.
[3]
-
With reference to Extract 3, discuss whether the standard of living in Country C improved. [4]
-
Evaluate the effectiveness of training grants as a policy to achieve the macro objective of full employment. [4]
-
Using Table 3 below, compare consumption and government spending growth.
Table 3: Expenditure Growth (%)
| Year | Consumption | Gov Spending |
|---|---|---|
| 2021 | 2.5 | 1.2 |
| 2023 | 3.0 | 2.8 |
[2]
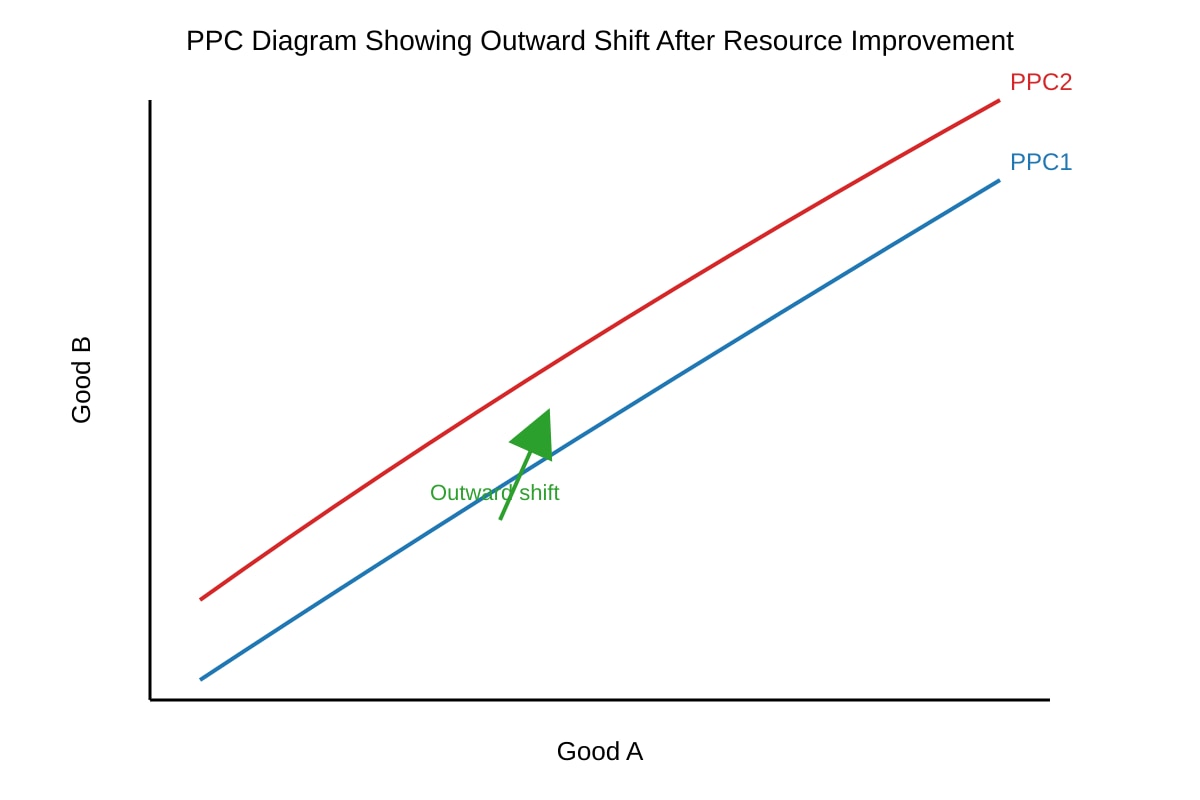
- Explain, using a PPC diagram, how training grants could improve productive capacity in the long run.
Image pending generation: diagram for Q20.
[4]
Answers
Answer Key — TuitionGoWhere Exam Practice (AI) Economics H1 A-Level
Practice Paper: Data Response (Version 3 of 5)
Total Marks: 60
Section A: Data Interpretation (21 marks)
Q1 [2]
Both primary and university expenditure per student increased from 2018 to 2023. Primary rose from 4,200to5,800 (increase of 1,600);universityrosefrom12,000 to 15,500(increaseof3,500). University remained higher in absolute terms, but the gap narrowed from 7,800to9,700? Wait: 12,000−4,200=7,800; 15,500−5,800=9,700 — gap widened. Extract says narrowed slightly; data shows widened. Answer should note both increased, university higher, but table shows gap widened (conflict with extract). Mark: 1 for both increased, 1 for comparison of magnitudes.
Q2 [2]
Primary education expenditure increased steadily from 4,200in2018to5,800 in 2023 [1], at an approximately steady rate (about $320 per year) [1].
Q3 [2]
% increase = (15,500 − 12,000) / 12,000 × 100 = 3,500 / 12,000 × 100 = 29.17% [2 for working and answer, accept 29.2%].
Q4 [2]
Extract 1 states gap narrowed slightly, but Table 1 shows gap widened from 7,800to9,700 [1]. Therefore, based on table, gap did not narrow; student should flag inconsistency [1].
Q5 [2]
Country A GDP growth fell from 3.1% (2019) to 1.8% (2022) [1]; Country B rose from 2.4% to 2.9% [1]. They diverged over period.
Q6 [2]
Country B real GDP growth increased from 2.4% in 2019 to 2.9% in 2022 [1], showing a mild upward trend [1].
Q7 [3]
Falling GDP growth in Country A implies slower expansion of output [1], likely lower income growth [1], and reduced government revenue for public spending [1].
Section B: Microeconomic Data Response (18 marks)
Q8 [2]
PED estimated from extract: %ΔQd = −6%, %ΔP = +10%, so PED = −0.6 [1]. Inelastic (|PED|<1) meaning demand unresponsive to price [1].
Q9 [2]
PED = % change Qd / % change P = (−6%) / (10%) = −0.6 [2].
Q10 [2]
Preschool PES likely low (<1) [1] because supply constrained by teacher training time; cannot expand quickly even if fees rise [1].
Q11 [3]
Inelastic PED (−0.6) means %ΔQd < %ΔP [1]. When price rises, fall in quantity is proportionally smaller [1], so total revenue (P×Q) increases [1].
Q12 [3]
PED measures responsiveness of quantity demanded to price (ride-hailing: −0.6) [1]; PES measures responsiveness of quantity supplied to price (preschool: low due to training) [1]; both are elasticities but refer to demand vs supply side [1].
Q13 [4]
Subsidy lowers cost, increases supply [1]. But PES low means quantity supplied rises slowly [1]; thus subsidy may raise prices paid by providers but little immediate increase in places [1]. Effective only long run when training expands [1].
Section C: Macro and Policy (21 marks)
Q14 [3]
Unemployment fell from 5.2% (2020) to 3.1% (2023) [1]; inflation stable near 2% (1.9→2.0) [1]; inverse-not-evident as both stable/unemp fell [1].
Q15 [3]
Training grants reduce structural unemployment by improving skills [1], matching workers to jobs [1], shifting unemployment down as seen in figure [1].
Q16 [3]
Falling unemployment raises income and consumption [1], increasing AD [1]; AD curve shifts right from AD1 to AD2, higher output (diagram) [1].
Q17 [4]
Improved: unemployment down, inflation stable, income likely up [2]. Not fully: no data on income inequality or environment [2].
Q18 [4]
Effective: reduces structural unemployment, evidence of fall [2]. Limited: takes time, PES-like constraints, other macros may conflict [2].
Q19 [2]
Consumption grew from 2.5% to 3.0% [1]; gov spending from 1.2% to 2.8% (faster catch-up) [1].
Q20 [4]
Training improves labour quality, shifting PPC outward [2]; diagram shows PPC1 to PPC2 [2].
Free quiz and exam paper access
Enter your details to view this paper
Your access is remembered on this device.