From Real Exams Exam Paper
A Level H1 Economics Practice Paper 2
Free A Level H1 Econs Practice Paper 2, LongCat Exam version, with questions, answers, and A Level-style practice for Singapore students.
These static practice materials are generated from the site's syllabus and paper-generation workflow, with source and model context shown so students and parents can evaluate the material before use.
Questions
A-Level Economics H1 Quiz - Data Response
Name: ________________________
Class: ________________________
Date: ________________________
Score: ______ / 80
Duration: 90 minutes
Total Marks: 80
Instructions
- Answer all questions in the spaces provided.
- Read each data source carefully before attempting the question.
- Use economic terminology precisely.
- Show all working for calculation questions.
- For evaluation questions, consider multiple perspectives before reaching a conclusion.
- Where diagrams are required, draw clearly and label all axes, curves, and equilibrium points.
Section A: Data Interpretation (Questions 1–8)
Refer to the following data source for Questions 1–4.
Source A: Singapore Government Expenditure on Education, 2015–2022
| Year | Primary Education ($ million) | Secondary Education ($ million) | Tertiary Education ($ million) | Total Education Spending ($ million) |
|---|---|---|---|---|
| 2015 | 1,820 | 2,150 | 3,400 | 7,370 |
| 2016 | 1,890 | 2,210 | 3,520 | 7,620 |
| 2017 | 1,950 | 2,340 | 3,680 | 7,970 |
| 2018 | 2,010 | 2,410 | 3,790 | 8,210 |
| 2019 | 2,080 | 2,480 | 3,950 | 8,510 |
| 2020 | 2,350 | 2,720 | 4,100 | 9,170 |
| 2021 | 2,410 | 2,800 | 4,250 | 9,460 |
| 2022 | 2,480 | 2,890 | 4,380 | 9,750 |
Source: Ministry of Education, Singapore, Annual Report 2023
Source B: Extract from Ministry of Education Press Release, 2022
"The increase in education spending reflects the Government's commitment to equipping Singaporeans with skills for the future economy. The significant jump in 2020 was partly due to additional funding for digital learning infrastructure during the COVID-19 pandemic. Tertiary education continues to receive the largest share, reflecting investments in universities and polytechnics to support Singapore's transition to an innovation-driven economy. However, the Government has also increased per-student spending at the primary and secondary levels, recognising the importance of foundational education in building resilience and adaptability."
Question 1
With reference to Source A, compare the government expenditure on primary education and tertiary education from 2015 to 2022.
(2 marks)
Question 2
Calculate the percentage change in total education spending from 2015 to 2022. Show your working.
(2 marks)
Question 3
With reference to Source A, describe the trend in secondary education spending from 2015 to 2022.
(2 marks)
Question 4
Using Source A and Source B, explain one possible reason for the significant increase in education spending in 2020.
(3 marks)
Refer to the following data source for Questions 5–8.
Source C: Unemployment Rate and GDP Growth Rate, Singapore, 2018–2023
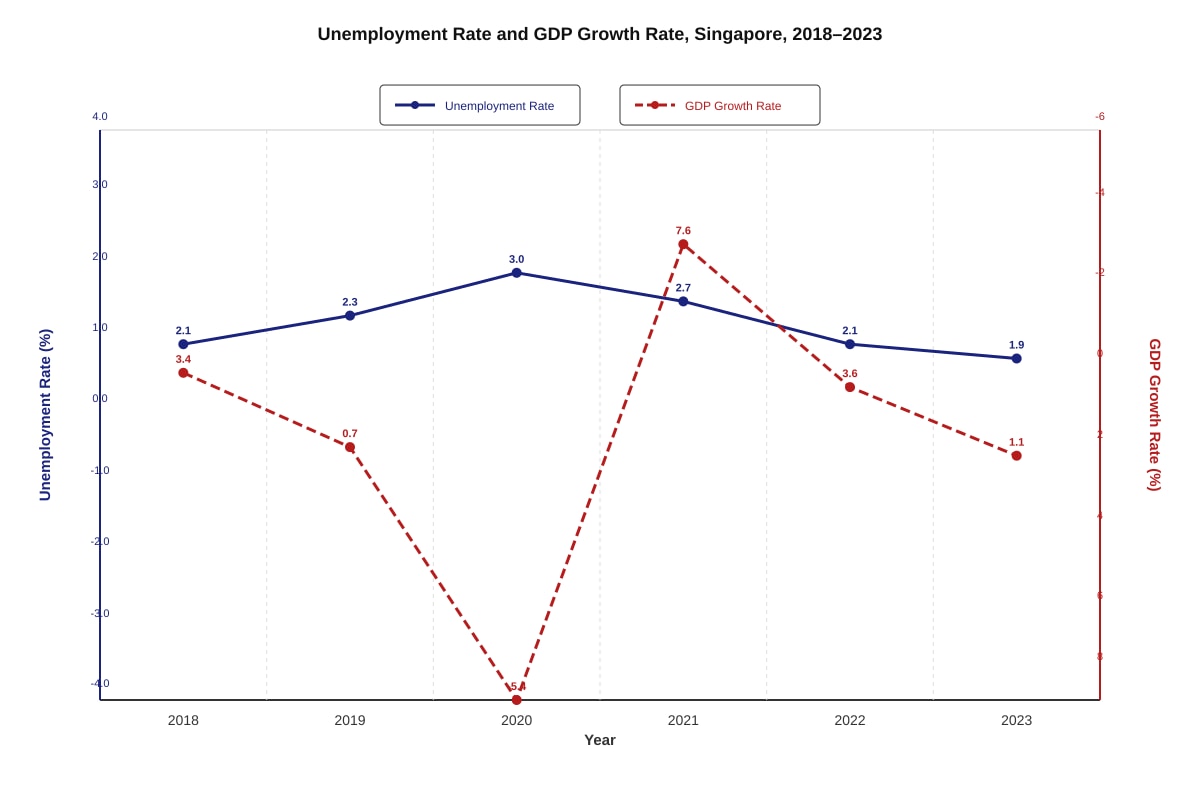
Generated graph for Q5.
Source D: Extract from Economic Survey of Singapore, 2023
"The COVID-19 pandemic caused Singapore's economy to contract by 5.4% in 2020, the worst recession since independence. The unemployment rate rose to 3.0%, with the accommodation, food services, and retail sectors most severely affected. Government intervention through the Jobs Support Scheme (JSS), which subsidised up to 75% of the first $4,600 of monthly wages, helped to cushion the rise in unemployment. By 2022, the economy had recovered, with GDP growth of 3.6% and unemployment falling to pre-pandemic levels."
Question 5
With reference to Source C, compare the unemployment rate in 2019 and 2021.
(2 marks)
Question 6
Using Source C, describe the relationship between GDP growth rate and unemployment rate from 2018 to 2023.
(3 marks)
Question 7
Using Sources C and D, explain how the Jobs Support Scheme (JSS) might have helped to reduce unemployment during the pandemic.
(4 marks)
Question 8
Based on the data in Source C, identify the year in which the GDP growth rate was negative and state the corresponding unemployment rate.
(2 marks)
Section B: Application and Analysis (Questions 9–14)
Refer to the following data source for Questions 9–11.
Source E: Market for Electric Vehicles (EVs) in Singapore
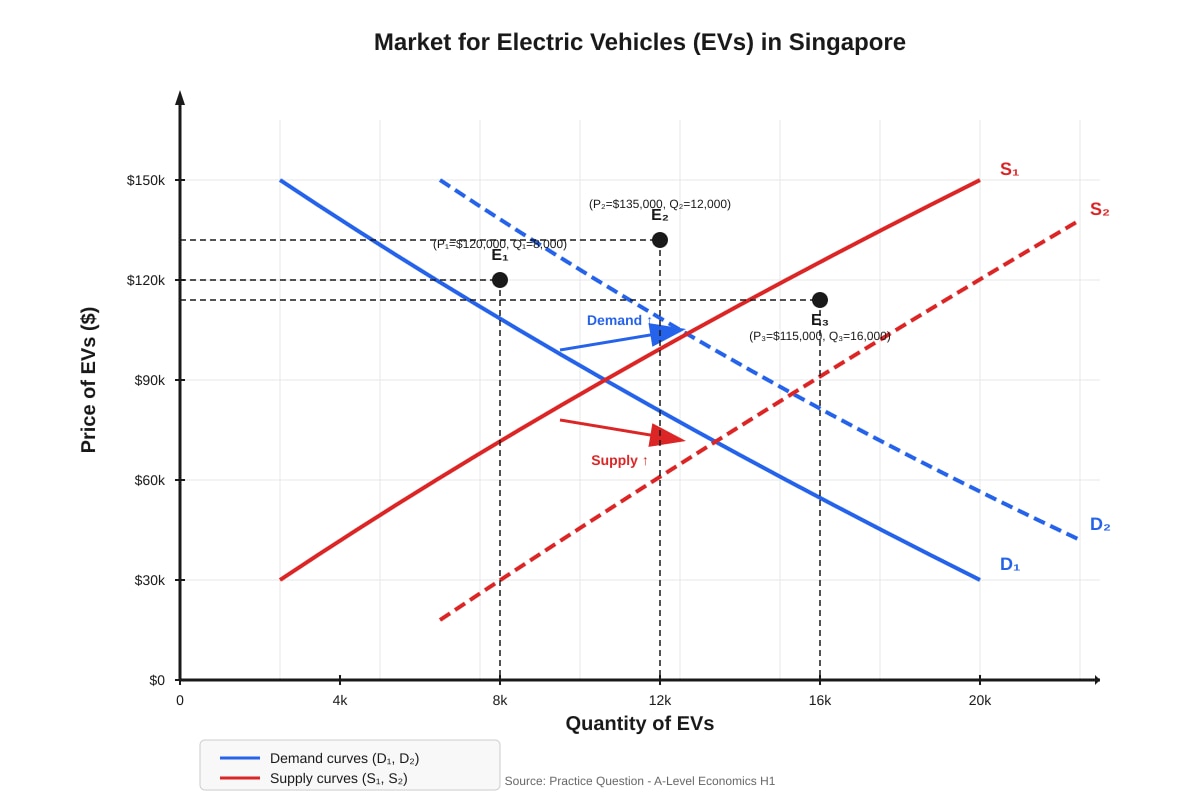
Generated diagram for Q9.
Source F: Extract from Singapore Budget 2023 – EV Initiatives
"The Government has set a target of 60,000 EV charging points by 2030 and will provide incentives to encourage EV adoption. These include the EV Early Adoption Incentive (EEAI), which provides a rebate of up to $25,000 off the Additional Registration Fee for fully electric cars, and the expansion of the public charging network. The Government aims to phase out all internal combustion engine vehicles by 2040. However, challenges remain, including the high upfront cost of EVs compared to conventional vehicles and range anxiety among consumers."
Question 9
With reference to Source E, state the initial equilibrium price and quantity of EVs.
(1 mark)
Question 10
Using Source E, explain two possible reasons for the shift in the demand curve from D1 to D2.
(4 marks)
Question 11
Using Source E and Source F, explain how the government subsidy affects the market for EVs.
(4 marks)
Refer to the following data source for Questions 12–14.
Source G: Price Elasticity of Demand for Selected Goods in Singapore
| Good | Price Elasticity of Demand (PED) |
|---|---|
| Petrol (short-run) | -0.2 |
| Petrol (long-run) | -0.7 |
| Rice | -0.3 |
| Restaurant meals | -1.8 |
| Public transport | -0.5 |
| Luxury watches | -2.5 |
| Cigarettes | -0.4 |
| Electricity | -0.3 |
Source: Department of Statistics, Singapore
Source H: Extract from a News Article, 2023
"The Government announced a 10% increase in petrol duties to encourage the use of public transport and reduce carbon emissions. Economists have noted that petrol demand is price inelastic in the short run, meaning that the duty increase will raise government revenue but may not significantly reduce petrol consumption immediately. However, over time, consumers may switch to public transport or EVs, making demand more elastic in the long run."
Question 12
With reference to Source G, identify which good has the most price elastic demand and which has the most price inelastic demand.
(2 marks)
Question 13
Using Source G and Source H, explain why the 10% increase in petrol duties is likely to raise government revenue.
(3 marks)
Question 14
Using the concept of price elasticity of demand, explain why the demand for petrol is more elastic in the long run than in the short run.
(4 marks)
Section C: Evaluation and Synthesis (Questions 15–20)
Refer to the following data source for Questions 15–17.
Source I: Singapore's Trade Data, 2018–2022
| Year | Total Exports ($ billion) | Total Imports ($ billion) | Trade Balance ($ billion) | Current Account Balance (% of GDP) |
|---|---|---|---|---|
| 2018 | 512.3 | 468.7 | +43.6 | 16.2 |
| 2019 | 498.1 | 455.2 | +42.9 | 15.8 |
| 2020 | 472.5 | 418.3 | +54.2 | 17.1 |
| 2021 | 536.8 | 489.6 | +47.2 | 16.9 |
| 2022 | 562.4 | 521.8 | +40.6 | 15.5 |
Source: Department of Statistics, Singapore
Source J: Extract from Monetary Authority of Singapore (MAS) Annual Report 2022
"Singapore's trade-dependent economy continued to perform strongly in 2022, with total trade exceeding $1 trillion. The current account surplus remained healthy at 15.5% of GDP, reflecting Singapore's role as a global trading hub. However, the narrowing trade surplus from 2020 to 2022 reflects rising import costs, particularly for energy and food, driven by global supply chain disruptions and geopolitical tensions. The MAS has maintained a tight monetary policy to manage imported inflation, allowing the Singapore dollar to appreciate gradually against a basket of currencies."
Question 15
With reference to Source I, describe the trend in Singapore's trade balance from 2018 to 2022.
(2 marks)
Question 16
Using Sources I and J, explain two factors that could have contributed to the narrowing trade surplus from 2020 to 2022.
(4 marks)
Question 17
Evaluate the effectiveness of a tight monetary policy (allowing the Singapore dollar to appreciate) in managing imported inflation in Singapore.
(8 marks)
Refer to the following data source for Questions 18–20.
Source K: Income Inequality Data, Singapore, 2018–2022
| Year | Gini Coefficient (before taxes and transfers) | Gini Coefficient (after taxes and transfers) |
|---|---|---|
| 2018 | 0.458 | 0.398 |
| 2019 | 0.454 | 0.395 |
| 2020 | 0.452 | 0.375 |
| 2021 | 0.449 | 0.386 |
| 2022 | 0.456 | 0.391 |
Source: Department of Statistics, Singapore
Source L: Extract from a Policy Report on Income Inequality
"Singapore's Gini coefficient, a measure of income inequality where 0 represents perfect equality and 1 represents perfect inequality, has remained relatively stable over the past five years. Government transfers and taxes have consistently reduced the Gini coefficient by approximately 0.06 to 0.07, indicating that fiscal policy plays a significant role in redistributing income. The COVID-19 pandemic in 2020 led to additional government support measures, which temporarily reduced inequality. However, as these measures were phased out, inequality began to rise again in 2021 and 2022. Critics argue that more progressive taxation and increased social spending are needed to address structural inequality."
Question 18
With reference to Source K, compare the Gini coefficient before taxes and transfers in 2018 and 2022.
(2 marks)
Question 19
Using Source K and Source L, explain how government taxes and transfers reduce income inequality in Singapore.
(4 marks)
Question 20
Evaluate the view that more progressive taxation is the most effective way to reduce income inequality in Singapore.
(8 marks)
End of Quiz
Mark Summary
| Section | Questions | Marks |
|---|---|---|
| A: Data Interpretation | 1–8 | 20 |
| B: Application and Analysis | 9–14 | 18 |
| C: Evaluation and Synthesis | 15–20 | 42 |
| Total | 1–20 | 80 |
Answers
A-Level Economics H1 Quiz - Data Response
Answer Key and Marking Scheme
Section A: Data Interpretation (Questions 1–8)
Question 1
Compare the government expenditure on primary education and tertiary education from 2015 to 2022.
(2 marks)
Answer:
Both primary and tertiary education spending increased from 2015 to 2022. Primary education spending rose from 1,820millionto2,480 million, an increase of 660million(approximately363,400 million to 4,380million,anincreaseof980 million (approximately 29%). While both increased, primary education spending grew at a faster rate in percentage terms, although tertiary education spending remained significantly higher in absolute terms throughout the period.
Marking:
- 1 mark for identifying that both increased.
- 1 mark for a valid comparison using data from the table (either absolute or percentage terms).
Common mistakes:
- Only describing one sector without comparing.
- Failing to reference specific figures from the table.
- Not using comparative language ("both," "whereas," "in contrast").
Question 2
Calculate the percentage change in total education spending from 2015 to 2022. Show your working.
(2 marks)
Answer:
Percentage change=Old valueNew value−Old value×100%
Percentage change=7,3709,750−7,370×100%
=7,3702,380×100%
=0.3229×100%
=32.3% (to 1 d.p.)
Total education spending increased by approximately 32.3% from 2015 to 2022.
Marking:
- 1 mark for correct formula/method.
- 1 mark for correct final answer (accept 32% to 32.3%).
Common mistakes:
- Using the new value as the denominator instead of the old value.
- Forgetting to multiply by 100.
- Arithmetic errors in subtraction or division.
Question 3
Describe the trend in secondary education spending from 2015 to 2022.
(2 marks)
Answer:
Secondary education spending showed a consistent upward trend from 2015 to 2022, increasing from 2,150millionto2,890 million. The total increase was 740million,representingapproximatelya34.42,480 million to 2,720million(anincreaseof240 million in a single year), likely reflecting additional pandemic-related funding. The trend was generally steady with annual increases, and there was no year in which spending decreased.
Marking:
- 1 mark for identifying the upward/increasing trend.
- 1 mark for supporting the description with specific data from the table.
Common mistakes:
- Simply restating the numbers without describing the trend.
- Failing to mention the direction of change.
- Not providing any specific figures.
Question 4
Using Source A and Source B, explain one possible reason for the significant increase in education spending in 2020.
(3 marks)
Answer:
One possible reason for the significant increase in education spending in 2020 was the need to invest in digital learning infrastructure during the COVID-19 pandemic. As stated in Source B, the Government provided additional funding for digital learning infrastructure as schools shifted to home-based learning. This is supported by the data in Source A, which shows that total education spending jumped from 8,510millionin2019to9,170 million in 2020 — an increase of 660million,thelargestsingle−yearincreaseintheperiod.Primaryeducationspendingaloneincreasedby270 million (from 2,080millionto2,350 million), suggesting significant investment in technology and resources to support remote learning at all levels.
Marking:
- 1 mark for identifying a valid reason (digital learning infrastructure / COVID-19 response).
- 1 mark for explaining how this reason connects to increased spending.
- 1 mark for supporting the explanation with evidence from Source A or Source B.
Common mistakes:
- Giving a reason without linking it to the data.
- Providing a generic answer without referencing the sources.
- Failing to explain the causal link between the reason and the spending increase.
Question 5
Compare the unemployment rate in 2019 and 2021.
(2 marks)
Answer:
The unemployment rate was higher in 2021 (2.7%) than in 2019 (2.3%). The rate increased by 0.4 percentage points between the two years. This is notable because 2021 was a year of strong GDP recovery (7.6%), yet unemployment remained above the 2019 level, suggesting a lag in labour market recovery following the 2020 recession.
Marking:
- 1 mark for identifying that the unemployment rate was higher in 2021.
- 1 mark for providing specific data from the graph to support the comparison.
Common mistakes:
- Stating the values without comparing them.
- Getting the years mixed up.
- Not using the term "percentage points" when comparing percentages.
Question 6
Describe the relationship between GDP growth rate and unemployment rate from 2018 to 2023.
(3 marks)
Answer:
The data shows a general inverse (negative) relationship between GDP growth rate and unemployment rate from 2018 to 2023, consistent with Okun's Law. When GDP growth was high, unemployment tended to be low, and vice versa. For example, in 2020, GDP growth was at its lowest (-5.4%) and unemployment was at its highest (3.0%). Conversely, in 2021, GDP growth rebounded strongly to 7.6% and unemployment fell to 2.7%. However, the relationship is not perfectly inverse — in 2022, GDP growth was 3.6% and unemployment was 2.1%, while in 2018, GDP growth was 3.4% with unemployment at 2.1%, suggesting other factors also influence unemployment.
Marking:
- 1 mark for identifying the inverse/negative relationship.
- 1 mark for providing at least one specific example from the data.
- 1 mark for acknowledging the relationship is not perfect or mentioning other influencing factors.
Common mistakes:
- Claiming a perfect inverse relationship without qualification.
- Not providing specific data points.
- Describing the relationship without naming it (e.g., "inverse" or "negative").
Question 7
Using Sources C and D, explain how the Jobs Support Scheme (JSS) might have helped to reduce unemployment during the pandemic.
(4 marks)
Answer:
The Jobs Support Scheme (JSS) helped to reduce unemployment by subsidising up to 75% of the first $4,600 of monthly wages (Source D). This reduced the cost of labour for employers, making it more affordable for businesses to retain workers rather than retrench them during the economic downturn. By lowering the effective cost of employment, the JSS reduced the incentive for firms to lay off workers, thereby preventing unemployment from rising even further than the 3.0% recorded in 2020 (Source C). The scheme effectively bridged the gap between the sharp economic contraction (-5.4% GDP growth in 2020) and the labour market, ensuring that workers remained attached to their employers and could resume work quickly when the economy recovered in 2021.
Marking:
- 1 mark for identifying the mechanism of the JSS (wage subsidy).
- 1 mark for explaining how the subsidy reduces employers' costs.
- 1 mark for linking this to reduced retrenchment/unemployment.
- 1 mark for supporting the explanation with data from Source C or Source D.
Common mistakes:
- Describing the JSS without explaining how it reduces unemployment.
- Not linking the explanation to the data provided.
- Confusing the JSS with other government support measures.
Question 8
Based on the data in Source C, identify the year in which the GDP growth rate was negative and state the corresponding unemployment rate.
(2 marks)
Answer:
The GDP growth rate was negative in 2020, when it was -5.4%. The corresponding unemployment rate in 2020 was 3.0%.
Marking:
- 1 mark for correctly identifying 2020.
- 1 mark for stating the unemployment rate of 3.0%.
Common mistakes:
- Stating the GDP growth rate instead of the unemployment rate.
- Identifying the wrong year.
- Not providing the unemployment rate.
Section B: Application and Analysis (Questions 9–14)
Question 9
State the initial equilibrium price and quantity of EVs.
(1 mark)
Answer:
The initial equilibrium price is $120,000 and the initial equilibrium quantity is 8,000 units.
Marking:
- 1 mark for both correct values.
Common mistakes:
- Stating the values after the shift instead of the initial equilibrium.
- Omitting units.
Question 10
Explain two possible reasons for the shift in the demand curve from D1 to D2.
(4 marks)
Answer:
Reason 1: Government incentives for EV adoption, such as the EV Early Adoption Incentive (EEAI) which provides a rebate of up to $25,000 off the Additional Registration Fee (Source F). This effectively reduces the cost of purchasing an EV, increasing consumers' willingness and ability to buy EVs at any given price, shifting the demand curve rightward from D1 to D2.
Reason 2: Expansion of the public charging network (Source F). As the Government increases the number of charging points (targeting 60,000 by 2030), consumer confidence in EVs increases due to reduced "range anxiety." This makes EVs more attractive relative to conventional vehicles, increasing demand at each price level and shifting the demand curve rightward.
Marking:
- 2 marks per reason (1 mark for identifying the reason, 1 mark for explaining how it shifts demand).
- Maximum 4 marks.
Common mistakes:
- Confusing a shift in demand with a movement along the demand curve.
- Providing reasons that affect supply rather than demand.
- Not explaining the causal link between the reason and the demand shift.
Question 11
Explain how the government subsidy affects the market for EVs.
(4 marks)
Answer:
The government subsidy (such as the EEAI rebate) acts as a reduction in production costs or an incentive that shifts the supply curve rightward from S1 to S2 (Source E). This is because the subsidy effectively lowers the cost of supplying EVs to the market, encouraging producers to supply more at each price level. As a result of the rightward shift in supply, the equilibrium price falls from 135,000(atE2)to115,000 (at E3), and the equilibrium quantity increases from 12,000 units to 16,000 units. The subsidy therefore makes EVs more affordable for consumers and increases the quantity of EVs sold in the market, supporting the Government's goal of phasing out internal combustion engine vehicles by 2040 (Source F).
Marking:
- 1 mark for identifying that the subsidy shifts the supply curve rightward.
- 1 mark for explaining why the supply curve shifts (lower costs / increased incentive to supply).
- 1 mark for stating the effect on equilibrium price (falls).
- 1 mark for stating the effect on equilibrium quantity (rises).
Common mistakes:
- Confusing a supply shift with a demand shift.
- Not stating the direction of change for both price and quantity.
- Not referencing the diagram or data.
Question 12
Identify which good has the most price elastic demand and which has the most price inelastic demand.
(2 marks)
Answer:
- Most price elastic demand: Luxury watches (PED = -2.5)
- Most price inelastic demand: Petrol in the short run (PED = -0.2)
Marking:
- 1 mark for correctly identifying luxury watches as most elastic.
- 1 mark for correctly identifying petrol (short-run) as most inelastic.
Common mistakes:
- Ignoring the negative sign and comparing absolute values incorrectly.
- Confusing elastic with inelastic.
- Selecting petrol in the long run (-0.7) instead of the short run (-0.2).
Question 13
Explain why the 10% increase in petrol duties is likely to raise government revenue.
(3 marks)
Answer:
The 10% increase in petrol duties is likely to raise government revenue because the demand for petrol is price inelastic in the short run (PED = -0.2, Source G). When demand is price inelastic, the percentage decrease in quantity demanded is smaller than the percentage increase in price. Therefore, when the duty increases the price of petrol by 10%, the quantity demanded falls by less than 10% (approximately 2%, since PED = %ΔQd/%ΔP = -0.2, so %ΔQd = -0.2 × 10% = -2%). Since the price increase outweighs the fall in quantity demanded, total expenditure on petrol (and therefore government revenue from petrol duties) increases. As Source H notes, the duty increase will raise government revenue but may not significantly reduce petrol consumption immediately.
Marking:
- 1 mark for identifying that petrol demand is price inelastic.
- 1 mark for explaining that the % fall in quantity demanded is less than the % rise in price.
- 1 mark for concluding that government revenue therefore increases.
Common mistakes:
- Not referencing the PED value from Source G.
- Confusing the effect on revenue with the effect on consumption.
- Not explaining the relationship between inelastic demand and revenue.
Question 14
Explain why the demand for petrol is more elastic in the long run than in the short run.
(4 marks)
Answer:
The demand for petrol is more elastic in the long run (PED = -0.7) than in the short run (PED = -0.2) because consumers have more time to adjust their behaviour and find alternatives. In the short run, consumers are locked into existing habits, vehicle types, and commuting patterns, making it difficult to reduce petrol consumption significantly when prices rise. However, in the long run, consumers can:
-
Switch to substitutes: Consumers can switch to public transport, electric vehicles, or carpooling, as mentioned in Source H. The availability of substitutes makes demand more elastic.
-
Adjust consumption patterns: Over time, consumers can relocate closer to work, change jobs, or adopt remote working arrangements, reducing their dependence on petrol.
-
Invest in fuel-efficient technology: Consumers can replace their vehicles with more fuel-efficient models or EVs, reducing petrol consumption per kilometre travelled.
These adjustments take time, which is why demand is more responsive (elastic) in the long run than in the short run.
Marking:
- 1 mark for identifying that consumers have more time to adjust in the long run.
- 1 mark for explaining the role of substitutes (e.g., public transport, EVs).
- 1 mark for explaining changes in consumption patterns or technology.
- 1 mark for a clear conclusion linking time availability to elasticity.
Common mistakes:
- Simply stating that demand is more elastic in the long run without explaining why.
- Not referencing the specific PED values from Source G.
- Confusing short-run and long-run elasticity.
Section C: Evaluation and Synthesis (Questions 15–20)
Question 15
Describe the trend in Singapore's trade balance from 2018 to 2022.
(2 marks)
Answer:
Singapore's trade balance remained in surplus throughout the period from 2018 to 2022, but the trend was not consistent. The trade surplus increased from 43.6billionin2018to54.2 billion in 2020, before declining to 47.2billionin2021andfurtherto40.6 billion in 2022. Overall, the trade surplus narrowed from 2020 to 2022, with the 2022 figure (40.6billion)beinglowerthanthe2018figure(43.6 billion), indicating a general downward trend in the trade surplus over the full period despite the 2020 peak.
Marking:
- 1 mark for identifying that the trade balance remained in surplus / identifying the general trend.
- 1 mark for supporting the description with specific data from the table.
Common mistakes:
- Only describing one year without addressing the trend.
- Failing to mention the 2020 peak.
- Not providing specific figures.
Question 16
Explain two factors that could have contributed to the narrowing trade surplus from 2020 to 2022.
(4 marks)
Answer:
Factor 1: Rising import costs, particularly for energy and food, driven by global supply chain disruptions and geopolitical tensions (Source J). As a trade-dependent economy with limited natural resources, Singapore imports most of its energy and food. When global prices for these commodities rise, the value of imports increases, narrowing the trade surplus even if export values remain stable. This is reflected in Source I, where imports grew from 418.3billionin2020to521.8 billion in 2022, a significant increase of $103.5 billion.
Factor 2: Strong domestic demand and economic recovery. As Singapore's economy recovered from the pandemic (GDP growth of 7.6% in 2021 and 3.6% in 2022), domestic demand for imported goods and services increased. Higher consumer and business spending led to increased imports, which outpaced export growth and contributed to the narrowing trade surplus.
Marking:
- 2 marks per factor (1 mark for identifying the factor, 1 mark for explaining how it narrows the trade surplus).
- Maximum 4 marks.
Common mistakes:
- Providing factors without explaining how they affect the trade surplus.
- Confusing the trade balance with the current account balance.
- Not referencing the data or sources.
Question 17
Evaluate the effectiveness of a tight monetary policy (allowing the Singapore dollar to appreciate) in managing imported inflation in Singapore.
(8 marks)
Answer:
Introduction: A tight monetary policy, where the Monetary Authority of Singapore (MAS) allows the Singapore dollar (SGD) to appreciate against a basket of currencies, is a key tool for managing imported inflation in Singapore. This evaluation will assess its effectiveness by considering both its advantages and limitations.
Body – Arguments for effectiveness:
-
Reduces the cost of imports: When the SGD appreciates, it becomes stronger relative to other currencies, meaning that imports become cheaper in SGD terms. Since Singapore is highly import-dependent (importing most of its food, energy, and raw materials), an appreciating dollar directly reduces the price of imported goods, thereby lowering imported inflation. This is particularly important given the rising import costs noted in Source J.
-
Anchors inflation expectations: A strong currency signals the MAS's commitment to price stability, which can help anchor inflation expectations among businesses and consumers. If firms and households expect low inflation, they are less likely to demand higher wages or raise prices, creating a self-fulfilling low-inflation environment.
-
Attracts foreign capital: An appreciating currency can attract foreign investment, increasing demand for SGD and further strengthening the currency. This can create a virtuous cycle that reinforces the anti-inflationary effect.
Body – Arguments against effectiveness / limitations:
-
Negative impact on exports: An appreciating SGD makes Singapore's exports more expensive in foreign currency terms, reducing the competitiveness of Singaporean goods and services abroad. This could lead to lower export revenues, narrower trade surpluses (as seen in Source I), and slower economic growth, potentially increasing unemployment.
-
Limited control over global prices: While an appreciating currency can offset some imported inflation, it cannot fully counteract global supply shocks. If global commodity prices rise significantly (e.g., due to geopolitical tensions or supply chain disruptions), the appreciation of the SGD may not be sufficient to fully neutralise the inflationary impact.
-
Time lags: Monetary policy operates with time lags. The full effect of currency appreciation on inflation may take several quarters to materialise, during which inflation may already have caused economic damage.
-
One-dimensional tool: Singapore's monetary policy focuses on the exchange rate rather than interest rates, which limits the MAS's ability to address domestic demand-driven inflation. If inflation is driven by domestic factors (e.g., strong consumer spending), currency appreciation may be less effective.
Conclusion: Overall, a tight monetary policy allowing the SGD to appreciate is an effective tool for managing imported inflation in Singapore, particularly given the country's heavy reliance on imports. However, its effectiveness is limited by its negative impact on export competitiveness and its inability to address domestic sources of inflation. It should therefore be used in conjunction with other policies, such as fiscal measures and supply-side policies, to achieve comprehensive inflation management.
Marking:
- 1 mark for defining the policy and setting up the evaluation.
- 2–3 marks for explaining how the policy works to reduce imported inflation.
- 2–3 marks for discussing limitations or negative consequences.
- 1–2 marks for a balanced conclusion.
Common mistakes:
- Only discussing the benefits without evaluating limitations.
- Not referencing the data or sources provided.
- Confusing monetary policy with fiscal policy.
- Not reaching a clear conclusion.
Question 18
Compare the Gini coefficient before taxes and transfers in 2018 and 2022.
(2 marks)
Answer:
The Gini coefficient before taxes and transfers was slightly lower in 2022 (0.456) compared to 2018 (0.458), a marginal decrease of 0.002. This suggests that market income inequality was very slightly lower in 2022 than in 2018, although the difference is minimal. Both values indicate a relatively high level of income inequality before government intervention, with the Gini coefficient remaining above 0.45 in both years.
Marking:
- 1 mark for identifying that the Gini coefficient was slightly lower in 2022 (or that they were similar).
- 1 mark for providing specific data from the table.
Common mistakes:
- Comparing the wrong columns (after taxes instead of before).
- Not providing specific figures.
- Overstating the significance of a very small difference.
Question 19
Explain how government taxes and transfers reduce income inequality in Singapore.
(4 marks)
Answer:
Government taxes and transfers reduce income inequality through fiscal redistribution. Source K shows that the Gini coefficient after taxes and transfers is consistently lower than before taxes and transfers, with the difference ranging from approximately 0.06 to 0.07. This reduction occurs through two main mechanisms:
-
Progressive taxation: The Government collects more tax revenue from higher-income earners through progressive income tax rates. This reduces the disposable income of the wealthy, narrowing the income gap between high and low earners.
-
Government transfers: The Government redistributes the collected tax revenue to lower-income households through various transfer programmes, such as the GST Voucher scheme, Workfare Income Supplement, and ComCare. These transfers increase the disposable income of lower-income households, raising their standard of living and reducing income inequality.
The data in Source K demonstrates this effect clearly: in 2018, the Gini coefficient fell from 0.458 (before taxes and transfers) to 0.398 (after taxes and transfers), a reduction of 0.06. Similarly, in 2020, additional government support measures during the pandemic reduced the Gini coefficient from 0.452 to 0.375, a larger reduction of 0.077, showing that increased government intervention can further reduce inequality.
Marking:
- 1 mark for identifying progressive taxation as a mechanism.
- 1 mark for identifying government transfers as a mechanism.
- 1 mark for explaining how each mechanism reduces inequality.
- 1 mark for supporting the explanation with data from Source K.
Common mistakes:
- Not explaining the mechanisms, only stating that taxes and transfers reduce inequality.
- Not referencing the data from Source K.
- Confusing taxes and transfers (e.g., saying taxes increase inequality).
Question 20
Evaluate the view that more progressive taxation is the most effective way to reduce income inequality in Singapore.
(8 marks)
Answer:
Introduction: Progressive taxation, where higher-income earners pay a larger proportion of their income in taxes, is often proposed as a solution to income inequality. This evaluation assesses whether it is the most effective approach for Singapore, considering its merits and limitations relative to alternative policies.
Body – Arguments supporting progressive taxation:
-
Direct redistribution: Progressive taxation directly reduces income inequality by taking a larger share from higher-income earners and redistributing it through government transfers. Source K shows that taxes and transfers reduce the Gini coefficient by approximately 0.06 to 0.07, demonstrating the effectiveness of fiscal redistribution. Making the tax system more progressive would amplify this effect.
-
Revenue generation: More progressive taxation generates additional government revenue, which can be used to fund social programmes, education, and healthcare for lower-income households. This addresses the root causes of inequality by improving access to opportunities.
-
International examples: Countries with more progressive tax systems, such as those in Scandinavia, tend to have lower Gini coefficients, suggesting that progressive taxation can be effective in reducing inequality.
Body – Arguments against progressive taxation as the most effective solution:
-
Disincentive effects: Higher tax rates on high earners may discourage work effort, entrepreneurship, and investment. In Singapore's context, where attracting global talent and investment is crucial for economic growth, excessively progressive taxation could drive away skilled professionals and multinational corporations, potentially reducing overall economic prosperity and government revenue.
-
Tax avoidance and evasion: High-income individuals and corporations have greater resources and opportunities to engage in tax avoidance (legal) or tax evasion (illegal). This limits the effectiveness of progressive taxation and may result in lower-than-expected revenue collection.
-
Alternative policies may be more effective:
- Supply-side policies: Investing in education and skills training (as reflected in Singapore's education spending in Source A) can address the root causes of inequality by improving human capital and enabling upward mobility.
- Targeted transfers: Rather than relying solely on progressive taxation, targeted transfer programmes (e.g., Workfare, GST Vouchers) can directly support lower-income households without the disincentive effects of higher taxes.
- Minimum wage policies: Implementing or raising a minimum wage could directly increase the incomes of the lowest-paid workers.
-
Singapore's unique context: Singapore relies on low tax rates to maintain its competitiveness as a global business hub. The Government has historically favoured a broad-based, low-rate tax system with targeted transfers rather than highly progressive taxation. This approach has supported economic growth while still achieving significant redistribution, as shown in Source K.
Conclusion: While more progressive taxation can contribute to reducing income inequality, it may not be the most effective approach for Singapore given the potential disincentive effects, tax avoidance risks, and the country's reliance on low taxes to maintain competitiveness. A combination of targeted transfers, investment in education and skills, and supply-side policies may be more effective in addressing both the symptoms and root causes of income inequality in Singapore's unique economic context.
Marking:
- 1 mark for defining progressive taxation and setting up the evaluation.
- 2–3 marks for explaining how progressive taxation can reduce inequality.
- 2–3 marks for discussing limitations and alternative policies.
- 1–2 marks for a balanced conclusion that considers Singapore's context.
Common mistakes:
- Only discussing the benefits of progressive taxation without evaluating alternatives.
- Not referencing the data or sources provided.
- Not considering Singapore's specific economic context.
- Reaching a one-sided conclusion without acknowledging trade-offs.
Mark Summary
| Section | Questions | Marks |
|---|---|---|
| A: Data Interpretation | 1–8 | 20 |
| B: Application and Analysis | 9–14 | 18 |
| C: Evaluation and Synthesis | 15–20 | 42 |
| Total | 1–20 | 80 |
Free quiz and exam paper access
Enter your details to view this paper
Your access is remembered on this device.