From Real Exams Exam Paper
A Level H1 Economics Practice Paper 2
Free A Level H1 Econs Practice Paper 2, HY3 Exam version, with questions, answers, and A Level-style practice for Singapore students.
These static practice materials are generated from the site's syllabus and paper-generation workflow, with source and model context shown so students and parents can evaluate the material before use.
Questions
Free quiz and exam paper access
Enter your details to view this paper
Your access is remembered on this device.
Answers
TuitionGoWhere Practice Paper - Economics H1 A-Level (Version 2) Answer Key
Total Marks: 60
Case Study 1: 30 marks
Case Study 2: 30 marks
Case Study 1 Answers
Q1. [2 marks]
Compare unemployment and youth unemployment 2019–2023 from Table 1.1.
- Both rates fell over the period: overall from 4.1% to 3.5%; youth from 8.2% to 6.9%. [1]
- Youth unemployment was consistently about double the overall rate, but the gap narrowed by 2023. [1]
Marking: 1 for each correct comparative observation with reference to table.
Q2. [2 marks]
Trend in real GDP growth 2020–2023:
- After contracting by 2.1% in 2020, growth turned positive in 2021 (2.4%) and accelerated to 3.6% (2022) and 4.0% (2023). [1 for direction + turning point, 1 for acceleration note]
Q3. [2 marks]
Govt training spending 2019 vs 2023:
- Rose from 260m, more than doubling. [1]
- Increase was sharpest in 2020–2021 during high unemployment. [1]
Q4. [2 marks]
Extract 1.1: youth unemployment fell 1.3 pts from 2022 to 2023 (7.8% to 6.9%).
- Due to subsidised training improving skills matching. [1]
- Programme effect compounded by general recovery. [1]
Q5. [2 marks]
Real GDP growth 2020 (-2.1%) vs 2023 (4.0%):
- Contrast: negative recession to strong positive. [1]
- Difference of 6.1 percentage points. [1]
Q6. [2 marks]
Training spending trend:
- Increased every year from 260m. [1]
- Largest jump 2019→2020 ($90m) when unemployment peaked. [1]
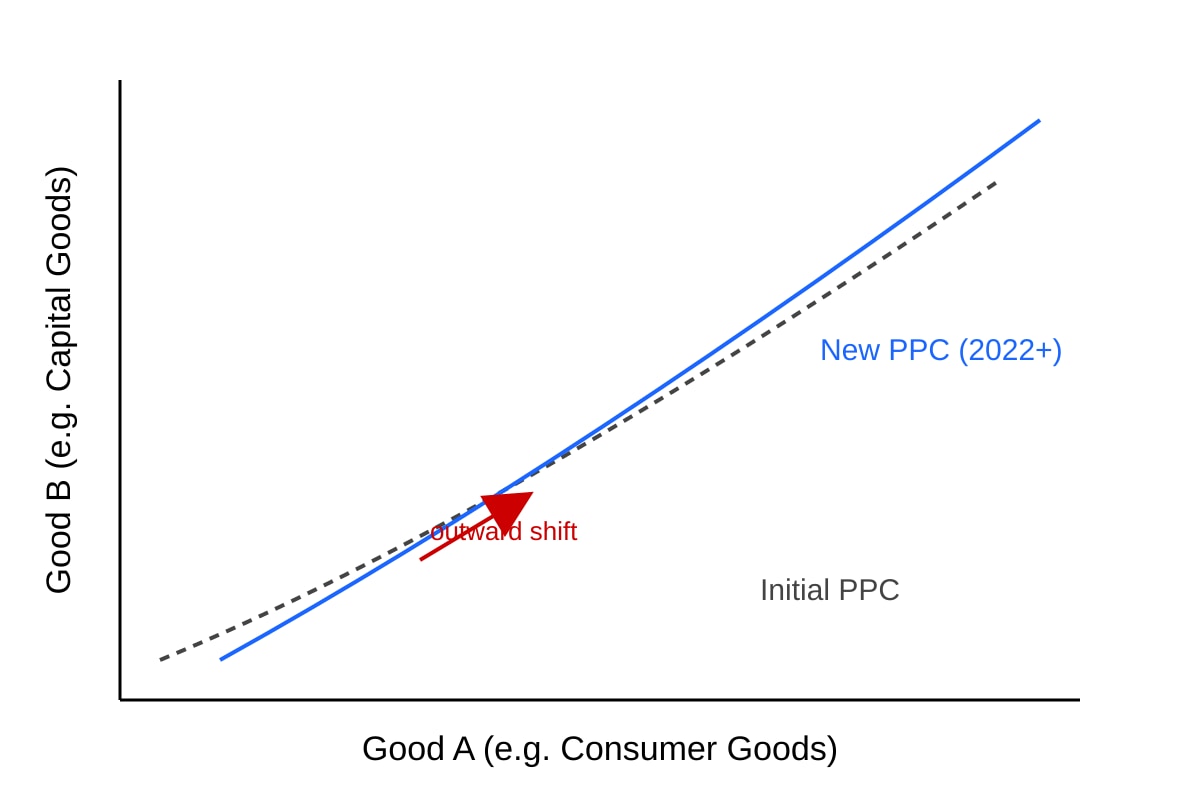
Q7. [4 marks] PPC outward shift.
- Extract 1.2 states PPC shifted outward after 2021 due to skilled workforce. [1]
- Diagram: original concave PPC, new PPC outside/right. [1]
- Outward shift = increase in productive capacity from human capital. [1]
- Does not mean full employment (still short-run unemployment above natural rate 2020–21). [1]
Teaching: PPC shows max combo of 2 goods; outward shift = growth.
Q8. [3 marks] Recession in 2020?
- Yes: real GDP growth was -2.1% in 2020 (Table). [1]
- Recession = negative GDP growth / falling output. [1]
- Unemployment rose to 6.8%, confirming demand fall. [1]
Q9. [3 marks] Why overall fell faster than youth:
- Youth need skills; training takes time (Extract 1.1). [1]
- Non-youth jobs recovered quicker as economy opened. [1]
- Table: youth unemp 13.5% (2020) to 6.9% (2023) vs overall 6.8% to 3.5%. [1]
Q10. [8 marks] Discuss training effectiveness on living standards.
AO4 evaluation expected.
Content points:
- For: youth unemp fell, GDP grew, skills raise productivity (Extract 1.2). [2]
- Against: spending rose to $260m; short-run unemployment still > natural 2020–21. [2]
- Living standards: material via GDP, but equity via youth gap remaining. [2]
- Conclusion: effective by 2023 but costly; trade-off with fiscal space. [2]
Marking descriptors: identify (2), explain (2), evaluate trade-offs (2), conclusion (2).
Case Study 2 Answers
Q11. [2 marks]
Rena vs Sora food index 2018–2022:
- Both rose (Rena 100→130, Sora 100→125). [1]
- Rena rose faster; by 2022 Rena 5 pts above Sora (Extract 2.2). [1]
Q12. [2 marks]
Sora subsidy trend:
- Increased from 110m every year. [1]
- More than doubled, steepest rise 2020–2022. [1]
Q13. [2 marks]
Increase 2018–2022: Rena +30 pts, Sora +25 pts.
- Rena increase larger by 5 pts. [1]
- Both upward, Rena steeper. [1]
Q14. [2 marks]
PED = -0.4:
- Inelastic (|0.4|<1); quantity demanded changes less than price. [1]
- Food is necessity, few substitutes (Extract 2.1). [1]
Q15. [2 marks]
2022: Rena 130, Sora 125.
- Rena higher by 5 points. [1]
- Matches Extract 2.2. [1]
Q16. [2 marks]
Rena index trend:
- Steady rise 100→130, ~6–8 pts/yr. [1]
- No fall; supply disruptions (Extract 2.1). [1]
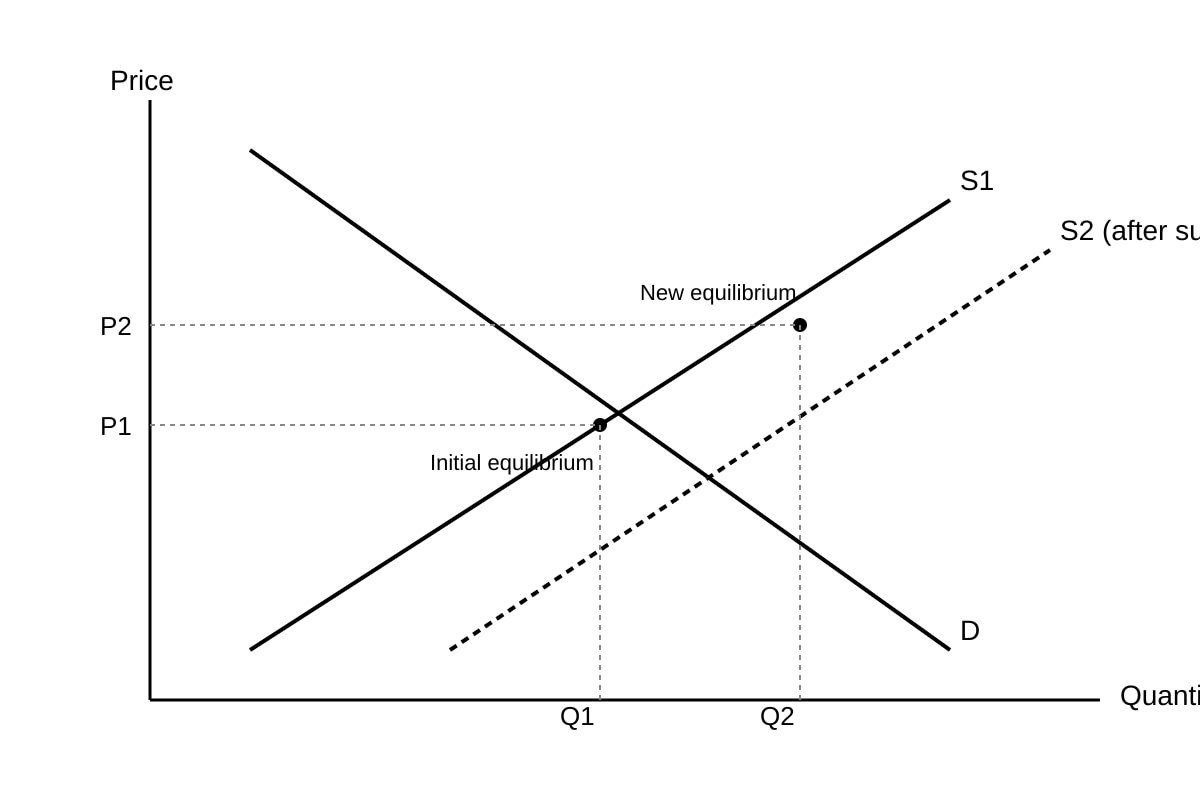
Q17. [4 marks] Subsidy effect via D-S diagram.
- Subsidy lowers producer cost → S shifts right S1 to S2. [1]
- Equilibrium price falls P1→P2, quantity rises Q1→Q2. [1]
- Consumers pay less (Extract 2.2). [1]
- Govt spends subsidy (Table Sora $110m 2022). [1]
Diagram must show right-shifted S, lower P, higher Q.
Q18. [3 marks] PES for Rena food:
- Likely inelastic short-run due to supply chain disruptions. [1]
- Farming/imports need time to adjust. [1]
- Long-run more elastic if investment made. [1]
Q19. [3 marks] Rena expenditure rose:
- PED inelastic (-0.4), price rose 30%. [1]
- %Qd fall < %P rise, so total spending = P×Q rises. [1]
- Table shows index up; spending up despite slight volume drop. [1]
Q20. [8 marks] Discuss subsidy vs non-intervention.
- For Sora: lower prices, index 5 pts lower, protects households. [2]
- Against: fiscal cost $110m, possible inefficiency. [2]
- Rena: no cost but higher prices hurt living standards. [2]
- Conclusion: Sora more effective for equity, but sustainability unknown. [2]
AO4: trade-off, assumptions, unintended consequences.