From Real Exams Exam Paper
A Level H1 Economics Practice Paper 1
Free A Level H1 Econs Practice Paper 1, LongCat Exam version, with questions, answers, and A Level-style practice for Singapore students.
These static practice materials are generated from the site's syllabus and paper-generation workflow, with source and model context shown so students and parents can evaluate the material before use.
Questions
TuitionGoWhere Practice Paper - Economics H1 A-Level
TuitionGoWhere Secondary School (AI)
| Subject: | Economics H1 |
| Level: | A-Level |
| Paper: | Practice Paper 1 (Version 1 of 5) |
| Duration: | 90 minutes |
| Total Marks: | 60 |
| Name: | ________________________ |
| Class: | ________________________ |
| Date: | ________________________ |
Instructions to Candidates
- Answer ALL questions in Section A and Section B.
- Write your answers in the spaces provided.
- Begin each question on a new page if needed.
- Show all working for calculation-based questions.
- Use economic terminology where appropriate.
- The number of marks for each question is shown in brackets [ ].
- You are advised to spend approximately 45 minutes on each section.
Section A: Data Response Questions [30 marks]
Read the following passage and data carefully, then answer Questions 1–10.
The Singapore Healthcare Sector: Rising Costs and Policy Responses
Singapore's healthcare expenditure has been rising steadily over the past two decades. The government has implemented various policies to manage healthcare costs while ensuring accessibility for all citizens. The following data and extracts provide an overview of key trends and policy measures.
Extract 1: Healthcare Expenditure in Singapore
| Year | Government Health Expenditure (S$ billion) | Per Capita Health Expenditure (S$) | Share of GDP (%) |
|---|---|---|---|
| 2010 | 3.8 | 1,850 | 1.2 |
| 2014 | 5.6 | 2,420 | 1.5 |
| 2018 | 8.2 | 3,150 | 1.9 |
| 2022 | 11.5 | 4,100 | 2.3 |
Source: Ministry of Health, Singapore (adapted)
Extract 2: Ageing Population Projections
| Year | Resident Population Aged 65 and Above (thousands) | Proportion of Total Resident Population (%) |
|---|---|---|
| 2010 | 330 | 9.0 |
| 2014 | 410 | 10.5 |
| 2018 | 520 | 13.0 |
| 2022 | 650 | 16.0 |
Source: Department of Statistics, Singapore (adapted)
Extract 3: Government Policy Measures
In 2015, the government introduced MediShield Life, a compulsory health insurance scheme that provides universal coverage for all Singapore citizens and permanent residents. The scheme covers large hospital bills and certain costly outpatient treatments such as dialysis and chemotherapy. Premiums are subsidised for lower- and middle-income households.
In 2020, the government launched the Community Health Assist Scheme (CHAS) expansion, extending subsidies for common illnesses, chronic dental care, and selected health screenings to all Singaporeans regardless of income. The government allocated an additional S$6.2 billion to the Healthcare 2020 Masterplan.
In 2023, the Healthier SG strategy was announced, focusing on preventive care. Under this strategy, every Singaporean is encouraged to enrol with a family physician who will develop a personalised health plan. The government committed S$400 million over three years to support this initiative.
Extract 4: Private Healthcare Costs
A study by the Singapore Economic Review (2023) found that private healthcare costs rose by an average of 6.5% per year between 2018 and 2022, significantly outpacing the general inflation rate of 2.1% per year over the same period. The study attributed this to rising demand for private services, an ageing population, and increasing costs of medical technology. The study also noted that the price elasticity of demand for private healthcare services was estimated at –0.3, suggesting that demand is relatively price inelastic.
Question 1 [2 marks]
With reference to Extract 1, compare the government health expenditure and the share of GDP between 2010 and 2022.
Question 2 [2 marks]
With reference to Extract 2, describe the trend in Singapore's ageing population from 2010 to 2022.
Question 3 [3 marks]
Using the data in Extract 1, calculate the approximate percentage increase in per capita health expenditure from 2010 to 2022. Show your working.
Question 4 [3 marks]
Explain one likely reason, other than an ageing population, for the rise in government health expenditure shown in Extract 1.
Question 5 [3 marks]
With reference to Extract 3, explain how the introduction of MediShield Life might help to address the problem of market failure in the healthcare market.
Question 6 [4 marks]
Using a demand and supply diagram, explain how the ageing population (Extract 2) and rising private healthcare costs (Extract 4) might affect the market for private healthcare services in Singapore.
Generated diagram for Q6.
Question 7 [3 marks]
With reference to Extract 4, the price elasticity of demand for private healthcare is estimated at –0.3. Explain what this value means and discuss one implication for private healthcare providers.
Question 8 [3 marks]
Explain one advantage and one disadvantage of the government subsidising healthcare premiums for lower- and middle-income households under MediShield Life (Extract 3).
Question 9 [3 marks]
Using evidence from the extracts, explain why the government might prefer preventive care strategies (such as Healthier SG in Extract 3) over simply increasing hospital capacity to manage rising healthcare demand.
Question 10 [4 marks]
Evaluate whether government intervention in the healthcare market is likely to be effective in managing rising healthcare costs in Singapore. Use evidence from the extracts to support your answer.
Section B: Structured and Essay Questions [30 marks]
Answer Questions 11–20. These questions test your ability to apply economic concepts to data and policy contexts.
Question 11 [2 marks]
Define the term opportunity cost.
Question 12 [2 marks]
State two characteristics of a public good.
(i) _______________________________________________________________________
(ii) ______________________________________________________________________
Question 13 [3 marks]
The table below shows the market for face masks during a health crisis.
| Price per pack (S$) | Quantity Demanded (thousands) | Quantity Supplied (thousands) |
|---|---|---|
| 5 | 200 | 40 |
| 10 | 160 | 80 |
| 15 | 120 | 120 |
| 20 | 80 | 160 |
| 25 | 40 | 200 |
(a) What is the equilibrium price? [1 mark]
(b) If the government imposes a price ceiling of S$8 per pack, calculate the excess demand. Show your working. [2 marks]
Question 14 [3 marks]
Explain two factors that would cause the demand curve for electric vehicles in Singapore to shift to the right.
(i) _______________________________________________________________________
(ii) ______________________________________________________________________
Question 15 [3 marks]
Using the concept of negative externalities, explain why the government might impose a tax on tobacco products. Include a diagram in your answer.
Generated diagram for Q15.
Question 16 [3 marks]
The table below shows data for two countries, A and B.
| Country A | Country B | |
|---|---|---|
| GDP growth rate (%) | 3.2 | 1.5 |
| Unemployment rate (%) | 2.8 | 6.5 |
| Inflation rate (%) | 1.2 | 4.8 |
With reference to the data above, compare the macroeconomic performance of Country A and Country B.
Question 17 [3 marks]
Explain the difference between demand-pull inflation and cost-push inflation. Give one example of each.
Question 18 [3 marks]
Study the following data on Singapore's trade:
| Year | Exports (S$ billion) | Imports (S$ billion) | Balance of Trade (S$ billion) |
|---|---|---|---|
| 2019 | 520 | 480 | +40 |
| 2020 | 490 | 440 | +50 |
| 2021 | 560 | 510 | +50 |
| 2022 | 610 | 570 | +40 |
(a) Describe the trend in Singapore's balance of trade from 2019 to 2022. [1 mark]
(b) Suggest one possible reason for the change in the balance of trade between 2020 and 2021. [2 marks]
Question 19 [4 marks]
Evaluate the effectiveness of using subsidies as a government intervention to correct market failure in the market for merit goods such as education.
Question 20 [4 marks]
A government is considering two policy options to reduce traffic congestion in the city centre:
- Option A: Impose a congestion charge of S$5 per vehicle entering the city centre during peak hours.
- Option B: Increase government spending on public transport by S$500 million to improve bus and rail services.
Evaluate which policy option is likely to be more effective in reducing traffic congestion. Use economic reasoning in your answer.
END OF PAPER
Marking Scheme and Answer Key follow on the next page.
Answers
TuitionGoWhere Practice Paper - Economics H1 A-Level
Answer Key and Marking Scheme
Section A: Data Response Questions [30 marks]
Question 1 [2 marks]
Question: With reference to Extract 1, compare the government health expenditure and the share of GDP between 2010 and 2022.
Answer:
Government health expenditure increased from S3.8billionin2010toS11.5 billion in 2022, representing an approximate threefold increase. Similarly, the share of GDP devoted to health expenditure rose from 1.2% in 2010 to 2.3% in 2022, nearly doubling. Both measures show a significant upward trend, indicating that healthcare has become an increasingly important component of government spending and the overall economy.
Marking Scheme:
- [1 mark] Correct comparison of government health expenditure (both values stated with direction of change)
- [1 mark] Correct comparison of share of GDP (both values stated with direction of change)
- Award full marks if both comparisons are accurate with reference to the data. Award 1 mark if only one comparison is made correctly.
Common Mistakes:
- Stating only one year's data without comparing both years
- Failing to reference the table/extract explicitly
- Describing only one variable (e.g., only expenditure, not GDP share)
Question 2 [2 marks]
Question: With reference to Extract 2, describe the trend in Singapore's ageing population from 2010 to 2022.
Answer:
The number of residents aged 65 and above increased steadily from 330,000 in 2010 to 650,000 in 2022, more than doubling over the period. The proportion of the total resident population aged 65 and above also rose consistently from 9.0% to 16.0%, an increase of 7 percentage points. This shows a clear and significant trend of population ageing in Singapore.
Marking Scheme:
- [1 mark] Correct description of the increase in absolute numbers (with data reference)
- [1 mark] Correct description of the increase in proportion/percentage (with data reference)
Common Mistakes:
- Only describing the absolute number without mentioning the proportion
- Failing to quote figures from the extract
- Using vague language like "increased a lot" without specific data
Question 3 [3 marks]
Question: Using the data in Extract 1, calculate the approximate percentage increase in per capita health expenditure from 2010 to 2022. Show your working.
Answer:
Per capita health expenditure in 2010 = S1,850Percapitahealthexpenditurein2022=S4,100
Percentage increase = [(New value − Old value) / Old value] × 100% = [(4,100 − 1,850) / 1,850] × 100% = (2,250 / 1,850) × 100% = 1.216 × 100% = 121.6% (or approximately 122%)
Marking Scheme:
- [1 mark] Correct identification of both values from the table
- [1 mark] Correct formula/method applied
- [1 mark] Correct final answer (accept 121%–122%)
Common Mistakes:
- Using total government expenditure instead of per capita expenditure
- Dividing by the new value instead of the old value
- Arithmetic errors in subtraction or division
Question 4 [3 marks]
Question: Explain one likely reason, other than an ageing population, for the rise in government health expenditure shown in Extract 1.
Answer:
One likely reason is the advancement and increasing cost of medical technology. As new medical equipment, treatments, pharmaceuticals, and diagnostic tools become available, they tend to be more expensive than existing options. The government may need to invest in these technologies to maintain a high standard of healthcare. For example, new cancer treatments, robotic surgery systems, and advanced imaging technology all carry high costs. Since the government subsidises a significant portion of healthcare in Singapore, rising costs of medical technology directly increase government health expenditure.
Alternative acceptable answers include:
- Rising wages of healthcare professionals (doctors, nurses) due to labour shortages
- Increased prevalence of chronic diseases (e.g., diabetes, heart disease) requiring long-term treatment
- Expansion of healthcare infrastructure (new hospitals, polyclinics)
- Government policy to increase subsidies and coverage (e.g., MediShield Life, CHAS)
Marking Scheme:
- [1 mark] Identification of a valid reason (not ageing population)
- [1 mark] Explanation of how the reason leads to higher government expenditure
- [1 mark] Development with an example or further economic reasoning
Question 5 [3 marks]
Question: With reference to Extract 3, explain how the introduction of MediShield Life might help to address the problem of market failure in the healthcare market.
Answer:
Healthcare markets suffer from market failure due to asymmetric information — patients often lack the knowledge to assess the quality and necessity of medical treatments, and they may not be able to make informed decisions, especially in emergencies. Additionally, healthcare has characteristics of a merit good, meaning individuals may under-consume it if left to the free market because they underestimate its long-term benefits.
MediShield Life, as a compulsory health insurance scheme, addresses these issues in two ways:
-
Overcoming under-consumption of merit goods: By making health insurance compulsory, it ensures that all citizens have coverage for large hospital bills and costly treatments. This prevents individuals from opting out due to information failure or short-sightedness, thereby increasing consumption towards the socially optimal level.
-
Addressing adverse selection: In a voluntary insurance market, only those who expect to make claims (typically older or sicker individuals) would buy insurance, leading to rising premiums and market failure (the "death spiral"). Compulsion ensures a broad risk pool, keeping premiums manageable and the scheme viable.
Marking Scheme:
- [1 mark] Identification of a relevant type of market failure (asymmetric information, merit good, adverse selection, or public good characteristics)
- [1 mark] Explanation of how the market failure manifests in healthcare
- [1 mark] Clear link between MediShield Life and how it addresses the identified market failure
Common Mistakes:
- Simply describing what MediShield Life is without linking to market failure
- Identifying market failure without explaining the mechanism of how the policy addresses it
- Confusing market failure types (e.g., calling healthcare a pure public good when it is not — it is excludable and rival)
Question 6 [4 marks]
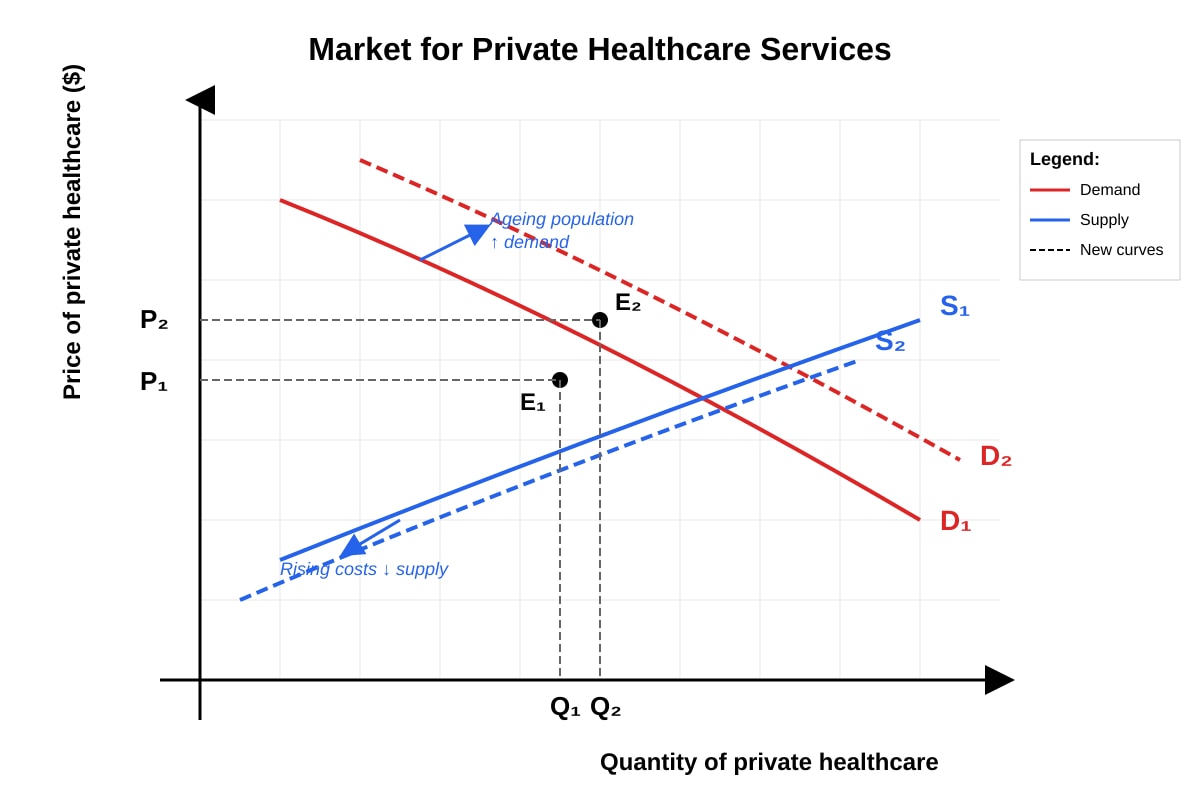
Question: Using a demand and supply diagram, explain how the ageing population (Extract 2) and rising private healthcare costs (Extract 4) might affect the market for private healthcare services in Singapore.
Answer:
The market for private healthcare services is affected by two simultaneous shifts:
1. Increase in demand (due to ageing population): As the proportion of the population aged 65 and above rises (from 9.0% in 2010 to 16.0% in 2022), the demand for private healthcare services increases because older individuals typically require more frequent and intensive medical care. This shifts the demand curve rightward from D1 to D2.
2. Decrease in supply (due to rising costs of medical technology): Extract 4 notes that private healthcare costs rose by 6.5% per year, partly due to increasing costs of medical technology. Higher costs of production (e.g., expensive equipment, skilled labour) mean that providers are willing to supply fewer services at each price level, shifting the supply curve leftward from S1 to S2.
Combined effect: Both shifts lead to a higher equilibrium price (P1 → P2). The effect on equilibrium quantity is ambiguous — the demand increase tends to raise quantity while the supply decrease tends to lower it. The net effect depends on the relative magnitude of the two shifts. In this context, given the strong demand pressure from a rapidly ageing population, quantity is likely to increase slightly, but the dominant observable effect is a significant rise in price.
Marking Scheme:
- [1 mark] Correct explanation of demand increase with rightward shift (linked to ageing population)
- [1 mark] Correct explanation of supply decrease with leftward shift (linked to rising costs)
- [1 mark] Correct diagram with both shifts, labelled axes, and correct direction of price change
- [1 mark] Discussion of the ambiguous quantity effect or reasoned conclusion about the net effect
Common Mistakes:
- Shifting only one curve instead of both
- Incorrectly labelling axes (e.g., putting quantity on the vertical axis)
- Failing to explain the economic reasoning behind each shift
- Stating a definite change in quantity without acknowledging ambiguity
Expected Diagram Features (for Q6-fig1):
- Vertical axis: Price of private healthcare; Horizontal axis: Quantity of private healthcare
- D1 shifting right to D2; S1 shifting left to S2
- P2 > P1 clearly shown; Q2 ambiguous relative to Q1
- All curves and equilibrium points clearly labelled
Question 7 [3 marks]
Question: With reference to Extract 4, the price elasticity of demand for private healthcare is estimated at –0.3. Explain what this value means and discuss one implication for private healthcare providers.
Answer:
Meaning: A PED of –0.3 means that demand for private healthcare is price inelastic. Specifically, a 1% increase in the price of private healthcare services would lead to only a 0.3% decrease in the quantity demanded. The negative sign reflects the inverse relationship between price and quantity demanded (the law of demand). The magnitude being less than 1 (in absolute value) indicates that consumers are relatively unresponsive to price changes.
This is because healthcare is often a necessity — when individuals are ill, they cannot easily forgo treatment regardless of price. There are also few close substitutes for specialised medical treatments, and in emergencies, consumers have little choice but to pay.
Implication for private healthcare providers: Since demand is price inelastic, private healthcare providers can increase their total revenue by raising prices. When demand is inelastic, the percentage fall in quantity demanded is proportionally smaller than the percentage rise in price, so total revenue (P × Q) increases. This gives providers an incentive to raise prices, which may further contribute to the rising healthcare costs noted in Extract 4.
Marking Scheme:
- [1 mark] Correct interpretation of PED = –0.3 as price inelastic (with explanation of what the value means)
- [1 mark] Explanation of why demand is inelastic (necessity, lack of substitutes, etc.)
- [1 mark] Valid implication for providers (e.g., ability to raise revenue by increasing prices)
Question 8 [3 marks]
Question: Explain one advantage and one disadvantage of the government subsidising healthcare premiums for lower- and middle-income households under MediShield Life (Extract 3).
Answer:
Advantage: Improved equity and access to healthcare Subsidising premiums ensures that lower- and middle-income households can afford health insurance coverage. Without subsidies, these households might be unable to pay premiums and would be left uninsured, facing potentially catastrophic medical bills. This promotes equity by ensuring that access to healthcare is not solely determined by ability to pay. It also addresses the market failure associated with merit goods — individuals may under-consume healthcare if they cannot afford it, leading to worse health outcomes and higher long-term costs for society.
Disadvantage: Opportunity cost and government budget burden The subsidies represent a significant cost to the government. The funds used for healthcare premium subsidies have an opportunity cost — they could have been spent on other areas such as education, infrastructure, or defence. As healthcare costs continue to rise (Extract 1 shows expenditure more than tripled from 2010 to 2022), the subsidy burden on the government budget grows, potentially requiring higher taxes or reduced spending elsewhere. Additionally, subsidies may create moral hazard — insured individuals may over-consume healthcare services because they do not bear the full cost, leading to inefficiency.
Marking Scheme:
- [1 mark] One valid advantage clearly explained with economic reasoning
- [1 mark] One valid disadvantage clearly explained with economic reasoning
- [1 mark] Use of appropriate economic terminology and/or reference to the extract
Common Mistakes:
- Stating advantages/disadvantages without economic explanation
- Confusing subsidy effects with tax effects
- Not linking the answer to the context of healthcare/MediShield Life
Question 9 [3 marks]
Question: Using evidence from the extracts, explain why the government might prefer preventive care strategies (such as Healthier SG in Extract 3) over simply increasing hospital capacity to manage rising healthcare demand.
Answer:
The government might prefer preventive care strategies for the following reasons:
1. Lower long-term costs: Preventive care (e.g., health screenings, early intervention, lifestyle management under Healthier SG) can reduce the incidence of costly chronic diseases such as diabetes, heart disease, and cancer. Treating these conditions at an advanced stage in hospitals is far more expensive than preventing or managing them early. Given that government health expenditure has already risen from S3.8billiontoS11.5 billion (Extract 1), a cost-effective approach is needed.
2. Addressing the root cause rather than the symptom: The ageing population (Extract 2 shows the 65+ population rising from 330,000 to 650,000) means demand for healthcare will continue to grow. Simply increasing hospital capacity treats the symptom (lack of beds/facilities) but does not reduce the underlying demand. Preventive care can slow the progression of age-related illnesses, reducing the need for hospitalisation in the first place.
3. More efficient use of resources: Building new hospitals and training medical staff is capital-intensive and time-consuming. Preventive care, supported by family physicians (as in Healthier SG), can be delivered more efficiently at the community level, freeing up hospital resources for acute and emergency cases.
Marking Scheme:
- [1 mark] Identification of a valid reason with economic reasoning
- [1 mark] Development of the reason with reference to evidence from the extracts
- [1 mark] Clear comparison with the alternative (increasing hospital capacity)
Question 10 [4 marks]
Question: Evaluate whether government intervention in the healthcare market is likely to be effective in managing rising healthcare costs in Singapore. Use evidence from the extracts to support your answer.
Answer:
Introduction: Government intervention in healthcare takes many forms, including insurance schemes (MediShield Life), subsidies (CHAS), and preventive care strategies (Healthier SG). Whether these interventions are effective in managing rising costs depends on their ability to address the underlying causes of cost increases and their potential limitations.
Arguments that intervention CAN be effective:
-
Addressing market failure: Healthcare markets are characterised by asymmetric information, merit good characteristics, and externalities. Without intervention, there would be under-consumption of preventive care and over-consumption of emergency treatments. MediShield Life ensures universal coverage, reducing the burden of uncompensated care and encouraging early treatment, which is less costly than late-stage intervention.
-
Preventive care reduces long-term demand: Healthier SG (Extract 3) focuses on prevention, which can reduce the incidence of expensive chronic diseases. Given the rapidly ageing population (Extract 2), managing demand through prevention is more sustainable than continually expanding hospital capacity.
-
Government bargaining power: As the dominant payer in the healthcare system, the government can negotiate lower prices for drugs, equipment, and services, helping to contain costs.
Arguments that intervention may have LIMITED effectiveness:
-
Moral hazard: Compulsory insurance (MediShield Life) and subsidies (CHAS) may lead to over-consumption of healthcare services because patients do not bear the full marginal cost. This can drive up total healthcare expenditure despite government efforts to contain costs. Extract 4 shows private healthcare costs rising at 6.5% per year, outpacing inflation — this suggests demand-side pressures are strong.
-
Cost pressures from medical technology and ageing: No amount of government policy can fully offset the cost pressures from an ageing population (Extract 2) and advancing medical technology (Extract 4). These are structural, long-term trends that will continue to push costs upward.
-
Opportunity cost: The S6.2billionHealthcare2020MasterplanandS400 million for Healthier SG represent significant government spending. If these interventions do not sufficiently slow cost growth, the fiscal burden becomes unsustainable.
Evaluation/Conclusion: Government intervention is partially effective in managing healthcare costs. It can address market failures and improve efficiency through preventive care, but it cannot fully counteract structural cost drivers such as demographic change and technological advancement. A combination of supply-side measures (increasing efficiency, training more healthcare workers) and demand-side measures (prevention, co-payment mechanisms to reduce moral hazard) is likely needed. The effectiveness also depends on implementation — for example, whether Healthier SG successfully changes behaviour or merely adds another layer of government spending.
Marking Scheme:
- [1 mark] Explanation of how government intervention can be effective (with evidence from extracts)
- [1 mark] Explanation of limitations of government intervention (with evidence from extracts)
- [1 mark] Use of economic concepts and terminology (market failure, moral hazard, opportunity cost, etc.)
- [1 mark] Evaluative conclusion that weighs both sides and reaches a reasoned judgement
Common Mistakes:
- One-sided answer (only arguing for or against effectiveness)
- Failing to reference the extracts
- Describing policies without evaluating their effectiveness
- No clear conclusion/judgement
Section B: Structured and Essay Questions [30 marks]
Question 11 [2 marks]
Question: Define the term opportunity cost.
Answer:
Opportunity cost is the value of the next best alternative forgone when a choice is made. Since resources are scarce (unlimited wants but limited resources), every decision to allocate resources to one use means giving up the benefits that could have been obtained from the next best alternative.
Example: If the government spends S1billiononanewhospital,theopportunitycostisthenextbestuseofthatS1 billion — for example, building schools or improving public transport.
Marking Scheme:
- [2 marks] Clear and complete definition including "next best alternative forgone"
- [1 mark] Partial definition (e.g., mentions "alternative forgone" but not "next best")
- [0 marks] Incorrect or no response
Question 12 [2 marks]
Question: State two characteristics of a public good.
Answer:
(i) Non-rivalry — One person's consumption of the good does not reduce the amount available for others. For example, one person benefiting from national defence does not diminish the protection available to others.
(ii) Non-excludability — It is not possible to prevent anyone from consuming the good, even if they have not paid for it. For example, a lighthouse cannot exclude non-paying ships from benefiting from its light.
Marking Scheme:
- [1 mark] for each correct characteristic (non-rivalry and non-excludability)
- Accept equivalent phrasing (e.g., "cannot exclude free riders" for non-excludability)
Common Mistakes:
- Confusing public goods with merit goods
- Stating "provided by the government" as a characteristic (this is not a defining feature)
- Stating "free of charge" (public goods may be funded through taxation)
Question 13 [3 marks]
Question: Market for face masks during a health crisis.
(a) What is the equilibrium price? [1 mark]
Answer: The equilibrium price is S$15 per pack, where quantity demanded (120,000) equals quantity supplied (120,000).
(b) If the government imposes a price ceiling of S$8 per pack, calculate the excess demand. Show your working. [2 marks]
Answer: At a price of S8(belowtheequilibriumofS15), we need to estimate the quantities from the table. Since S8liesbetweenS5 and S$10:
-
At S5:Qd=200,000;AtS10: Qd = 160,000
-
At S$8: Qd ≈ 160,000 + [(10−8)/(10−5)] × (200,000−160,000) = 160,000 + (2/5 × 40,000) = 160,000 + 16,000 = 176,000
-
At S5:Qs=40,000;AtS10: Qs = 80,000
-
At S$8: Qs ≈ 40,000 + [(8−5)/(10−5)] × (80,000−40,000) = 40,000 + (3/5 × 40,000) = 40,000 + 24,000 = 64,000
Excess demand = Qd − Qs = 176,000 − 64,000 = 112,000 packs
Alternative simpler approach (acceptable): At S10,Qd=160,000andQs=80,000.AtS8 (lower than S10),QdwouldbeevenhigherandQsevenlower.UsingthevaluesatS10 as a reference: excess demand at S$8 would be greater than 80,000. However, the interpolated answer of 112,000 is more precise.
Simpler acceptable answer (using nearest table values): At S10:Qd=160,000,Qs=80,000.AtS8, Qd > 160,000 and Qs < 80,000. A reasonable estimate of excess demand is greater than 80,000 packs. Award marks for correct method.
Marking Scheme:
- (a) [1 mark] Correct answer: S$15
- (b) [1 mark] Correct method (identifying Qd and Qs at or near S$8)
- (b) [1 mark] Correct calculation of excess demand (accept 112,000 or reasonable estimate with working)
Question 14 [3 marks]
Question: Explain two factors that would cause the demand curve for electric vehicles in Singapore to shift to the right.
Answer:
(i) Government subsidies or tax incentives for electric vehicle purchases The Singapore government has introduced schemes such as the Vehicular Emissions Scheme (VES) and the Electric Vehicle Common Charger Grant, which reduce the effective cost of purchasing and owning an electric vehicle. When the price of purchasing an EV falls due to subsidies, more consumers are willing and able to buy EVs at each price level, causing the demand curve to shift rightward. This is a change in the conditions of demand (specifically, a change in the price of related goods or government policy affecting affordability), not a movement along the demand curve.
(ii) Rising environmental awareness and changing consumer preferences As consumers become more environmentally conscious, preferences shift towards greener alternatives. Campaigns about climate change, air pollution, and Singapore's Green Plan 2030 may increase the desirability of electric vehicles relative to petrol cars. A change in consumer tastes in favour of EVs increases demand at every price level, shifting the demand curve to the right.
Other acceptable answers:
- Increase in income (EVs may be considered a normal or superior good, so rising incomes increase demand)
- Expected future increase in petrol prices (making EVs relatively more attractive)
- Improvement in charging infrastructure (reducing "range anxiety" and making EVs more convenient)
- Increase in price of petrol/diesel vehicles (substitute becomes more expensive)
Marking Scheme:
- [1 mark] for each valid factor correctly identified (× 2)
- [1 mark] for explaining the mechanism of how the factor shifts demand rightward (must explain, not just state)
Common Mistakes:
- Confusing a movement along the demand curve (change in price of EVs themselves) with a shift of the demand curve (change in a non-price determinant)
- Stating "price of EVs falls" as a reason for a rightward shift (this causes movement along the curve, not a shift)
Question 15 [3 marks]
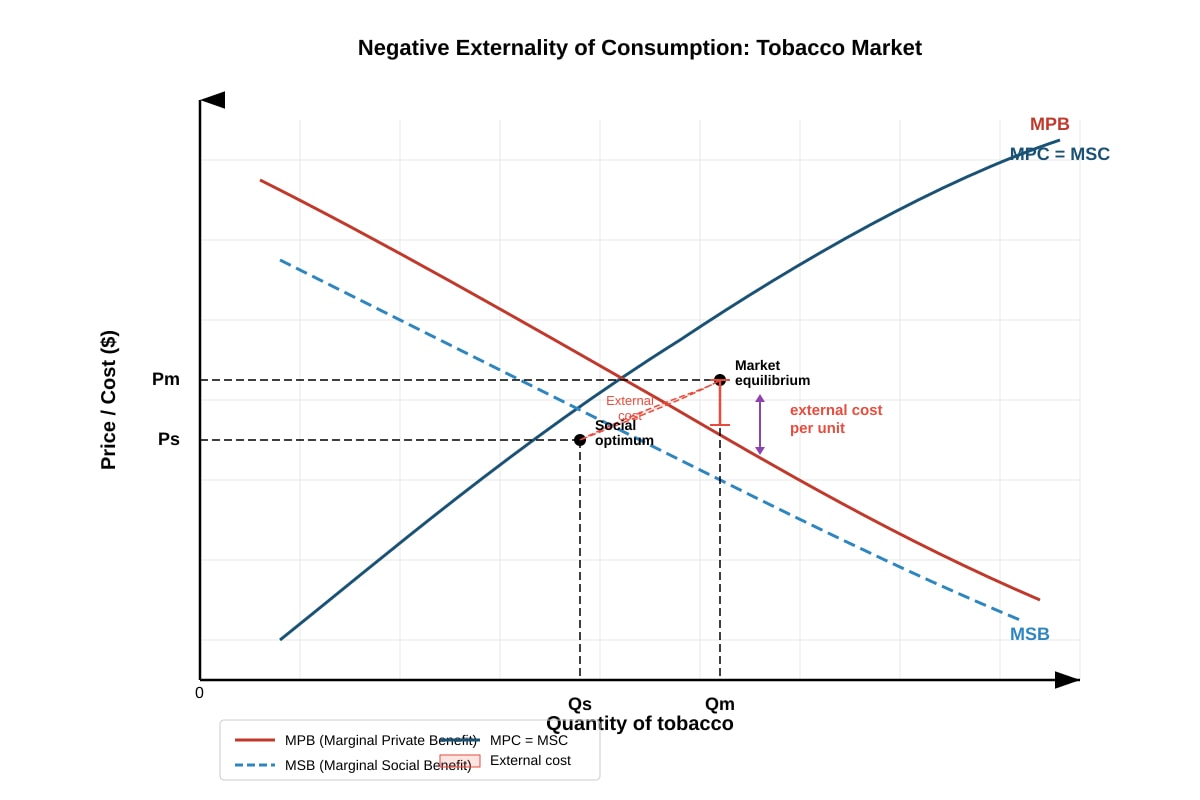
Question: Using the concept of negative externalities, explain why the government might impose a tax on tobacco products. Include a diagram in your answer.
Answer:
Explanation: Tobacco consumption generates negative externalities of consumption — costs imposed on third parties who are not involved in the transaction. These include:
- Health costs from second-hand smoke: Non-smokers exposed to tobacco smoke face increased risks of respiratory diseases, heart disease, and lung cancer. These health costs are borne by individuals and the public healthcare system, not by the smoker or tobacco producer.
- Increased public healthcare expenditure: Smokers require more medical treatment, increasing costs for the government-funded healthcare system (relevant to Extract 1 in Section A).
- Lost productivity: Smoking-related illnesses lead to absenteeism and reduced workplace productivity, imposing costs on employers and the economy.
Because these external costs are not reflected in the market price of tobacco, consumers base their decisions only on their marginal private benefit (MPB), ignoring the external costs. The market equilibrium quantity (Qm) is therefore greater than the socially optimal quantity (Qs), resulting in over-consumption of tobacco.
The tax solution: By imposing a tax on tobacco equal to the marginal external cost, the government effectively increases the private cost of smoking, shifting the MPB curve downward (or equivalently, shifting the supply curve upward by the amount of the tax). This reduces the equilibrium quantity from Qm towards Qs, correcting the over-consumption and bringing the market closer to the socially optimal outcome.
Marking Scheme:
- [1 mark] Clear explanation of negative externalities associated with tobacco consumption
- [1 mark] Correct diagram showing MPB, MSB, market equilibrium (Qm), and social optimum (Qs)
- [1 mark] Explanation of how the tax corrects the market failure (shifts the curve towards the social optimum)
Expected Diagram Features (for Q15-fig1):
- MPB curve above MSB curve (vertical distance = external cost)
- MPC = MSC curve (upward sloping supply)
- Qm > Qs shown clearly
- Tax wedge or shift indicated
- Axes: Price/Cost (vertical), Quantity of tobacco (horizontal)
Common Mistakes:
- Drawing the MSB above MPB (this would be a positive externality)
- Confusing negative externality of consumption with negative externality of production
- Not explaining why the market outcome is socially inefficient
Question 16 [3 marks]
Question: Compare the macroeconomic performance of Country A and Country B.
Answer:
Country A demonstrates stronger macroeconomic performance than Country B across all three indicators:
-
GDP growth: Country A has a GDP growth rate of 3.2%, more than double that of Country B (1.5%). This suggests that Country A's economy is expanding at a faster pace, leading to higher national income, more job creation, and improved living standards.
-
Unemployment: Country A's unemployment rate is significantly lower at 2.8% compared to Country B's 6.5%. A lower unemployment rate indicates that a larger proportion of Country A's labour force is employed, suggesting a more efficient use of resources and higher household incomes. Country B's higher unemployment may indicate structural or cyclical problems in its labour market.
-
Inflation: Country A has a lower inflation rate of 1.2% compared to Country B's 4.8%. While some inflation is normal in a growing economy, Country B's higher inflation rate may indicate demand-pull or cost-push pressures, eroding consumers' purchasing power and creating uncertainty for businesses.
Overall, Country A appears to be in a more favourable macroeconomic position with higher growth, lower unemployment, and more stable prices. Country B may be experiencing stagflationary pressures (low growth combined with high inflation and unemployment).
Marking Scheme:
- [1 mark] Comparison of GDP growth rates with data reference
- [1 mark] Comparison of unemployment rates with data reference
- [1 mark] Comparison of inflation rates with data reference and/or overall evaluative comment
Common Mistakes:
- Describing each country separately without making comparisons
- Failing to quote data from the table
- Not using comparative language ("higher," "lower," "whereas," "in contrast")
Question 17 [3 marks]
Question: Explain the difference between demand-pull inflation and cost-push inflation. Give one example of each.
Answer:
Demand-pull inflation occurs when the overall level of demand in the economy (aggregate demand) grows faster than the economy's productive capacity (aggregate supply), pulling prices upward. It is caused by factors that increase aggregate demand, such as:
- Rising consumer confidence and spending
- Expansionary fiscal policy (increased government spending or tax cuts)
- Expansionary monetary policy (lower interest rates increasing borrowing and spending)
- Rising exports
Example: If the Singapore government significantly increases spending on infrastructure projects (e.g., building new MRT lines), this raises aggregate demand. If the economy is near full employment, the increased demand cannot be met by increased output, so prices rise — this is demand-pull inflation.
Cost-push inflation occurs when the costs of production increase, causing firms to raise prices to maintain profit margins. It is caused by factors that reduce aggregate supply, such as:
- Rising wages (e.g., due to labour shortages)
- Increase in raw material prices (e.g., oil price shocks)
- Depreciation of the exchange rate (making imports more expensive)
- Supply chain disruptions
Example: If global oil prices rise sharply, the cost of production and transportation increases for Singaporean firms. Firms pass these higher costs on to consumers in the form of higher prices, leading to cost-push inflation.
Key difference: Demand-pull inflation is caused by excess demand ("too much money chasing too few goods"), while cost-push inflation is caused by rising production costs reducing aggregate supply.
Marking Scheme:
- [1 mark] Clear explanation of demand-pull inflation
- [1 mark] Clear explanation of cost-push inflation
- [1 mark] One valid example for each type (or clear distinction between the two)
Question 18 [3 marks]
Question: Singapore's trade data.
(a) Describe the trend in Singapore's balance of trade from 2019 to 2022. [1 mark]
Answer: Singapore maintained a trade surplus throughout the period from 2019 to 2022, with exports exceeding imports in all four years. The balance of trade was S40billionin2019,increasedtoS50 billion in 2020 and 2021, before falling back to S40billionin2022.Overall,thetradesurplusremainedrelativelystable,fluctuatingbetweenS40 billion and S$50 billion.
(b) Suggest one possible reason for the change in the balance of trade between 2020 and 2021. [2 marks]
Answer: Between 2020 and 2021, the balance of trade remained constant at S50billion,butbothexportsandimportsincreasedsignificantly—exportsrosefromS490 billion to S560billion(anincreaseofS70 billion), while imports rose from S440billiontoS510 billion (also S$70 billion).
One possible reason for the increase in both exports and imports is the global economic recovery from the COVID-19 pandemic. In 2020, global trade was disrupted by lockdowns and supply chain disruptions. In 2021, as economies reopened, demand for Singapore's exports (such as electronics, pharmaceuticals, and financial services) recovered strongly. At the same time, Singapore's imports of raw materials, intermediate goods, and consumer goods also increased as domestic and global demand picked up. Since both exports and imports grew by the same amount, the trade balance remained unchanged at S$50 billion.
Marking Scheme:
- (a) [1 mark] Correct description of the trend (trade surplus, fluctuating between S40bnandS50bn)
- (b) [1 mark] Identification of a valid reason (e.g., post-COVID recovery, global demand increase)
- (b) [1 mark] Development of the reason with reference to the data
Question 19 [4 marks]
Question: Evaluate the effectiveness of using subsidies as a government intervention to correct market failure in the market for merit goods such as education.
Answer:
Introduction: Education is a merit good — a good that is under-consumed in a free market because individuals do not fully appreciate its long-term private benefits (information failure) and because it generates positive externalities for society. Subsidies are one form of government intervention used to increase consumption towards the socially optimal level.
Arguments that subsidies ARE effective:
-
Increasing consumption towards the socially optimal level: By reducing the price of education, subsidies make it more affordable, encouraging more individuals to consume education. This helps to correct the under-consumption that arises from information failure (individuals underestimating the future returns to education) and positive externalities (a more educated workforce benefits society through higher productivity, lower crime rates, and better civic participation).
-
Improving equity and access: Subsidies ensure that lower-income households can access education, reducing inequality. Without subsidies, education would be disproportionately consumed by higher-income groups, leading to a less equitable society and a waste of human capital.
-
Long-term economic benefits: Subsidised education increases the stock of human capital, leading to higher productivity, innovation, and economic growth. This generates tax revenue that can offset the cost of the subsidy over time.
Arguments that subsidies may have LIMITED effectiveness:
-
Opportunity cost: Subsidies require government funding, which has an opportunity cost. The money spent on education subsidies could have been used for healthcare, infrastructure, or other public goods. If the subsidy is large, it may strain the government budget.
-
Ineffectiveness if demand is price inelastic: If the demand for education is price inelastic (e.g., because cultural factors or lack of awareness are the main barriers, not cost), then a subsidy may not significantly increase consumption. In this case, other interventions (e.g., awareness campaigns, compulsory education laws) may be more effective.
-
Potential for government failure: The government may not accurately estimate the size of the positive externality, leading to over-subsidisation (wasting resources) or under-subsidisation (failing to correct the market failure). Additionally, subsidies may benefit middle- and upper-income groups more than the poor if they are not well-targeted.
-
Supply-side constraints: Subsidies increase demand, but if the supply of education places is limited (e.g., insufficient schools, teachers), the result may be excess demand or rising costs rather than increased access.
Evaluation/Conclusion: Subsidies can be an effective tool for correcting market failure in education, particularly when the main barrier to consumption is affordability. However, their effectiveness depends on the price elasticity of demand, the accuracy of the subsidy level, and the availability of supply-side capacity. Subsidies are likely to be most effective when combined with other policies such as awareness campaigns, quality regulation, and investment in educational infrastructure.
Marking Scheme:
- [1 mark] Explanation of how subsidies correct market failure in education (with reference to merit goods/positive externalities)
- [1 mark] Discussion of limitations of subsidies (opportunity cost, inelastic demand, government failure, supply constraints)
- [1 mark] Use of economic concepts and terminology
- [1 mark] Evaluative conclusion that weighs both sides
Question 20 [4 marks]
Question: Evaluate which policy option (congestion charge vs. public transport spending) is likely to be more effective in reducing traffic congestion.
Answer:
Introduction: Traffic congestion is a form of market failure caused by negative externalities of consumption. Each additional driver on the road imposes costs on other road users (longer journey times, pollution, accidents) that are not reflected in the private cost of driving. The government can intervene through price-based measures (Option A: congestion charge) or supply-side measures (Option B: public transport investment).
Evaluation of Option A — Congestion Charge:
Advantages:
- Directly addresses the externality: A congestion charge increases the private cost of driving during peak hours, internalising the external cost. This reduces the number of vehicles on the road, moving the market closer to the socially optimal level of road use.
- Price mechanism is efficient: Drivers who value the journey most (highest marginal benefit) will continue to drive, while those with lower marginal benefit will switch to alternatives. This ensures an efficient allocation of road space.
- Generates revenue: The S$5 charge per vehicle generates government revenue that can be reinvested in transport infrastructure.
- Quick to implement and adjust: The charge can be implemented relatively quickly and adjusted based on effectiveness.
Disadvantages:
- Regressive impact: The charge may disproportionately affect lower-income drivers who cannot easily switch to alternatives or adjust their travel times.
- Demand may be price inelastic: If commuters have no viable alternative (e.g., poor public transport in their area), demand for driving may be inelastic, and the charge may not significantly reduce congestion while imposing a financial burden.
- May displace congestion: Drivers may reroute to avoid the charged zone, causing congestion in other areas.
Evaluation of Option B — Public Transport Investment:
Advantages:
- Addresses the root cause: By improving bus and rail services, the government provides a viable alternative to driving, making it easier for commuters to switch. This addresses the lack of substitutes that makes demand for driving inelastic.
- Long-term structural change: Improved public transport infrastructure has lasting benefits beyond congestion reduction, including reduced pollution, improved accessibility, and economic productivity gains.
- More equitable: Better public transport benefits all income groups, particularly lower-income commuters who rely more heavily on public transport.
Disadvantages:
- Time lag: Building new rail lines and improving bus services takes years. The S$500 million investment may not yield immediate congestion relief.
- High cost: S$500 million is a substantial investment with significant opportunity cost.
- May not reduce driving sufficiently: Even with improved public transport, some commuters may continue to drive due to convenience, status, or the nature of their journeys (e.g., multiple stops). The effectiveness depends on the quality and coverage of the improved services.
Evaluation/Conclusion: Option A (congestion charge) is likely to be more effective in the short term as it directly changes behaviour through price signals and can be implemented quickly. However, its effectiveness depends on the availability of alternatives and the price elasticity of demand for driving.
Option B (public transport investment) is likely to be more effective in the long term as it addresses the structural lack of alternatives and provides a sustainable solution. However, it is costly and slow to implement.
The most effective approach would likely be a combination of both: implementing a congestion charge in the short term to immediately reduce demand for driving, while simultaneously investing in public transport to provide viable alternatives. This dual approach addresses both the demand side and supply side of the problem.
Marking Scheme:
- [1 mark] Analysis of Option A (congestion charge) with economic reasoning
- [1 mark] Analysis of Option B (public transport investment) with economic reasoning
- [1 mark] Use of economic concepts (externalities, price elasticity, opportunity cost, etc.)
- [1 mark] Evaluative conclusion that compares both options and reaches a reasoned judgement
Summary of Marks
| Section | Questions | Marks |
|---|---|---|
| Section A: Data Response | Q1–Q10 | 30 |
| Section B: Structured & Essay | Q11–Q20 | 30 |
| Total | 20 questions | 60 |
End of Answer Key
Free quiz and exam paper access
Enter your details to view this paper
Your access is remembered on this device.