From Real Exams Exam Paper
A Level H1 Economics Practice Paper 1
Free A Level H1 Econs Practice Paper 1, HY3 Exam version, with questions, answers, and A Level-style practice for Singapore students.
These static practice materials are generated from the site's syllabus and paper-generation workflow, with source and model context shown so students and parents can evaluate the material before use.
Questions
Free quiz and exam paper access
Enter your details to view this paper
Your access is remembered on this device.
Answers
Answer Key — TuitionGoWhere Exam Practice (AI) Practice Paper (Data Response) Version 1
Subject: Economics H1
Level: A-Level
Total Marks: 60
Section A: Data Interpretation (18 marks)
Q1 [2 marks]
Compare health spending % GDP, Country A vs B, 2018–2022.
- Country A rose from 3.1% (2018) to 4.1% (2022); Country B from 5.4% to 6.4%. [1]
- B consistently higher than A; both increased, but B remained above by ~2.3 percentage points. [1]
Teaching note: Compare both series with reference to Table 1; use comparative language.
Q2 [2 marks]
Trend in Country A tourism receipts 2018–2022:
- Increased 22.0→24.1 (2018–19), fell sharply to 9.8 in 2020, recovered to 18.3 by 2022. [1]
- Overall volatile: collapse in 2020 then partial recovery, not back to 2019 level. [1]
Marking: Direction + turning point.
Q3 [2 marks]
Compare tourism receipts A vs B:
- A higher than B every year (e.g., 22.0 vs 14.5 in 2018). [1]
- Both fell in 2020 and recovered partially; A's drop larger in absolute terms. [1]
Q4 [2 marks]
Why A's health spending rose 2020:
- Extract 1 states pandemic caused sharp increase. [1]
- Likely higher public health needs, emergency expenditure. [1]
Q5 [2 marks]
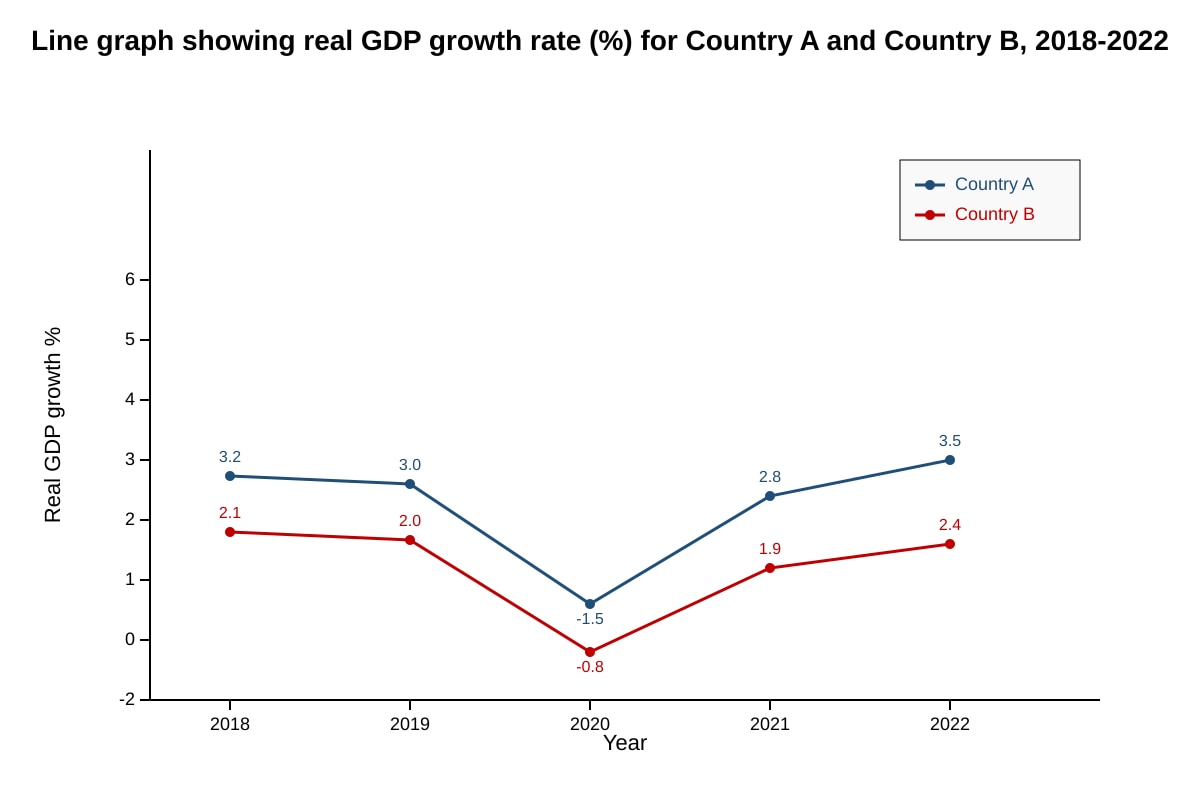
Using Q5-fig1 (graph values given):
- A growth higher than B each year (e.g., 3.2 vs 2.1 in 2018). [1]
- Both negative in 2020 (A -1.5, B -0.8), recovered after. [1]
Expected visual: two labelled lines with stated data.
Q6 [2 marks]
Similarity: both had tourism collapse in 2020 and health spend rise. [1]
Difference: B had higher health spending ratio throughout. [1]
Q7 [2 marks]
Limitation: tourism receipts ignore income distribution, non-market goods, environmental costs. [2] (any one valid point = 2)
Section B: Microeconomic Data Response (18 marks)
Q8 [2 marks]
PED = %ΔQd / %ΔP = (-8%) / (20%) = -0.4. [2]
Working: show division.
Q9 [2 marks]
Value -0.4 → inelastic (|PED|<1). [1]
Users treat as necessary, poor alternatives → unresponsive to price. [1]
Q10 [2 marks]
Short-run PES likely low (<1): drivers/cars fixed in short run, limited rapid scale-up. [2]
Q11 [3 marks]
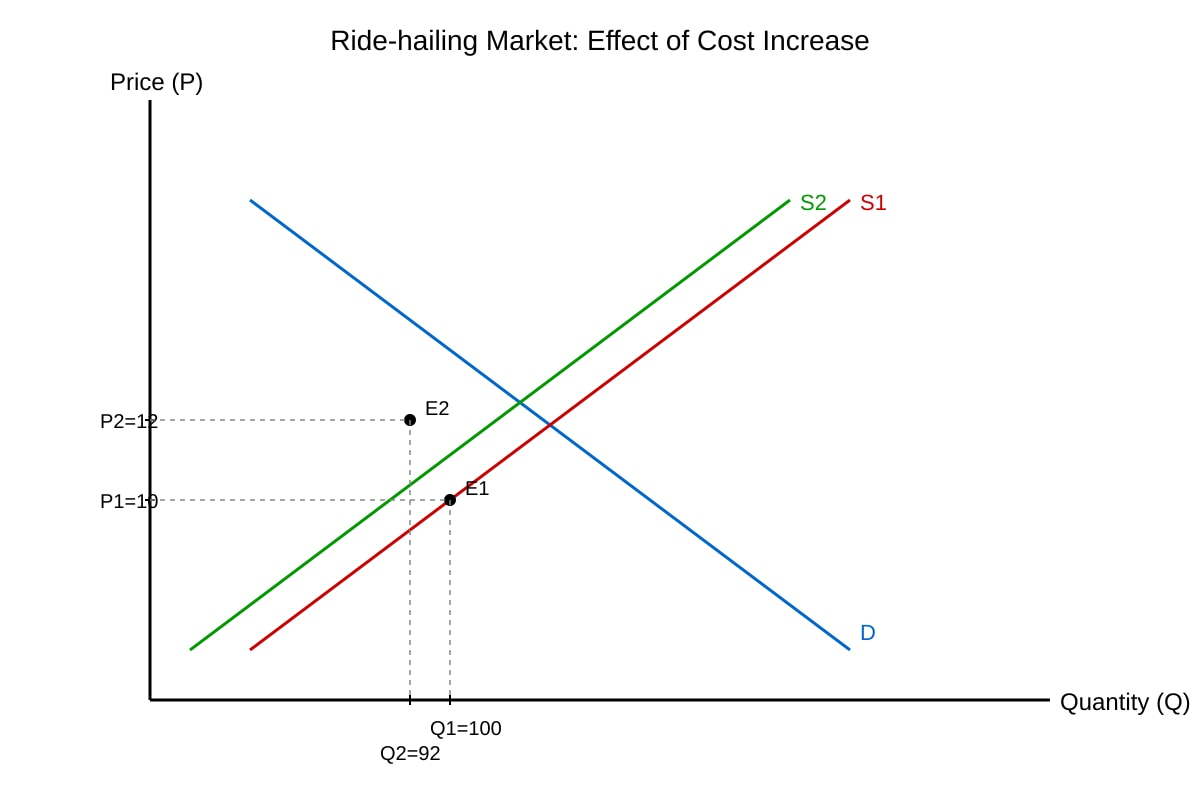
Using Q11-fig1: cost increase shifts S left (S1→S2). [1]
Equilibrium P rises (10→12), Q falls (100→92). [2]
Diagram must show left shift, new E2.
Q12 [4 marks]
Discuss equity of tax:
- For: tax may reduce use by rich, raise revenue for public transport. [2]
- Against: inelastic demand means burden falls on users who lack alternatives, worsening equity. [2]
Descriptors: two-sided with extract link.
Q13 [3 marks]
Market failure: negative externality from emissions (if extract implies) OR information failure. From extract: necessity with poor alternatives suggests incomplete competition. Award 3 for clear cause + explanation.
Section C: Macro & Policy (24 marks)
Q14 [2 marks]
Benefit: emissions fell, adoption rose. [1] Cost: govt expenditure rose. [1]
Q15 [3 marks]
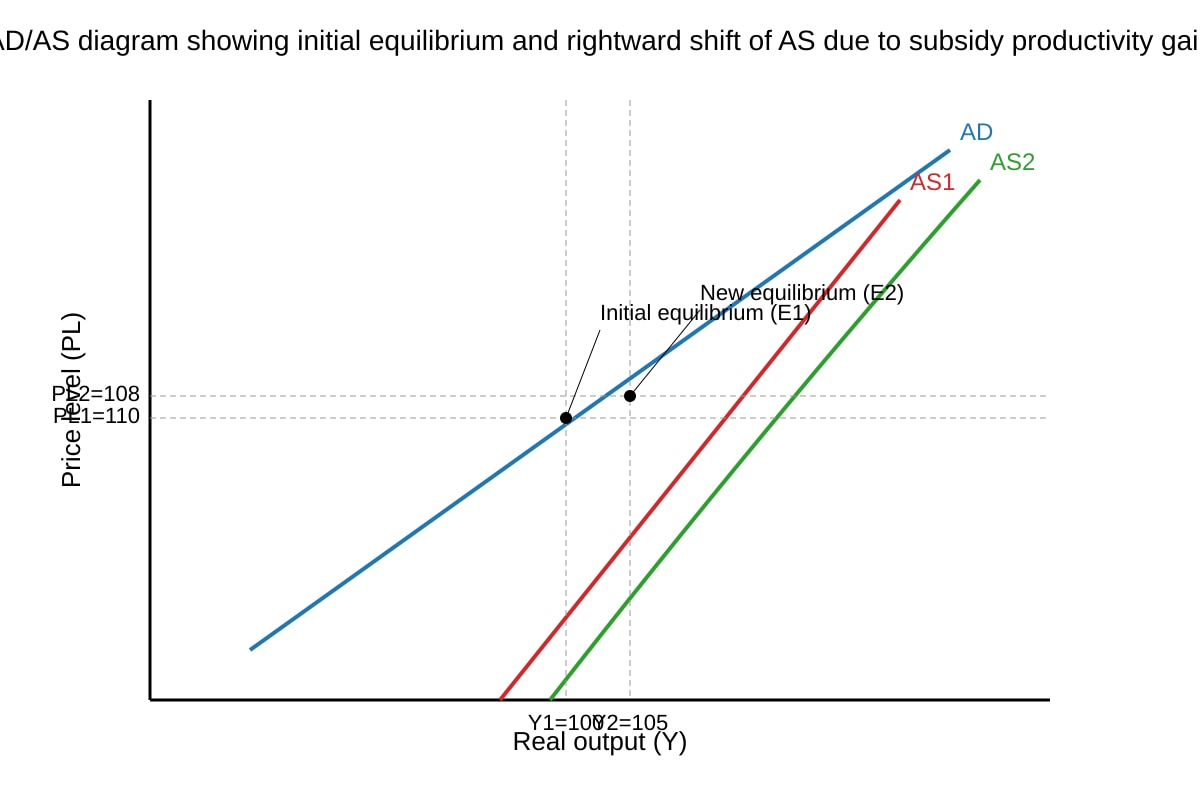
Using Q15-fig1: subsidy raises productivity → AS right (AS1→AS2). [1]
Y rises (100→105), PL falls (110→108). [2]
Q16 [2 marks]
Health spending 3.3% (2019) → 4.2% (2021), increase of 0.9 percentage points. [2]
Q17 [7 marks]
Discuss living standards 2018–2022:
- For improved: health spend up, tourism recovery, solar adoption, emissions down. [3]
- Against: tourism not full recovery, low-income gap in solar, GDP dipped 2020. [3]
- Conclusion with balanced judgement. [1]
Marking descriptors: evidence (2), analysis (3), evaluation (2).
Q18 [5 marks]
Efficiency: subsidy corrects externality, AS up. [2]
Equity: fails low-income who can't pay upfront. [2]
Overall partial effectiveness. [1]
Q19 [2 marks]
Low-income households face liquidity constraint → non-provision despite subsidy. [2]
Q20 [3 marks]
Unintended: higher govt expenditure → opportunity cost of other spending. [1]
Impact: possible future tax or deficit. [2]