A-Level Biology H3 Quiz - Ecology
Name:
Class:
Date:
Score:
Duration: 60 minutes
Total Marks: 40
Topic: Ecology (syllabus-first practice; not derived from past-year papers)
Instructions:
- Answer all 20 questions.
- Section A: short structured items (1–8). Section B: data and application (9–14). Section C: extended response (15–20).
- Use clear scientific terminology. Show workings where requested.
- This quiz is generated from syllabus context only; no exam-derived template exists for this subject group.
Section A: Knowledge and Direct Application (Questions 1–8)
1. State one defining feature of an ecosystem that distinguishes it from a community. [1]
2. Define "gross primary productivity" (GPP) in an ecological context. [1]
3. Name the trophic level occupied by herbivores in a food chain. [1]
4. Using the Hardy–Weinberg equation, state the term representing the frequency of heterozygous carriers in a population. [1]
5. Give one example of a biotic factor that can limit population size. [1]
6. State the process by which nitrogen gas is converted into ammonia by soil bacteria. [1]
7. Explain briefly why a pyramid of biomass can be inverted in an aquatic ecosystem. [1]
8. Identify one human activity that increases ecological footprint at the national level. [1]
Section B: Data Handling and Application (Questions 9–14)
9. A pond ecosystem was sampled. The table below shows species counts.
| Species | Individuals |
|---|
| A | 50 |
| B | 30 |
| C | 20 |
| Total = 100. | |
Calculate the Simpson's Index of Diversity D=1−∑(n/N)2. Show working. [3]
10. The population of a beetle species grew from 200 to 800 in 6 days under constant resources. Calculate the mean daily growth rate as a percentage. [2]
11. A forest fragment has the following carbon stocks: trees 120 t C ha−1, soil 80 t C ha−1. If climate mitigation requires 250 t C ha−1 to offset local emissions, calculate the deficit per hectare. [2]
12.
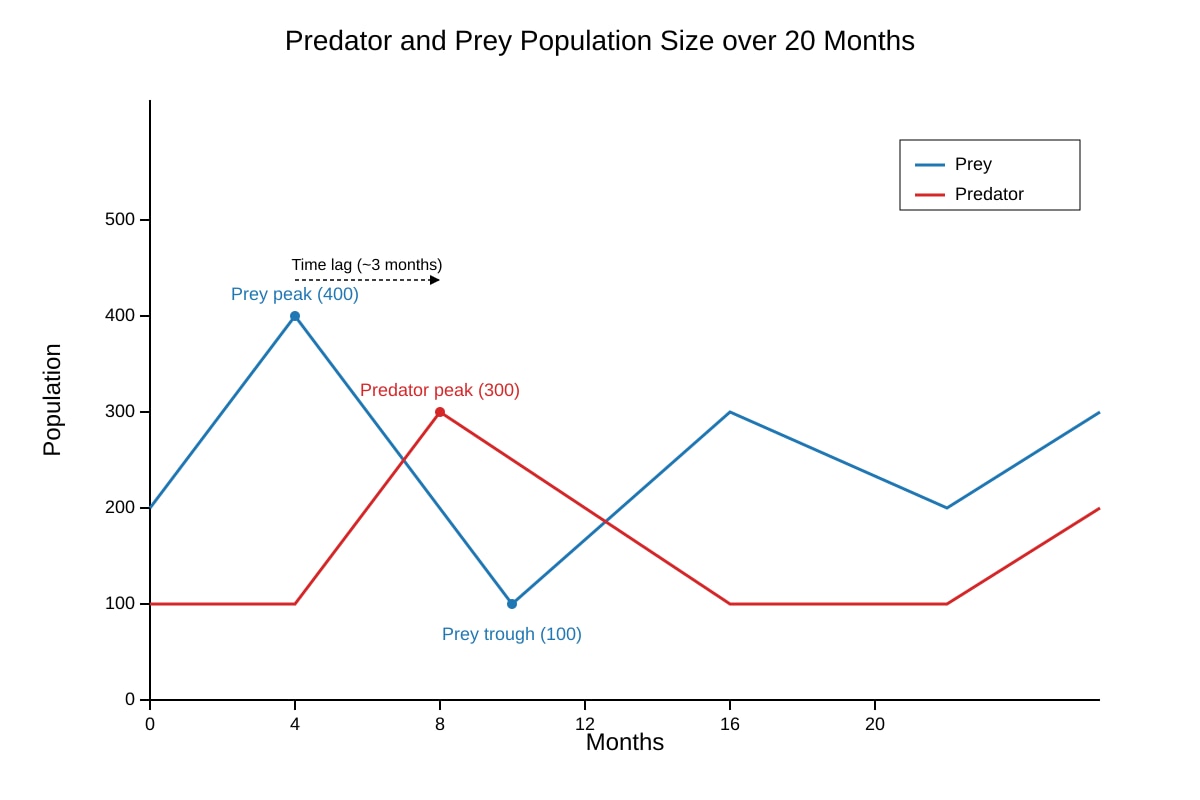
Generated graph for Q12.
Using the graph, describe the relationship between predator and prey cycles. [2]
13. Explain how eutrophication from fertilizer runoff reduces dissolved oxygen in a lake. [3]
14. A species has p=0.7 allele frequency for a beneficial trait. Use Hardy–Weinberg to find expected frequency of homozygous dominant individuals. [2]
Section C: Extended Response (Questions 15–20)
15. Discuss how adaptive radiation can increase regional biodiversity, using one named example. [4]
16. Evaluate the role of human microbiota in maintaining ecosystem-like stability within the host. [3]
17. Using Core Idea 3 and Extension B, explain how CAM plants respond to climate change stressors. [4]
18. A chi-squared test for independence yielded χ2=5.99, df = 2, critical value at p=0.05 is 5.99. State conclusion. [2]
19. Compare the contribution of C3 and C4 plants to mitigating global warming. [3]
20. Synthesise how polyploidy and hybridisation may complicate phylogeny reconstruction in disturbed ecosystems. [4]
</stage5_quiz_answers_md>
A-Level Biology H3 Quiz - Ecology: Answer Key
Total Marks: 40
Syllabus-first content; no past-year template used.
1. [1] An ecosystem includes both biotic (living) community and abiotic (non-living) environment, whereas a community is only the interacting populations.
Teaching note: Ecosystem = community + physical environment.
2. [1] GPP is the total rate of photosynthesis (chemical energy fixed by autotrophs) per unit area/time before respiration losses.
Define: GPP = NPP + respiration.
3. [1] Primary consumers.
Chain: Producer → Primary consumer (herbivore) → Secondary consumer.
4. [1] 2pq in p2+2pq+q2=1.
Heterozygote frequency = 2pq.
5. [1] Any one: competition, predation, disease, parasitism.
Mark: accept one biotic limiting factor.
6. [1] Nitrogen fixation.
By Azotobacter, Rhizobium etc.
7. [1] Because small phytoplankton have high turnover and support larger zooplankton biomass temporarily.
Inverted biomass pyramid common in oceans.
8. [1] Deforestation / excessive fossil fuel use / urban expansion.
Links to ecological footprint.
9. [3]
D=1−[(50/100)2+(30/100)2+(20/100)2]
=1−[0.25+0.09+0.04]=1−0.38=0.62.
Marks: 1 for formula, 1 for substitution, 1 for answer.
10. [2]
Growth factor = 800/200=4 over 6 days.
Daily rate r: 200(1+r)6=800⇒(1+r)6=4⇒1+r=41/6≈1.26.
r≈0.26=26%.
Marks: 1 method, 1 answer.
11. [2]
Stock = 120+80=200 t C ha−1.
Deficit = 250−200=50 t C ha−1.
Marks: 1 sum, 1 deficit.
12. [2]
Predator peaks lag prey peaks by ~3 months; cycles oscillate.
Use graph: prey peak month 4, predator peak month 7.
Marks: 1 lag, 1 cycle description.
13. [3]
Fertilizer → nutrient enrichment → algal bloom → death & bacterial decomposition → O₂ consumed → hypoxia.
Marks: 1 enrichment, 1 decomposition, 1 O₂ drop.
14. [2]
p=0.7,q=0.3. Homozygous dominant = p2=0.49.
Marks: 1 sq, 1 value.
15. [4]
Adaptive radiation: one ancestor diversifies to fill niches. Example: Darwin's finches (Galápagos) – beak forms for seed/insect/flower. Increases species richness and functional diversity.
Marks: 1 def, 1 example, 2 consequence.
16. [3]
Microbiota resist pathogens (competitive exclusion), train immunity, aid metabolism. Stability like ecosystem via redundancy.
Marks: 1 each point.
17. [4]
CAM: nocturnal stomatal opening fixes CO₂ as malate, day photosynthesis with closed stomata → water conservation under heat/drought (Extension B). Links to Core Idea 3 temporal separation.
Marks: 2 mechanism, 2 climate link.
18. [2]
χ2=5.99= critical → reject null at p=0.05; significant association.
Marks: 1 compare, 1 conclusion.
19. [3]
C3: dominant, less efficient under heat; C4: high temp adapted, less photorespiration, more carbon gain. Both sequester CO₂; C4 better mitigator in tropics.
Marks: 1 C3, 1 C4, 1 compare.
20. [4]
Polyploidy creates instant reproductive isolation; hybridisation mixes genomes; introgression blurs branches. Disturbed ecosystems show reticulate evolution, not clean tree.
Marks: 1 each concept + synthesis.
</stage5_quiz_answers_md>
<stage5_quiz_md>
A-Level Biology H3 Quiz - Ecology
Name:
Class:
Date:
Score:
Duration: 60 minutes
Total Marks: 40
Topic: Ecology (syllabus-first practice; not derived from past-year papers)
Instructions:
- Answer all 20 questions.
- Section A: short structured items (1–8). Section B: data and application (9–14). Section C: extended response (15–20).
- Use clear scientific terminology. Show workings where requested.
- This quiz is generated from syllabus context only; no exam-derived template exists for this subject group.
Section A: Knowledge and Direct Application (Questions 1–8)
1. State one defining feature of an ecosystem that distinguishes it from a community. [1]
2. Define "gross primary productivity" (GPP) in an ecological context. [1]
3. Name the trophic level occupied by herbivores in a food chain. [1]
4. Using the Hardy–Weinberg equation, state the term representing the frequency of heterozygous carriers in a population. [1]
5. Give one example of a biotic factor that can limit population size. [1]
6. State the process by which nitrogen gas is converted into ammonia by soil bacteria. [1]
7. Explain briefly why a pyramid of biomass can be inverted in an aquatic ecosystem. [1]
8. Identify one human activity that increases ecological footprint at the national level. [1]
Section B: Data Handling and Application (Questions 9–14)
9. A pond ecosystem was sampled. The table below shows species counts.
| Species | Individuals |
|---|
| A | 50 |
| B | 30 |
| C | 20 |
| Total = 100. | |
Calculate the Simpson's Index of Diversity D=1−∑(n/N)2. Show working. [3]
10. The population of a beetle species grew from 200 to 800 in 6 days under constant resources. Calculate the mean daily growth rate as a percentage. [2]
11. A forest fragment has the following carbon stocks: trees 120 t C ha−1, soil 80 t C ha−1. If climate mitigation requires 250 t C ha−1 to offset local emissions, calculate the deficit per hectare. [2]
12.
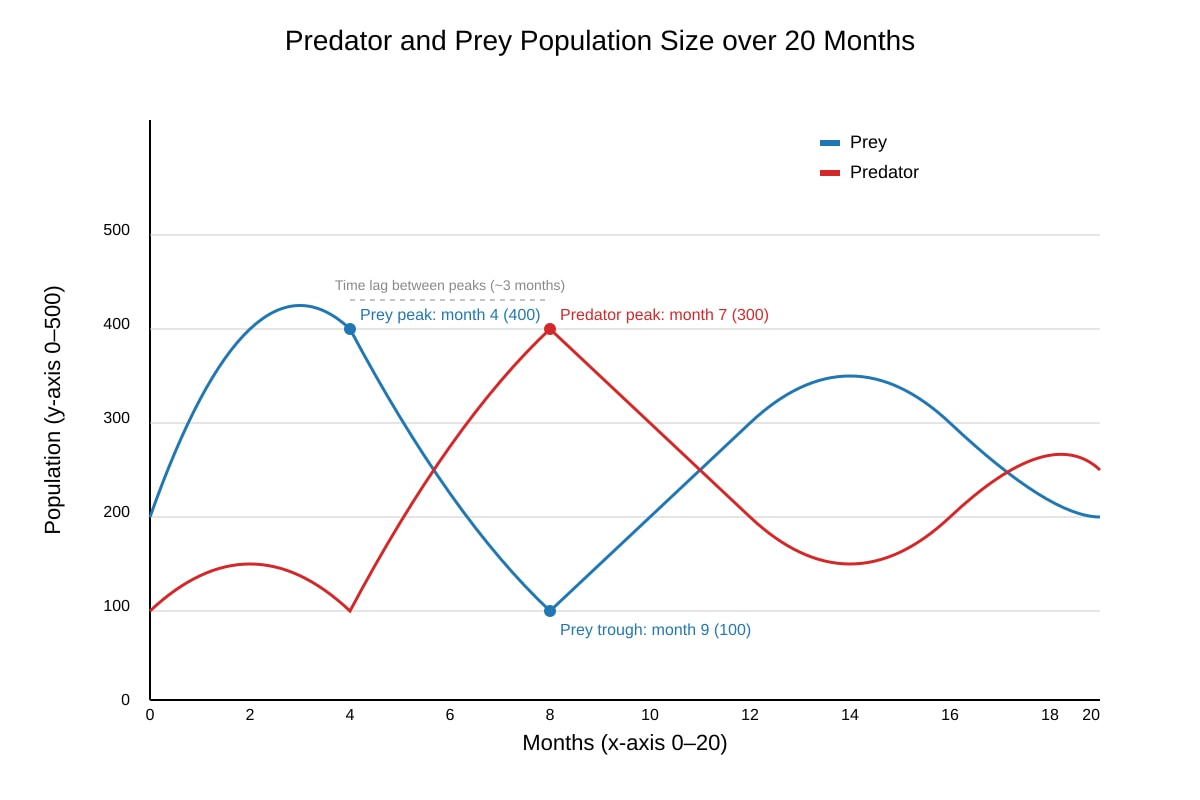
Generated graph for Q12.
Using the graph, describe the relationship between predator and prey cycles. [2]
13. Explain how eutrophication from fertilizer runoff reduces dissolved oxygen in a lake. [3]
14. A species has p=0.7 allele frequency for a beneficial trait. Use Hardy–Weinberg to find expected frequency of homozygous dominant individuals. [2]
Section C: Extended Response (Questions 15–20)
15. Discuss how adaptive radiation can increase regional biodiversity, using one named example. [4]
16. Evaluate the role of human microbiota in maintaining ecosystem-like stability within the host. [3]
17. Using Core Idea 3 and Extension B, explain how CAM plants respond to climate change stressors. [4]
18. A chi-squared test for independence yielded χ2=5.99, df = 2, critical value at p=0.05 is 5.99. State conclusion. [2]
19. Compare the contribution of C3 and C4 plants to mitigating global warming. [3]
20. Synthesise how polyploidy and hybridisation may complicate phylogeny reconstruction in disturbed ecosystems. [4]